BONK/USDT — Accumulation Zone Before a Potential Major Reversal?BONK is once again testing its historical demand zone between 0.000015–0.0000196 USDT, an area that has repeatedly acted as a strong defensive wall for buyers.
Each previous visit to this zone has sparked a surge in buying pressure, leading to significant rebounds. Now, the market faces the same critical point — a decisive moment that will determine whether this is the final phase of accumulation or the beginning of a deeper breakdown.
---
Technical Structure and Pattern Insight
On the 3-day timeframe, BONK has formed a clear triple-bottom pattern, marked by three rounded lows occurring around the same price range.
This formation typically represents institutional accumulation, as large players consistently defend a specific level to absorb selling pressure.
However, this pattern remains unconfirmed until the price manages to break and close above the key resistance near 0.00002710.
A breakout with strong volume from that level would confirm a potential mid-term bullish reversal and signal the start of a new accumulation-to-expansion phase.
---
Bullish Scenario — Reversal Potential
If BONK holds and rebounds from the current demand zone, it could mark the beginning of a major structural reversal.
The first leg of recovery would aim toward previous resistance levels, where prior distribution occurred.
A confirmed 3D close above the neckline would be a strong bullish validation, showing that buying pressure has regained market control.
In this case, BONK would likely form a macro higher low, reinforcing a shift in momentum from accumulation to a fresh bullish trend.
---
Bearish Scenario — Breakdown Risk
On the other hand, if BONK fails to defend this zone and closes a 3D candle below 0.000015, the bullish structure becomes invalidated.
Such a breakdown would open the door to a retest of lower support regions and indicate that the downtrend remains intact.
This would confirm that the market is not yet ready for a sustainable recovery and that further accumulation might be needed before any significant bullish move can develop.
---
Strategic Outlook
BONK currently stands at a critical equilibrium point — the boundary between reversal and continuation.
If the demand zone holds, the triple-bottom formation could trigger a strong upward expansion.
If it breaks, bearish continuation becomes highly probable, bringing the market into a new consolidation phase near previous lows.
Traders are advised to wait for confirmation before positioning, manage risk carefully, and avoid overexposure.
The next move will likely define BONK’s mid-term trend direction, determining whether this accumulation is the beginning of a new cycle — or merely a pause before the next leg down.
#BONK #BONKUSDT #CryptoAnalysis #AltcoinSetup #TechnicalAnalysis #MarketStructure #SwingTrade #TripleBottom #DemandZone #ReversalSetup #CryptoTA #PriceAction #BreakoutStrategy
Bonkusdtsignals

BONK/USDT – Demand Zone Retest as Key SupportCurrently, BONK/USDT is once again testing its major demand zone (yellow box), which has acted as a strong battleground between buyers and sellers multiple times since early 2024. This area now serves as the “last line of defense” before the price risks entering a deeper corrective phase.
---
🔑 Key Levels
Main Support (Demand Zone): 0.0000227 – the decisive area.
Bullish Targets (Step-by-step Resistances):
🎯 TP1: 0.0000273
🎯 TP2: 0.0000354
🎯 TP3: 0.0000524
Recent Local High: 0.0000622
---
🐂 Bullish Scenario
As long as price holds and rebounds inside the yellow demand zone, there’s a strong chance of a reversal bounce.
Confirmation comes from a 3D bullish engulfing candle with strong volume.
If BONK breaks above TP1, momentum could extend toward TP2, and eventually TP3, offering more than +130% upside from current levels.
A new higher low structure would start forming, signaling a potential mid-term trend shift back to bullish.
---
🐻 Bearish Scenario
If the 3D candle closes below the yellow demand zone, this support flips into a new resistance.
A breakdown would open the door for BONK to revisit lower support levels from early 2024 consolidation.
Bearish momentum could accelerate as trapped buyers inside the demand zone exit their positions.
---
📌 Technical Pattern & Market Structure
The demand zone has historically acted as a reliable accumulation area, preventing deeper drops.
Repeated sharp rejections at resistance suggest significant supply pressure above.
In short, BONK is now in a “decisive range”: either it starts a new accumulation phase (bullish case) or breaks down into another bearish leg.
---
🎯 Trading Strategy
Conservative Entry: wait for a confirmed 3D bullish close above the demand zone.
Aggressive Entry: scale in within the demand zone, add more if bullish confirmation appears.
Stop Loss: below the demand zone (~10–15% lower).
Take Profit: scale out at TP1 → TP2 → TP3.
Risk Management: never risk more than 1–3% of your capital per trade.
---
📝 Conclusion
BONK is at a critical decision point. If the demand zone holds, there’s strong upside potential with staged targets up to +130%. But if it breaks down, the bearish trend regains dominance, exposing lower support levels.
⚖️ The market’s reaction at this demand zone will define the mid-term direction. Traders should wait for a 3D candle confirmation before committing to larger positions.
#BONK #BONKUSDT #Crypto #CryptoTrading #TechnicalAnalysis #SupportResistance #DemandZone #Breakout #SwingTrading

BONKUSDT – Let the Market Come to YouIn a possible Q3 correction, BONKUSDT may retest the green box zones below.
These areas are not predictions — they’re prepared zones where I’ll be waiting, not chasing.
🟩 I don’t buy strength blindly. I buy value with structure.
All risk-on markets typically experience significant corrections in the third quarter of the year and struggle to recover from this correction until the end of the year.
🎯 My Strategy
🔔 Set alerts for the green boxes
🕐 Switch to the 1-hour timeframe when triggered
📈 Wait for upward breakout + positive CDV
🎯 Only then: take the shot — one bullet, risk-managed
“Markets reward those who wait with a plan, not those who rush with emotion.”
Let’s stay patient, structured, and consistent.
— UmutTrades 💙
📌I keep my charts clean and simple because I believe clarity leads to better decisions.
📌My approach is built on years of experience and a solid track record. I don’t claim to know it all but I’m confident in my ability to spot high-probability setups.
📌If you would like to learn how to use the heatmap, cumulative volume delta and volume footprint techniques that I use below to determine very accurate demand regions, you can send me a private message. I help anyone who wants it completely free of charge.
🔑I have a long list of my proven technique below:
🎯 ZENUSDT.P: Patience & Profitability | %230 Reaction from the Sniper Entry
🐶 DOGEUSDT.P: Next Move
🎨 RENDERUSDT.P: Opportunity of the Month
💎 ETHUSDT.P: Where to Retrace
🟢 BNBUSDT.P: Potential Surge
📊 BTC Dominance: Reaction Zone
🌊 WAVESUSDT.P: Demand Zone Potential
🟣 UNIUSDT.P: Long-Term Trade
🔵 XRPUSDT.P: Entry Zones
🔗 LINKUSDT.P: Follow The River
📈 BTCUSDT.P: Two Key Demand Zones
🟩 POLUSDT: Bullish Momentum
🌟 PENDLEUSDT.P: Where Opportunity Meets Precision
🔥 BTCUSDT.P: Liquidation of Highly Leveraged Longs
🌊 SOLUSDT.P: SOL's Dip - Your Opportunity
🐸 1000PEPEUSDT.P: Prime Bounce Zone Unlocked
🚀 ETHUSDT.P: Set to Explode - Don't Miss This Game Changer
🤖 IQUSDT: Smart Plan
⚡️ PONDUSDT: A Trade Not Taken Is Better Than a Losing One
💼 STMXUSDT: 2 Buying Areas
🐢 TURBOUSDT: Buy Zones and Buyer Presence
🌍 ICPUSDT.P: Massive Upside Potential | Check the Trade Update For Seeing Results
🟠 IDEXUSDT: Spot Buy Area | %26 Profit if You Trade with MSB
📌 USUALUSDT: Buyers Are Active + %70 Profit in Total
🌟 FORTHUSDT: Sniper Entry +%26 Reaction
🐳 QKCUSDT: Sniper Entry +%57 Reaction
📊 BTC.D: Retest of Key Area Highly Likely
📊 XNOUSDT %80 Reaction with a Simple Blue Box!
📊 BELUSDT Amazing %120 Reaction!
📊 Simple Red Box, Extraordinary Results
📊 TIAUSDT | Still No Buyers—Maintaining a Bearish Outlook
📊 OGNUSDT | One of Today’s Highest Volume Gainers – +32.44%
📊 TRXUSDT - I Do My Thing Again
📊 FLOKIUSDT - +%100 From Blue Box!
📊 SFP/USDT - Perfect Entry %80 Profit!
📊 AAVEUSDT - WE DID IT AGAIN!
I stopped adding to the list because it's kinda tiring to add 5-10 charts in every move but you can check my profile and see that it goes on..

Bonk USDT Buy / Long SetupBonk performing well among all meme sectors, wait for the entry and take risk, if tp hits first then ignore. I already shared this setup on my group, we closed the trade at minor profit, but now this is showing strong momentum on 1hr tf also, that's why sharing.

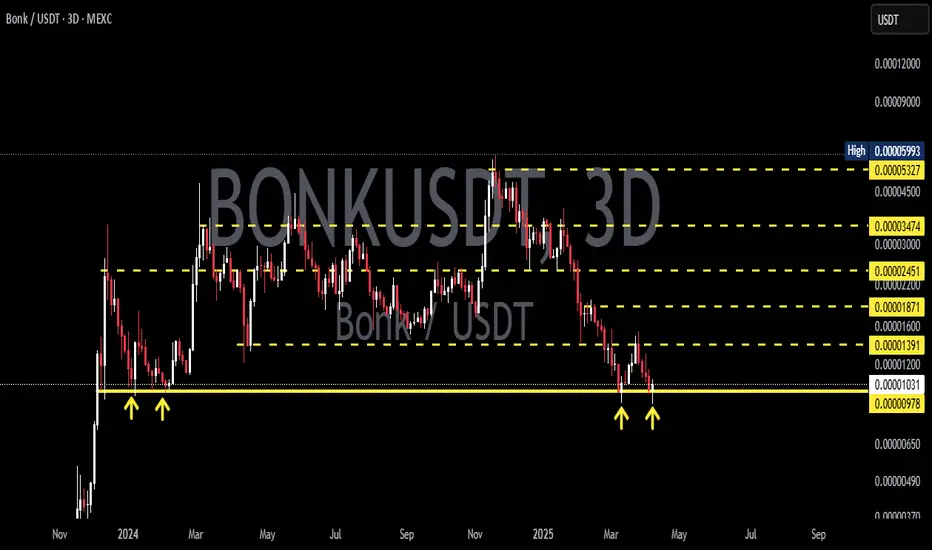
BONKUSDT 1D AnalysisBONK ~ 1D Analysis
#BONK Buy on retesting this support block or buy after successfully breaking this resistance line with a short term target of at least 15%+ and a long term target of $0.000065+

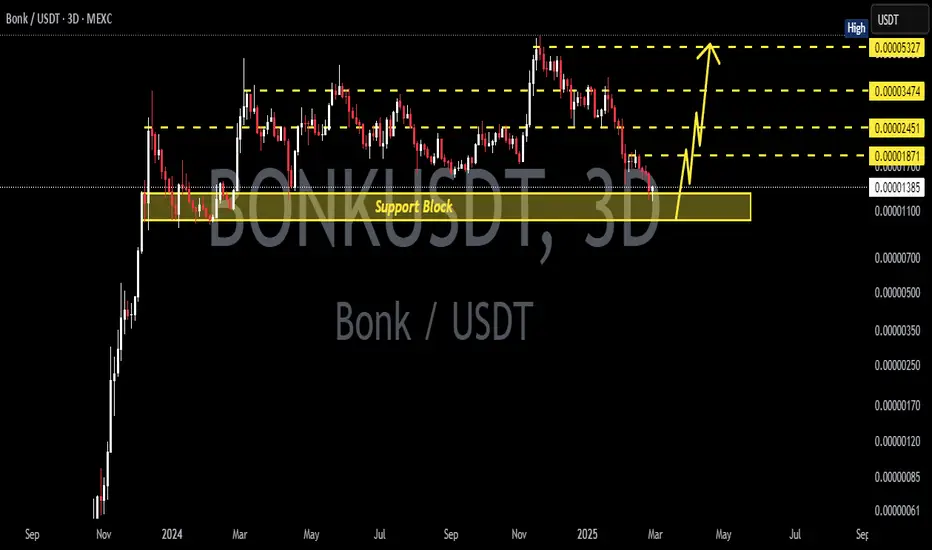
BONKUSDT 3DBONK ~ 3D Analysis
#BONK Important support that must be maintained for now. bouncing from here a short -term target of at least 15%+.
BONKUSDT 3DBONK ~ 3D Analysis
#BONK Buy gradually from here if you still have a Conviction on this coin.
Reason, This support block is still maintained.
BONKUSDT Triangle Pattern!BONKUSDT technical analysis update
CRYPTOCAP:BONK price is breaking out of a triangle pattern on the daily charts. The price has been trading within this triangle pattern for the past year. If the breakout is confirmed, we can expect a strong bullish move. Over the last few days, there has been an increase in volume, which is also considered a bullish sign for BINANCE:BONKUSDT

BONKUSDT Ready for Big PUMP!!!BINANCE:BONKUSDT has recently broken out and successfully retested a previous resistance level, showing signs of strength. Now, it’s attempting to break out of a triangle pattern, with the resistance line acting as a key barrier. If it manages to break through, a significant upward move could be on the horizon, fueled by the ongoing memecoin craze. However, caution is advised—consider using only a small portion of your capital to manage risk in this volatile environment.
BINANCE:1000BONKUSDT.P Currently trading at $0.000036
Buy level: Above $0.000033
Stop loss: Below $0.0000262
Max Leverage 3x
Always keep Stop loss
Follow Our Tradingview Account for More Technical Analysis Updates, | Like, Share and Comment Your thoughts

BONKUSDT 3DBONK ~ 3D
#BONK Buy gradually inside this pattern,. Minimum target 20%++.
it is only a matter of time until this pattern is broken and the Bulls dominate.

BONKUSDTBONK ~ 3D
#BONK Make purchases gradually in this pattern. It is only a matter of time until this pattern breaks out and the bulls return quickly

BONKUSDTBONK ~ 2D
#BONK need patience until this pattern is successfully penetrated. and the bulls will return soon.
The best way for now, wait until this pattern is successfully broken and our buy button will start to light up

BONKUSDT - UniverseMetta - Analysis#BONKUSDT - UniverseMetta - Analysis
On D1, the price may push off from the lower border of the channel and begin an upward trend. From the border you can see rebounds of 30% - 80%, which indicates the presence of buyers.
On H4, for confirmation, you can wait for the formation of a 3-wave structure along the trend and consider buying. You should be careful if an ABC or 3-wave structure in the opposite direction is formed (the presence of a 5th wave down), the price may make a false breakout and update the low again.
Target: 0.00002355 - 0.00003392

BONKUSDT 1DBONK ~ 2D
CRYPTOCAP:BONK We are still bullish on this $Meme.
We consider buying inside this pattern. target at least 15%+ from here.

BONKUSDT 2DBONK ~ 2D
SEED_DONKEYDAN_MARKET_CAP:BONK We are still bullish on this $Meme.
We consider buying inside this pattern. target at least 15%+ from here.

BONK surges 10%. Will the rally sustain?BONK’s price was bearish in the early hours of the day before support was established at the intra-day low of $0.00002. However, with the announcement of the treasury proposing an 84 billion token burn, the digital asset witnessed a 10% surge, reshaping investor sentiment and market trend.
This strategy is part of a broader effort to enhance token scarcity and increase its value over time. This can be considered as the turning point for BONK since decreasing the supply is usually positive for the investors. This burn according to the announcement represents the q2 amount of BONK sent to the DAO from BONKBot.
In April, the BONK Decentralized Autonomous Organization (DAO) had already set a precedent for such impactful decisions. The DAO passed a proposal to burn a staggering 278.39 trillion BONK, with the community vote showing overwhelming support: 418.63 trillion votes in favor, representing 99.9% approval.
The technical indicators on the BONKUSDT price chart point to continued bullish momentum. The Money Flow Index (MFI) rating of 68 suggests that money flows in the BONK market may sustain a bullish rally.
In addition, the Moving Average Convergence Divergence (MACD) has shifted into the positive region and above its signal line, reflecting a strengthening bullish trend. Moreover, the histogram developing higher bars suggests that buying pressure is increasing.
Concurrently, with a Relative Strength Index (RSI) rating of 67, this bullish momentum will likely trend upwards, with a potential target of $0.00003600 after hitting a double-bottom pattern on the 4-hour price chart.

BONKUSDT - UniverseMetta - Analysis#BONKUSDT - UniverseMetta - Analysis
On D1, the price may push off from the lower border of the channel and begin an upward trend. From the border you can see a rebound of 30%, which indicates the presence of buyers.
On H4, for confirmation, you can wait for the formation of a 3-wave structure along the trend and consider buying. You should be careful if an ABC or 3-wave structure is formed, the price may make a false breakout and update the low again.
Target: 0.00002525 - 0.00003378

BONKUSD 2DBONK ~ Updated
#BONK It seems BONK is ready to break through the resistance line of this pattern. Note, If this happens, the Bulls will start to dominate from here.

BONKUSD 2DBONK ~ 2D
#BONK It's interesting to pay attention to the AMEX:MEME season.
This is one of the interesting SPARKS:MEMES in 2D Chart.
if you are interested. make purchases after breaking through the resistance line of this pattern, or make purchases gradually within this pattern.

BONK/USDT Break Alert! Potential back to upward after retesting!💎 Paradisers, the recent market dynamics surrounding #BONK have indeed been noteworthy.
💎 After encountering resistance in the recent trading sessions, BONK is now poised for a potential retest of the support level. This retracement is a common occurrence following a breakout of a descending resistance area. The indicator tool MACD is the golden cross which means the price will switch to the bullish.
💎 During this retest phase, it's crucial for BONK to bounce from the support level around 0.00227. A successful bounce would signal strength and readiness to attempt another breakout of the resistance.
💎 If BONK manages to break above this resistance level, it would signify a return to bullish sentiment, with potential for further upward movement towards our target strong resistance area.
💎 However, if BONK fails to bounce from the support area and instead breaks below it, the next likely stop is the Bullish OB area. Historically, BONK has demonstrated the ability to bounce back from this zone and reclaim support.
💎 Nevertheless, if BONK fails to find support even at the Bullish OB area, it would raise concerns about the bullish trend. A candle closing below the Bullish OB area could invalidate the bullish scenario, signaling potential further downward movement.
MyCryptoParadise
iFeel the success🌴
