Bitcoin Imminent 2D Death Cross🔴The Bitcoin 2-day chart is approaching a death cross in the coming days.
While volatility has remained relatively stagnant since price retested the Weekly 100 EMA (around 85k🎯) in late November, it may spike as the death cross forms. The key support level to watch is a break below that W100 EMA, which would likely target the April lows of 77k-74k🎯.
🔵The next major resistance upon finding support is the Weekly 21 EMA, currently in the 100k-103k🎯 zone (In confluence with the 2D death cross zone)
🔵In summary, the overall structure remains bearish, though a corrective move upward is possible before any sustained downtrend resumes in the coming months.
Disclaimer: This is a hypothetical framework for educational purposes only and does not constitute financial advice. It is not a guaranteed predictor of future market performance. Always conduct your own research and understand the risks involved before making any investment decisions.
Bounce

Swiss Franc: Approaching Key ER SupportThe Swiss franc is now testing the lower boundary of the Expected Range (ER) — a zone for potential pause or bounce.
Also
this ER level aligns perfectly with a visible liquidity cluster (marked with arrow) .
📌 In other words:
It's not only a statistical support — it’s a confluence = higher probability reaction.

Bulls Will Take BTC to 100k Then Become Leftover Turkey Dinner!Trading Fam,
First things first, Happy Thanksgiving to my U.S. followers. I hope your holiday is blessed as you enjoy time with friends and family.
Let's get to the chart.
As noted numerous times in previous posts, BTC is now in a longer-term bearish trend. There are many indicators that have shown us this.
Our first signs came when my indicator flashed a rare sell signal
This coincided with the third touch of our Pi Cycle Top Trendline
It also formed what I thought at the time might be the "spring" of our Wyckoff Market Cycle pattern
After these first three important indicators flashed, I waited for a drop below the support (RED descending TL) of our bearish megaphone pattern. That happened.
Finally, we almost synchronized that drop with the drop below our 350 SMA
I have a target down of 72-76k. We almost reached that but we were stopped by 80k support. That RED ascending TL prints on the weekly starting with one of our tops in April of 2021!
We bounced off of this trendline, using it as strong support. It should be and I expected this bounce! Now, I am expecting we should go to at least 100-102k. Even that is a very underwhelming target. I will NOT be impressed at all if the bulls should succeed at hitting it. This, at least, should be expected!
If we don't hit that target, I will be wrong about how bearish I should have been. Even the "Buy the Dip" Viagra being sold by all these whales as exit liquidity will not have worked for these bulls. What a disappointment they will have become! And my target of 72-76k will still be in play.
But you can all see that I have a question mark there. See, the thing is, what happens when Michael Saylor's Microstrategy goes underwater? Microstrategy owns nearly 650k BTC at an avg cost of 74.5k. Current strategy is: issue shares → raise debt → buy BTC → repeat. If BTC falls below 74.5k it could become: buy back shares → lower debt → sell BTC → repeat. If this occurs, BTC could drop even further. My next serious support is not found until around 46k! Therefore, we have to keep a serious eye on this area of 72-76k if we do in fact visit it.
Now, if bulls do beat 102k and then 110k after that, I think I can admit I was wrong. I missed my downside target by a whopping 4k! I will admit defeat even though I was a small fraction of a coin off. Honestly, I hope I am wrong. I hope the market is revived and Santa gives you all the profit you ever wanted for the Christmas season. But the grinch in me thinks not.
So, play this rally as you like. Personally, I think it's an early gift to some of you who were not expecting this or just didn't believe it would occur. You now have your second chance to exit. This is a contrarian view. I know. But think about who might be propagating the "Buy the Dip" memes. I alluded to it above. If I were a whale and wanted to exit without crashing the market how would I best do this? Ding, ding, ding. That's right. I'd market the hell out of "Buy the Dip". It would become the meme of the hour. Retail would buy it up and hopefully provide the exit liquidity I need. This might be my only way out if I were looking for it.
Something to think about.
✌️Stew

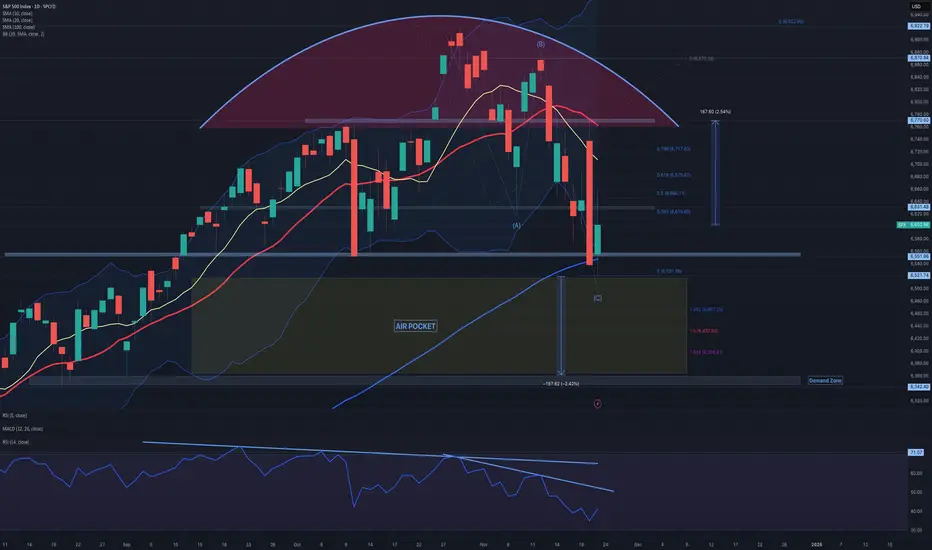
$SPX: dead cat bounce SP:SPX : Following the unexpected downturn on Thursday, SP:SPX stabilized last Friday after an intraday decline below the horizontal support at 6,550, which aligns with the 100-day simple moving average (SMA). The candlestick wicks on the daily chart suggest a potential short-term pause in the prevailing selling pressure. Monday will probably see a continuation of the rebound from Friday’s lows; however, it remains unclear whether Friday’s low marks the end of the current pullback. The RSI14 is approaching, but not yet within, oversold territory, and does not exhibit positive divergence. For the upside scenario, retracement levels from Friday’s high have been identified. Bulls must first reclaim the 6,530 resistance to maintain momentum; nevertheless, unless the key resistance at 6,770—168 points above Friday’s close—is breached, the probability of another downward move remains elevated, targeting the 6,360–6,340 region.
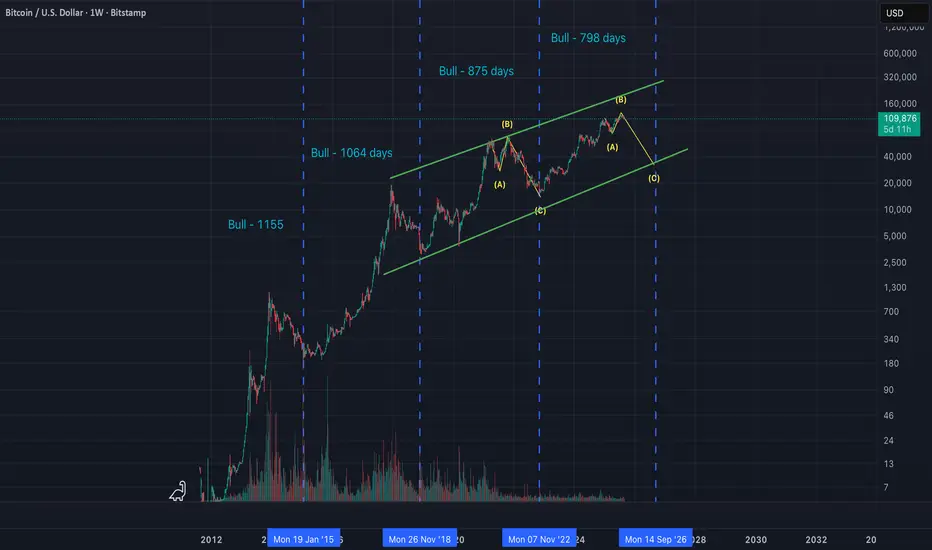
My Prediction for BTC 2025-2026 Bouncing between the Green lines !
I hope you understand my chart! What goes up must come down and vice versa! What goes down must go up! Also see the fair value gaps hitting 🫣🤩 I hope to validate! Let’s see if and when 🤓
Greetings and happy trading 🫡

BTC hitting the Monthly 20EMA supportBTC has touched the Monthly 20EMA (overlayed on this 4H chart) on a huge sell off, should make a strong bounce here or it's off to the pits of hell going into December.

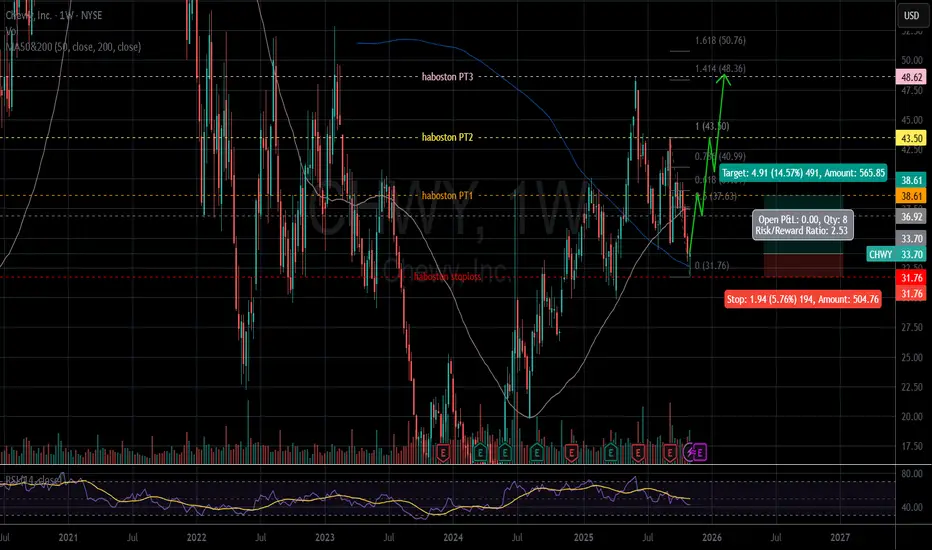
CHWY - Uptrend long term with Golden Cross in Weekly chartIn Daily chart: CHWY is recovering after oversold.
In Weekly chart: The chart has a Golden Cross in July 2025. Price has retested MA200 twice. It is expected that now is the time for CHWY to bounce strongly.
The price closed on 11.07.2025: $33.70 (Entry).
Price target: $38.61/ $43.50/ $48.62.
Stop loss: $31.76 (-5.76%).
IMO, amateur trader.
Good luck!
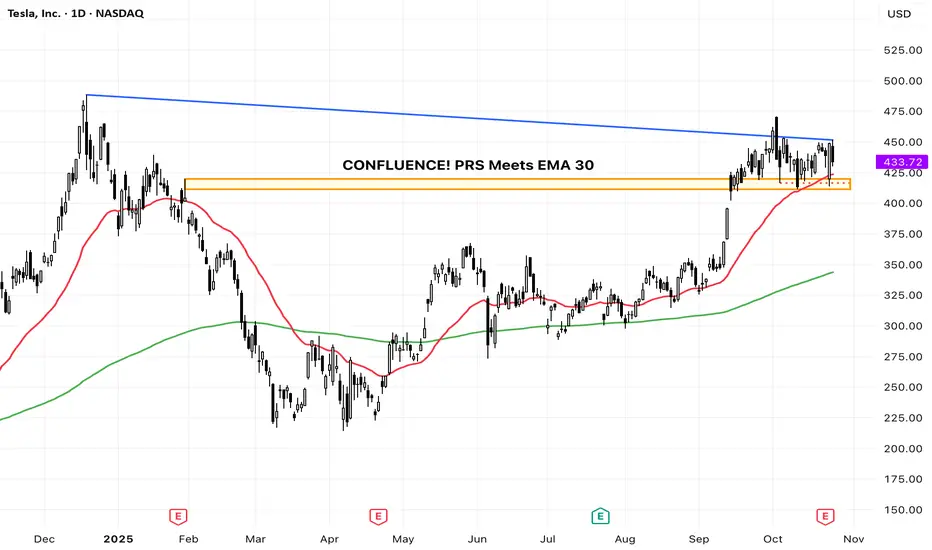
TSLA: Watching Prior Resistance Turn into Key SupportIntroduction & Thesis
Tesla ( NASDAQ:TSLA ) is currently presenting a textbook technical setup on the daily chart. After a strong uptrend from May to October, the price has pulled back to a critical zone that previously acted as heavy resistance in early 2025. This analysis explains why this level is a crucial 'make-or-break' point for the bulls.
The Breakout and The Retest
Observe the orange rectangle (approx. $410 - $425). This region was a significant ceiling for the price action earlier this year. According to technical theory, once a strong resistance level is decisively broken (which occurred in September), it is expected to flip its role and become a crucial support level. This is often referred to as a Prior Resistance Turned Support (PRS) area.
The price is currently pulling back right into this PRS zone, a common and healthy movement known as a retest.
Confluence of Support
Crucially, the 30-day Exponential Moving Average (EMA 30), which defines the short-term trend, is also converging with this key support zone. This creates a powerful confluence of support, significantly increasing the probability of a bounce. The long-term trend, indicated by the upward-sloping 200-day EMA (green line), remains firmly bullish, supporting the overall upward bias.
Scenarios
🎯 Bullish Scenario (The Bounce)
If the $410 - $425 zone holds and we see a strong bullish rejection candle (e.g., a hammer or engulfing pattern), it would confirm the support flip, suggesting the next leg of the rally towards the recent highs around $475.
🛑 Bearish Scenario / Invalidation (The Failure)
Conversely, a sustained daily close below $410 would be a crucial failure signal. This would invalidate the bullish retest thesis and suggest a deeper correction is underway, likely targeting the next major support zone around the 200-day EMA (currently near the $343 region).
📚 Educational Takeaway
This setup perfectly illustrates how traders look for confluence. The strongest support zones are those where multiple technical factors—like a former resistance level (PRS) and a strong moving average (EMA 30)—converge. A successful bounce here reinforces the power of market structure principles.
(Disclaimer: This is for educational purposes only and not financial advice.)
Why crypto bounced before SPY after Trump tanked the market!Bounce reasons:
- Falling wedge
- Double bottom
- Failed double top providing liquidity
- Very undersold
My chart might look a bit messy but this is my interpretation of what happened - Lmk what you think!

BTC – Bounce Off Daily Support, Eyes on Supply!Bitcoin has bounced from the daily support area (the broad green zone around $110K–$112K), reclaiming the intraday breakdown zone near $114K and turning it into support on lower timeframes.
As long as price holds above $112K–$113K, the short-term bias remains constructive and I am looking for continuation toward $118K, followed by the $121K–$122K supply zone highlighted on the chart.
The bulls will remain in control as long as the $107,500 mark holds as support.
⚠️ Disclaimer: This is not financial advice. Do your own research and manage risk.
All Strategies Are Good; If Managed Properly!
~Richard Nasr.

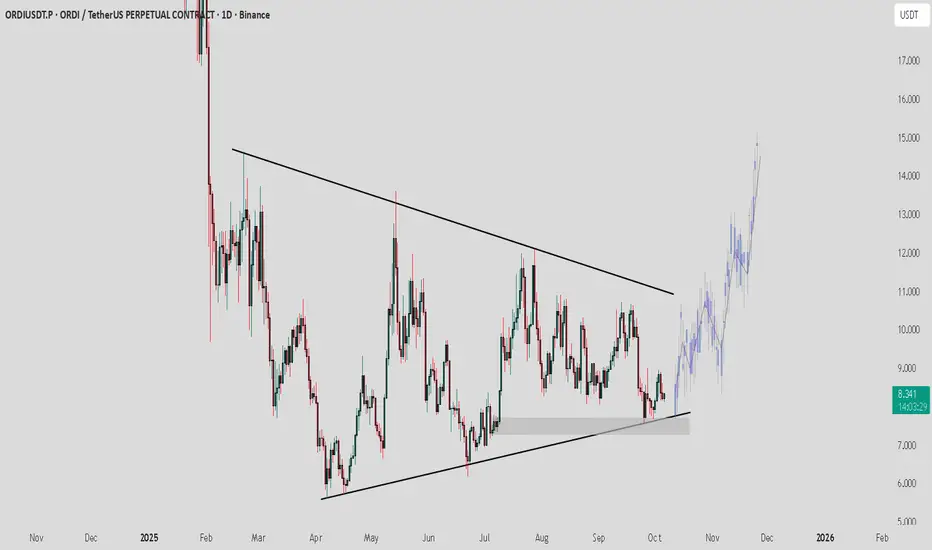
ORDI / USDT : Looking in a good momentum for a rallyORDI / USDT has bounced from strong support and is showing positive momentum. If this strength continues, we could see a bullish move towards $10 – $12 – $15 in the coming days.
Keep a close watch on momentum and manage risk wisely.
NOTE : Breakdown from support will invalidate this setup
Two-phase FOMC reaction on EURUSD explained: Where next?EURUSD experienced a classic "dovish-then-hawkish" whipsaw following the Fed's 25bp cut. The Initial dovish reaction saw the fibre surge above 1.19 to multi-year highs as the dot plot showed 50bp additional cuts vs expected 25bp in 2025. However, Powell's hawkish presser reversed gains within the hour, describing the cut as "risk management" rather than an aggressive easing cycle start.
EURSD is finding support at 1.1778 (previous high), with the price having taken out the 100% Fibonacci extension from August lows. Critical support sits at 1.1740, with a break below invalidating the bullish bias.
Bullish Scenario
Targets : 1.1830, 1.1866 (critical level), then 1.2000-1.2032
Triggers : Hold above 1.1778, break above 1.1866
Rationale : ECB-Fed divergence theme intact with ECB holding, while Fed cuts
Bearish Scenario (Potential Dead Cat Bounce)
Targets : 1.1750, 1.1730
Entry : Short at 61.8% Fibonacci retracement (~1.1832)
Stop : Above 1.1878
R:R Ratio : 3.38
Where next?
ECB pause vs Fed easing supports underlying bullish EUR/USD theme despite near-term volatility. But the next FOMC meetings are more critical as Powell emphasised a "meeting-by-meeting" approach. Current pullback is likely a retracement before a potential continuation higher, but watch for rejection at the weekly trendline resistance shy of 1.20.
This content is not directed to residents of the EU or UK. Any opinions, news, research, analyses, prices or other information contained on this website is provided as general market commentary and does not constitute investment advice. ThinkMarkets will not accept liability for any loss or damage including, without limitation, to any loss of profit which may arise directly or indirectly from use of or reliance on such information.

I hate to say it, but BTC is done - !Cycle ended!I've plotted the time in which each bull cycle takes to complete. Each run is getting shorter, not longer.. So looking at the previous run, we can see that we saw an expanded ABC to correct - one more little peak at at ATNH but then down into the inevitable correction. I think exactly the same thing is playing out here. We've seen so much brevado, but almost no new liquidity - there may well be a rate cut or two coming in September but I feel it's already priced in. When Powell inferred there would be cuts a few weeks ago, the market jumped but then dumped. Buy the rumour, sell the news. So - I'm out, cashed in my chips. Off to buy a new car.
MEGAPHONE ALERT! BTC 1H Outlook🧩 Megaphone Formation (Broadening Wedge)
Volatility expanding inside a widening range
Price now testing the Fib cluster (0.66–0.618) between 105,568–105,987
RSI at 66.3, nearing overbought — pressure is building
Volume surging above 20-period MA → breakout imminent
🎯 Key Confluences:
Upper Bollinger Band: 105,950
Mid BB (Basis): 105,110
Lower BB: 104,342
55 SMA: 104,500
SL Zone (Invalidation): Above 106,500 (upper wick resistance)
🔻 Bearish Breakdown Scenario:
Loss of 105,100 and breakdown from lower wedge line
RSI drops < 45 + volume spike → hedge confirmation
Targets: 104,000 → 102,500
🔺 Bullish Breakout Scenario:
Close above 106,000–106,500 with volume
Targets: 107,800 → 108,900
Manage with trailing stops — things will be quick!
⚠️ Summary:
Megaphone = Volatility Bomb
Stay nimble. If BTC fails at this Fib zone, the breakdown will be fast and decisive. If it breaks out, bulls might squeeze higher but need volume to sustain it.

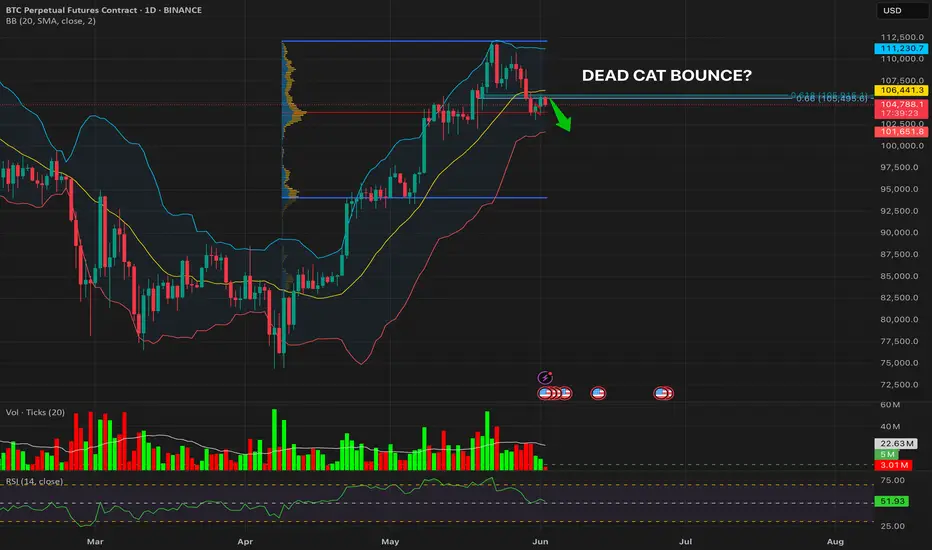
DEAD CAT BOUNCE? | BTC/USDT Daily + 4H Breakdown📉 Daily Chart – Rejection from Mid-BB & Fib Cluster
BTC bounced into the 0.618–0.66 retracement zone (105,495–106,443)
Price failed to close above the mid-Bollinger Band (106,443)
Volume declining on the bounce → lack of buying conviction
RSI barely holding above 50 (52.05) → weak momentum
Price is now rejecting from the underside of broken support → classic S/R flip
Possible Dead Cat Bounce forming below structure
🕵️♂️ 4H Chart – Short Hedge Retest Opportunity
Breakdown confirmed below 104,472 HL
RSI still below 45 on the 4H → bearish momentum intact
Retest of breakdown zone with weak volume
Price capped by mid-BB + 55 SMA (105,400–106,000 region)
Structure confirms a potential LPSY (Last Point of Supply) in Wyckoff markdown
🎯 Trade Plan (RTP-Compliant Short Hedge)
Entry: ~104,800 (confirmed breakdown zone)
SL: Just above 106,443 (Fib + BB basis + 55 SMA)
TP1: 103,300 (Lower BB)
TP2: 101,500 (Lower channel bound)
TP3: Trailing 1.0% below 101,400
⚠️ Summary
BTC's bounce lacks volume, RSI strength, and structural reclaim. Unless bulls close above 106,443 with force, this setup favors a continuation lower.
EURNZD Analysis: Bounce & BreakoutHello traders!
EURNZD is in a 1h range and is offering two trading scenarios.
The first scenario suggests the pair may react bearishly from the resistance zone, setting up a bounce opportunity that could drive price lower toward the 1.90000 area.
The second scenario anticipates a breakout above the resistance zone, followed by a retest, which could present a strong opportunity for continuation toward the 1.92000 area.
Discretionary Trading: Where Experience Becomes the Edge
Discretionary trading is all about making decisions based on what you see, what you feel, and what you've learned through experience. Unlike systematic strategies that rely on fixed rules or algorithms, discretionary traders use their judgment to read the market in real time. It's a skill that can't be rushed, because it's built on screen time, pattern recognition, and the ability to stay calm under pressure.
There's no shortcut here. You need to see enough market conditions, wins, and losses to build that intuition—the kind that tells you when to pull the trigger or sit on your hands. Charts might look the same, but context changes everything, and that's something only experience can teach you.
At the end of the day, discretionary trading is an art, refined over time, sharpened through mistakes, and driven by instinct. It's not for everyone, but for those who've put in the work, it can be a powerful way to trade.

Are you shorting the bounce or waiting for confirmation?Japan’s Q1 GDP came in worse than expected: -0.2% QoQ (-0.7% annualized). Weak consumption, soft exports, and a fading external boost despite a weak yen isn't a great combo for Asia’s largest export economy.
The Nikkei 225 reacted immediately, and the H4 chart is starting to reflect deeper structural pressure.
🔍 Technical Outlook:
- Price reversed from the high of 38,745.
- Price is testing the 50 SMA and could enter the Ichimoku cloud.
- The cloud is signalling a twist, which could be a sign of momentum fading and the trend weakening or reversing.
📊 Projection:
If the price closes below the 50 SMA and breaks through the cloud, further downside could be expected, with the target levels at
- 36,800 (last consolidation zone), and
- 35,570 (38.2% fibonacci retracement level and 200 SMA).
Alternatively, if the bulls defend the cloud, we could see the price climb to the resistance level of 40,500
This is a classic macro meets technicals moment. A weak data print is lining up against the possibility of a technical rollover.

EURGBP Analysis: Two Daily POIsHello traders!
EURGBP is offering two trading scenarios on the daily timeframe.
The first scenario suggests the pair may react bullishly from the next zone, setting up a bounce opportunity that could drive price higher toward the 0.84400 area.
The second scenario anticipates a bounce toward the 0.83800 area, where a mean reversion setup may come into play (if buyers step in and price action confirms bullish intent near that support).
Discretionary Trading: Where Experience Becomes the Edge
Discretionary trading is all about making decisions based on what you see, what you feel, and what you've learned through experience. Unlike systematic strategies that rely on fixed rules or algorithms, discretionary traders use their judgment to read the market in real time. It's a skill that can't be rushed, because it's built on screen time, pattern recognition, and the ability to stay calm under pressure.
There's no shortcut here. You need to see enough market conditions, wins, and losses to build that intuition—the kind that tells you when to pull the trigger or sit on your hands. Charts might look the same, but context changes everything, and that's something only experience can teach you.
At the end of the day, discretionary trading is an art, refined over time, sharpened through mistakes, and driven by instinct. It's not for everyone, but for those who've put in the work, it can be a powerful way to trade.

USDCAD Analysis: Three Bounce ScenariosHello traders!
USDCAD is offering three trading scenarios on the daily timeframe.
The first scenario suggests the pair may react bullishly from the currently approached zone, setting up a bounce opportunity that could drive price higher toward the 1.41600 area.
The second scenario anticipates a bounce toward the 1.37586 region, where a mean reversion setup may come into play (if buyers step in and price action confirms bullish intent near that support).
The third scenario anticipates a bounce toward the 1.34150 region, where a mean reversion setup may come into play (if buyers step in and price action confirms bullish intent near that support).
Discretionary Trading: Where Experience Becomes the Edge
Discretionary trading is all about making decisions based on what you see, what you feel, and what you've learned through experience. Unlike systematic strategies that rely on fixed rules or algorithms, discretionary traders use their judgment to read the market in real time. It's a skill that can't be rushed, because it's built on screen time, pattern recognition, and the ability to stay calm under pressure.
There's no shortcut here. You need to see enough market conditions, wins, and losses to build that intuition—the kind that tells you when to pull the trigger or sit on your hands. Charts might look the same, but context changes everything, and that's something only experience can teach you.
At the end of the day, discretionary trading is an art, refined over time, sharpened through mistakes, and driven by instinct. It's not for everyone, but for those who've put in the work, it can be a powerful way to trade.

I'm shorting thisTwo weekly timeframe for a better understanding. Looks like a large bearish flag forming. Price just bounce off the bottom of the flag. But I think is a dead cat bounce. Is hitting a resistance level 35-36. Doesn't look too sting to break it up. SL triggers if a weekly candle breaks up the resistance and closes above it.

NZDCAD Discretionary Analysis: Bounce at 0.83Hello traders and happy Easter Monday!
I'm expecting a bounce on NZDCAD. I'm interested in this 0.83 zone. It might turn into a strong bounce point. If the signs are there, I'm jumping in with a short.
Discretionary Trading: Where Experience Becomes the Edge
Discretionary trading is all about making decisions based on what you see, what you feel, and what you've learned through experience. Unlike systematic strategies that rely on fixed rules or algorithms, discretionary traders use their judgment to read the market in real time. It's a skill that can't be rushed, because it's built on screen time, pattern recognition, and the ability to stay calm under pressure.
There's no shortcut here. You need to see enough market conditions, wins, and losses to build that intuition—the kind that tells you when to pull the trigger or sit on your hands. Charts might look the same, but context changes everything, and that's something only experience can teach you.
At the end of the day, discretionary trading is an art, refined over time, sharpened through mistakes, and driven by instinct. It's not for everyone, but for those who've put in the work, it can be a powerful way to trade.

GBPNZD Discretionary Analysis: Bounce at 2.18Hello traders.
I'm like what I see on GBPNZD. I'm expecting the momentum to continue. I'm watching that 2.18 zone closely. It's where I'll be looking for a reaction. Could be a solid bounce spot, and if it shows signs, I'm stepping in.
Discretionary Trading: Where Experience Becomes the Edge
Discretionary trading is all about making decisions based on what you see, what you feel, and what you've learned through experience. Unlike systematic strategies that rely on fixed rules or algorithms, discretionary traders use their judgment to read the market in real time. It's a skill that can't be rushed, because it's built on screen time, pattern recognition, and the ability to stay calm under pressure.
There's no shortcut here. You need to see enough market conditions, wins, and losses to build that intuition—the kind that tells you when to pull the trigger or sit on your hands. Charts might look the same, but context changes everything, and that's something only experience can teach you.
At the end of the day, discretionary trading is an art, refined over time, sharpened through mistakes, and driven by instinct. It's not for everyone, but for those who've put in the work, it can be a powerful way to trade.

Cat's in the CradleHey Guys!! Here's one for you that you are going to Like
Let's Aim for a ~50% profit, on This one...
($22---->30 )
double-bottom,Trend Channel
Clearly defined Support-and-resistance Touch points.
Cheers!
And the cat's in the cradle and the silver spoon
Little boy blue and the man on the moon
"When you comin' home, Dad?"
"I don't know when, but we'll get together then
You know we'll have a good time then"
