Bharat Petroleum Corporation LTD Ltd for 3r Nov #BPCL Bharat Petroleum Corporation LTD Ltd for 3r Nov #BPCL
Resistance 360 Watching above 360 for upside momentum.
Support area 350 Below 345 gnoring upside momentum for intraday
Watching below 350 for downside movement...
Above 345 ignoring downside move for intraday
Charts for Educational purposes only.
Please follow strict stop loss and risk reward if you follow the level.
Thanks,
V Trade Point
BPCL

Strong multimonth breakout BPCLThe oil major company witnessed a consolidation breakout and closed at multimonth highs on weekly scale ..
volumes are healthy
rsi very strong
stock above key ema areas .

Review and plan for 12th June 2025Nifty future and banknifty future analysis and intraday plan.
Positional/short term stock ideas.
This video is for information/education purpose only. you are 100% responsible for any actions you take by reading/viewing this post.
please consult your financial advisor before taking any action.
----Vinaykumar hiremath, CMT

BPCL looking strong on Weekly Charts. Bharat Petroleum Corp. Ltd. is a holding company, which engages in the business of refining of crude oil and marketing of petroleum products. It operates through the Downstream Petroleum and Exploration & Production (E&P) segment. The Downstream Petroleum segment includes the refining and marketing of petroleum products. The E&P segment focuses on hydrocarbons.
Bharat Petroleum Corp. Ltd. Closing price is 293.20. The positive aspects of the company are Very Attractive Valuation (P.E. = 9.3), Companies with reducing Debt, Companies with Zero Promoter Pledge, Stocks Outperforming their Industry Price Change in the Quarter, Growth in Net Profit with increasing Profit Margin and MFs increased their shareholding last quarter. The Negative aspects of the company are Declining Net Cash Flow : Companies not able to generate net cash and Companies with growing costs YoY for long term projects.
Entry can be taken after closing above 296 Historical Resistance in the stock will be 306, 319 and 330. PEAK Historic Resistance in the stock will be 345, 355 and 366. Stop loss in the stock should be maintained at Closing below 261 or 234 depending upon your risk taking ability.
Disclaimer: The above information is provided for educational purpose, analysis and paper trading only. Please don't treat this as a buy or sell recommendation for the stock or index. The Techno-Funda analysis is based on data that is more than 3 months old. Supports and Resistances are determined by historic past peaks and Valley in the chart. Many other indicators and patterns like EMA, RSI, MACD, Volumes, Fibonacci, parallel channel etc. use historic data which is 3 months or older cyclical points. There is no guarantee they will work in future as markets are highly volatile and swings in prices are also due to macro and micro factors based on actions taken by the company as well as region and global events. Equity investment is subject to risks. I or my clients or family members might have positions in the stocks that we mention in our educational posts. We will not be responsible for any Profit or loss that may occur due to any financial decision taken based on any data provided in this message. Do consult your investment advisor before taking any financial decisions. Stop losses should be an important part of any investment in equity.

BPCL swing positionDouble bottom in BPCL and volume divergence plus money influx. Reasons to buy BPCL

BPCLNSE:BPCL
One Can Enter Now !
Or Wait for Retest of the Trendline (BO) !
Or wait For better R:R ratio !
Note :
1.One Can Go long with a Strict SL below the Trendline or Swing Low.
2. R:R ratio should be 1 :2 minimum
3. Plan as per your RISK appetite and Money Management.
Disclaimer : You are responsible for your Profits and loss, Shared for Educational purpose

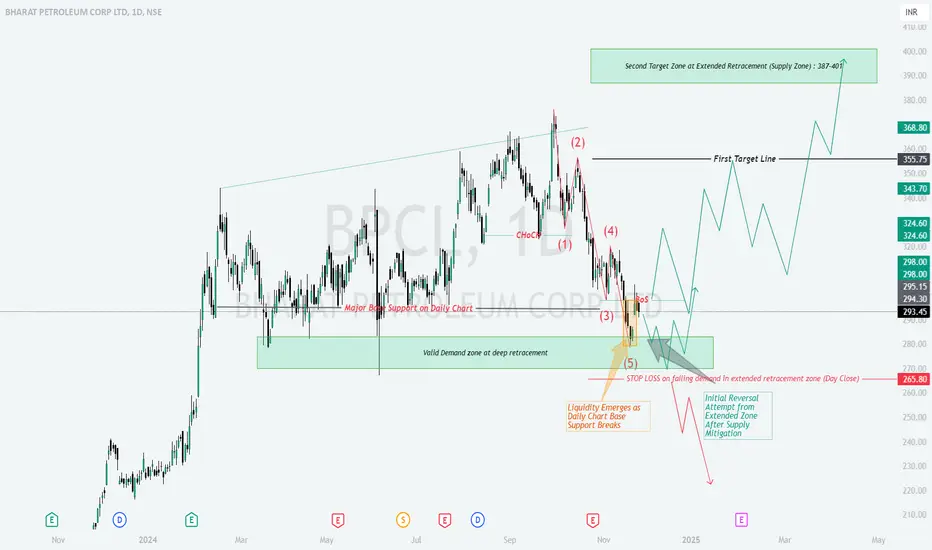
BPCL : Filling Fuel for recoveryBPCL | Based on Demand Zone and Elliott Wave Analysis
Chart Overview
The chart highlights a completed Elliott Wave 5-structure, with price entering a Valid Demand Zone between ₹270-280.
A potential reversal setup is visible, targeting higher levels if price action confirms buyer strength.
Analysis Breakdown
Key Zones to Watch:
Demand Zone (₹270-280):
A deep retracement zone with strong historical buying activity.
Liquidity likely emerges here after breaking the Major Base Support, trapping weak sellers.
First Target Zone (₹343-355):
Initial resistance where sellers may reappear after a reversal.
Second Target Zone (₹387-400):
Extended retracement supply zone where profit-taking is expected.
Elliott Wave Structure:
The current chart shows a 5-wave bearish structure:
Wave (1): Initial impulsive move down.
Wave (2): Weak corrective pullback upward.
Wave (3): Strongest wave breaking major supports.
Wave (4): Minor correction upward.
Wave (5): Final wave driving price into the demand zone.
Wave 5 completion often signals a potential trend reversal, aligning with this setup.
Confirmation Signals:
Price Action: Look for bullish reversal candlestick patterns (e.g., hammer, bullish engulfing) near ₹270-280.
Volume Spike: Increased buying volume in the demand zone indicates institutional interest.
Change of Character (ChoCH): Shift from lower lows/lower highs to higher highs/higher lows.
Trading Plan
Bullish Reversal Trade:
Entry: Near ₹270-280 upon confirmation of bullish price action or volume signals.
Targets:
Target 1: ₹343-355 (initial resistance).
Target 2: ₹387-400 (supply zone).
Stop Loss: Below ₹265 (invalidation of demand zone).
Bearish Breakdown Trade (If Setup Fails):
Logic: A daily close below ₹265 invalidates the demand zone.
Entry: Short position below ₹265 after a confirmed breakdown.
Target: ₹240-250 (next strong support zone).
Stop Loss: Above ₹270-275 (to avoid false breakdowns).
Risk Management
Position Sizing: Limit risk to 1-2% of total capital.
Stop Loss Discipline: Strictly follow stop-loss levels to prevent emotional trading.
Risk-to-Reward Ratio: Aim for at least 1:2 or higher R:R ratio (risk ₹10 to target ₹20+).
Educational Notes
Demand Zone Reversals: Demand zones often lead to significant reversals when combined with liquidity traps and bullish signals.
Wave 5 Completions: Wave 5 typically completes a trend, offering reversal opportunities.
Patience is Key: Wait for confirmation signals to improve trade probability.
Conclusion:
Bullish Plan: Watch for reversals in the ₹270-280 demand zone, targeting ₹343-355 and ₹387-400.
Bearish Plan: Short below ₹265 if the demand zone fails, targeting ₹240-250.
Stick to the plan, follow risk management rules, and allow the market to confirm your bias before executing trades.
Disclaimer:
I am not a SEBI-registered analyst. The above analysis is for educational purposes only. Please conduct your own research or consult with a financial advisor before making trading decisions.
BPCL 1D TFNSE:BPCL has been playing near a support zone and has broken it and is moving downward. But now if we see a little bit into the past we can see a long wick which represents the power of sellers at that point. So going into this trade is little bit risky. If you want to trade this setup kindly use multiple confluences. Do share the confirmations you are looking to trade this setup in the comment section
Disclaimer:- This analysis is only for educational purpose. Please always do your own analysis or consult with your financial advisor before taking any kind of trades

BPCL with high dividend yield wants to go higher. Bharat Petroleum Corp. Ltd. is a holding company, which engages in the business of refining of crude oil and marketing of petroleum products. It operates through the Downstream Petroleum and Exploration and Production (E&P) segment. The Downstream Petroleum segment includes the refining and marketing of petroleum products. The E&P segment focuses on hydrocarbons.
Bharat Petroleum Corp. CMP is 340.75. The positive aspects of the company are cheap Valuation (P.E. = 7.8), Company reducing Debt, Company with Zero Promoter Pledge, Dividend yield of the company at CMP is 6.2%. and Strong Annual EPS Growth. The Negative aspects of the company are Declining Net Cash Flow : Companies not able to generate net cash, Increasing Trend in Non-Core Income and Companies with growing costs YoY for long term projects.
Entry can be taken after closing above 347 Targets in the stock will be 355 and 363. The long-term target in the stock will be 375. Stop loss in the stock should be maintained at Closing below 320 or 293 depending on your risk taking ability.
Disclaimer: The above information is provided for educational purpose, analysis and paper trading only. Please don't treat this as a buy or sell recommendation for the stock. We do not guarantee any success in highly volatile market or otherwise. Stock market investment is subject to market risks which include global and regional risks. We will not be responsible for any Profit or loss that may occur due to any financial decision taken based on any data provided in this message.

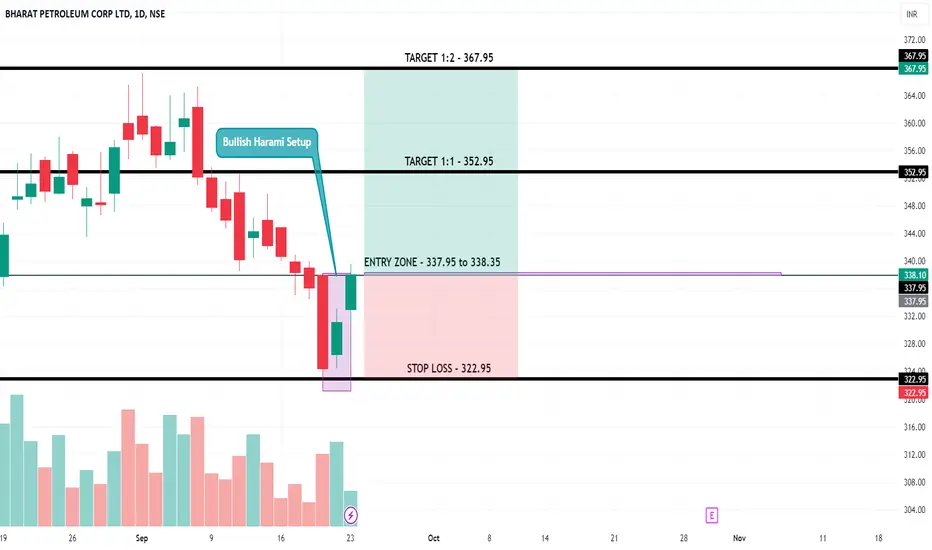
BPCL - Long SetupBPCL has bullish harami setup and already 15m candle has sustained above the price - 337.95 for more than 10 seconds.
Targets are: 352.95, 367.95
Stoploss only when 15min candle closes below the price: 322.95
Disclaimer: This is for educational purpose only and not any financial advice
BPCL Breakout Alert - Time to Ride the Bullish Momentum
Stock: Bharat Petroleum Corp Ltd. (BPCL) on Weekly Timeframe.
Current Price (CMP): ₹367.30
Breakout Zone: Clear breakout above the resistance level at ₹367.45.
Technical Pattern: Bullish ascending triangle indicating strength.
Action Point: Breakout confirmed, a potential buying opportunity.
Next Target: ₹380 and beyond, bullish continuation expected.
Support: Trendline support at around ₹330, offering a strong base.
Volume: Increasing volume confirming bullish breakout momentum.

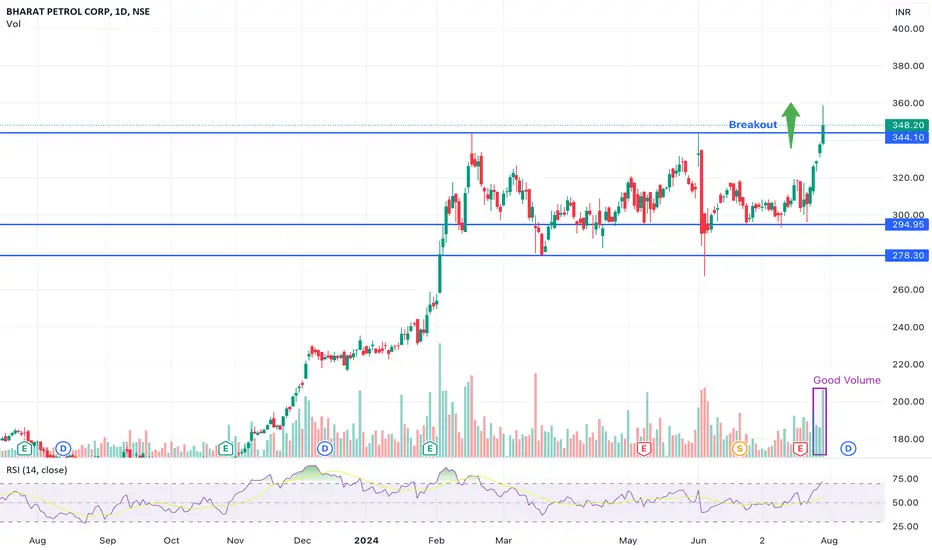
BPCL Breaks Out: Strong VolumeGood volume
Was in a range from February
Breakout resistance
Break resistance from February range
BPCL: Gearing up fly high - Know Why!Daily Time Frame:
Key Points:
Breakout Confirmation: The stock has decisively moved past its 4 years long resistance, confirming the breakout.
Volume Surge: Accompanied by high trading volume, indicating strong market interest.
Target Potential: Eyeing a 50% upward move based on technical analysis.
Why This Matters:
Momentum: Breakouts like this often lead to sustained trends.
Opportunity: Ideal for traders looking for growth stocks with strong technical setups.
- Above 620 it will start to shoot and also EMAs have confirmed the bullish trend continuation.
- If you have liked my chart reading and analysis, don't forget to leave a comment and boost the post.
- Wish you all a profitable trading journey. Cheers!
Disclaimer: This is NOT a buy/sell recomendation. This post is meant for learning purposes only. Please, do you due diligence before investing.
Thanks & Regards

BPCL is ready for a bullish break outBPCL has been trading with good volumes on the bourses in recent months.
The 52W H/L being INR 484.60 / 314.10
It is consistently trading above its long-term Moving Average for the past 3 months
There is a positive divergence on the oscillators
It is standing right at the resistance level on higher time frames
Resultantly, I believe that the target price should be INR 545-555
Stop Loss should be INR 457.00
Risk to Reward will be 1:3
The time horizon should be 9-12 months

39% Lying on the Table in BPCL chartsThe fundamental situation, BPCL is in, I can not see it not going ahead and achieving the 39% technical targets.
Disclaimer: I am holding since 355 and have targets of almost 100% from current levels, i.e. of around 1150.
Trade/ make financial commitments at your own risk. This is to spread awareness and not intended as a buy/sell call. Always, do your own research and/or seek expert financial help.

BPCL- Strong breakout!!-Intraday Analysis for 27th May 2024
Check out swing analysis for overall view pinned below.
Now price reacted at 0.5 Fibonacci level & strong keylevel in upward range trend. If buyers not allowed to create one more higher low then strong movement expected with big breakout.
Price is following the upward channel
Buy Above:657
T1:666
T2: 674
Swing traders can hold for more time
Direct Gapup entry should be avoided
Get confirmation from any of the leading indicators before entering trade
Kindy comment below in case of any clarification required on this particular idea.
Please follow for more ideas

BPCL-Time to shift the gears for bulls? Week & Daily AnalysisNSE:BPCL
Overview:
After the big up trend from November 2023, price has broke previous ATH. Due to strong movement price has reached 20% above previous ATH. But Healthy breakout needs proper consolidation & also due to profit bookings price was under small retracement.
Again the price has bounced from previous ATH but this time with W Chart pattern(Day TF) & more importantly Fibonacci at 0.382 Level. Inside candle price break in weekly time frame & also in Day TF indicates strong movement ahead
Buy: Above 654
1st Target(Swing traders): 688
2nd Target(Investment): 750
Get confirmation from any of the leading indicators before entering trade
Kindy comment below in case of any clarification required on this particular idea.
Please follow for more ideas
“The goal of a successful trader is to make the best trades. Money is secondary.” - Alexander Elder

BPCL- Intraday & Swing Analysis(Market at crucial level!! )
Day TF:
Overview: After the big up trend from November 2023, price has reached new all time high couple of times and under consolidation from two months. Again the price has bounced from support but this time with W Chart pattern & more importantly Fibonacci at 0.382 Level. Inside candle price break in weekly time frame
If stock found some consolidation during W Pattern. We can expect new all time high in couple of weeks.
15 Min TF:
• Over all, Stock us in upward range by creating Higher Highs and Higher lows
• After rejecting the price from 200 EMA, price has shifted gears and given a healthy breakout and reached new all time high.
• Later part, due to profit booking, it was under retracement. During observation, we can find the gradual decrease in volume indicating bullish hold.
• Further, price has rejected at previous resistance level by converting to support and also it was rejected by FVG & 50 EMA.
Entry:
Buy (Risk Entry): Above 632
Safe Entry: Above 636
Safe exit for intraday:639
Swing/positional traders can hold long for bigger profits ahead.
Get confirmation from any of the leading indicators before entering trade
Kindy comment below in case of any clarification required on this particular idea.
Please follow for more ideas
Quote of the Day: “The trend is your friend until the end when it bends.” - Ed Seykota
NSE:BPCL

Keep An Eye - At Support - BPCL📊 Script: BPCL
📊 Nifty50 Stock: YES
📊 Sector: Refineries
📊 Industry: Refineries
Key highlights: 💡⚡
📈 Script is trading at its support level on weekly chart, keep an eye on stock we may see some good really from here.
📈 One can go for Swing Trade.
⏱️ C.M.P 📑💰- 585
⚠️ Important: Always maintain your Risk & Reward Ratio.
✅Like and follow to never miss a new idea!✅
Disclaimer: I am not SEBI Registered Advisor. My posts are purely for training and educational purposes.
Eat🍜 Sleep😴 TradingView📈 Repeat 🔁
Happy learning with trading. Cheers!🥂

BPCL Symmetrical trial chart pattern is forming on one day chart of BPCL. After breakout, entry can be taken at 610. Target will be 645/685/725 and stop loss will be 590

BPCL Symmetrical trial chart pattern is forming on one day chart of BPCL. After breakout, entry can be taken at 610. Target will be 645/685/725 and stop loss will be 590

BPCL H&S Pattern Break DownBPCL 1Hr Chart - Completed 5 Impulse wave then entered in correction with H&S pattern

BPCL about to break down from H&S?NSE:BPCL hourly chart is showing a nice head and shoulder (H&S) pattern. If the neckline is drawn connecting the close values of "neck" then the pattern has already broken down.
If this materializes then the technical target of the breakdown would be around 530/535, but there is a good support zone around 585 which might hold.
The view invalidates on daily close above neckline.
