Gold setup: The retracement that could spark the next rallyOANDA:XAUUSD continues to trade confidently within a well-defined ascending channel, maintaining a clear and healthy bullish structure. After testing the upper boundary, the price pulled back to the mid-zone, where a strong rejection candle appeared, confirming that buyers are still defending key levels with conviction and keeping the upward momentum alive.
This kind of market behavior often signals renewed strength before the next move higher. If the bullish momentum holds, the price could break above the upper boundary of the channel and push toward new highs. Given the current technical setup and positive sentiment across the market, a move toward 4,500 seems both realistic and consistent with the ongoing trend.
Even so, caution remains important. A daily close below the lower boundary of the channel would weaken the bullish structure and could trigger a short-term correction before the trend resumes.
From a broader perspective, the bullish outlook for gold continues to be supported by geopolitical tensions, global uncertainty over interest rate policies, and the weakening US dollar. With central banks maintaining strong demand for gold as a hedge against economic instability, the precious metal remains one of the most attractive safe-haven assets in today’s volatile market.
Breakout!

AUDUSD Descending triangle breakout bullish move 📉 AUD/USD Technical Setup (1H Timeframe)
The pair has broken out of a descending triangle pattern 🔺 showing strong bullish momentum from the 0.6490 level 💪
🎯 Upside Targets:
1️⃣ 0.6520
2️⃣ 0.6570
3️⃣ 0.6600
Momentum remains bulls-in-control as long as price holds above 0.6490 support zone ⚡
💡 Watching for continuation moves toward upper resistance levels if buying pressure sustains.
#AUDUSD #Forex #PriceAction #TechnicalAnalysis #TradingSetup 💹

USDJPY: Holds Above HTLOn the daily timeframe, price broke through a previous HTL, which is now acting as support. There's also uptrend confluence signaled by price remaining above the EMAs and EMA20 being above EMA60.
Over on the H1 timeframe, price is also beginning to deviating away from the EMAs, which signals to me that there's momentum picking up.
In addition, price is also breaking above the DTL right now, which indicates that the counter-trend move is likely over.

Breakout or Fake-Out — Corn’s Price Action Under the Microscope1. When Breakouts Lie
Few things in trading are more exciting than a clean breakout. But for every breakout that soars, there’s another that fakes out and traps eager traders.
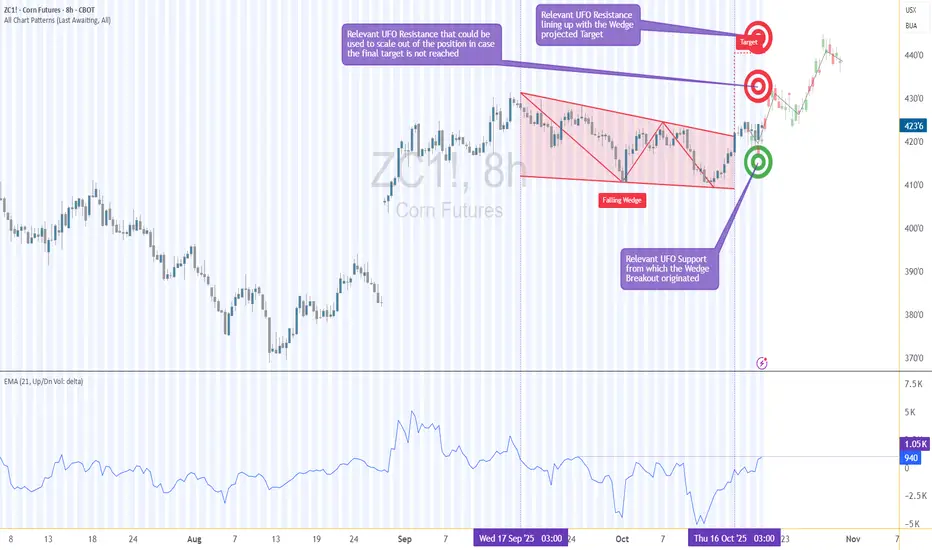
Corn Futures (ZC) on the 8-hour chart just gave us that classic test — a breakout from a falling wedge that has traders asking: Is this the real thing, or another false alarm?
The pattern looks textbook. Price compressed lower within a wedge and broke above its upper trendline. However, the true strength of any breakout lies not in the pattern itself, but in the story told by volume and order flow. That’s what we’ll unpack in this article — using ZC (Corn Futures) and MZC (Micro Corn Futures) as our guide.
2. The Falling Wedge in Focus
Falling wedges often represent market exhaustion, where selling pressure slows and buyers quietly begin to accumulate positions. On the Corn Futures 8-hour chart, price has indeed pushed beyond the wedge’s descending resistance line — the visual signal that usually excites breakout traders.
But structure alone doesn’t make a sustainable move. Beneath the surface, the UFO support and resistance levels — zones of UnFilled Orders — provide the invisible scaffolding that can support or reject price movement.
In this case:
Support Zone: 418–411
Resistance Levels: 430 and 442
These areas represent pending potential new support and resistance areas where buy and sell orders that can act as launchpads or barriers. The key is to see how the market interacts with them while volume builds or fades.
3. The Volume Delta Story
Here’s where things get interesting.
Volume Delta — the difference between buy and sell volume — shows us who’s winning the tug-of-war between buyers and sellers.
During the wedge formation, the maximum delta reached +1.05K, indicating meaningful buying activity despite the downtrend. But as the breakout unfolded, delta turned slightly negative. In plain terms, fewer new buyers are stepping in — and without new buying energy, breakouts often lose traction.
That’s a classic setup for a potential fake-out: price pokes above the wedge, but order flow doesn’t confirm. This mismatch between technical breakout and volume delta is often the canary in the coal mine for fading momentum.
4. The Trade Logic — Let the Market Come to You
Instead of chasing the breakout, the smarter play here could be to wait for the market to revisit demand/support.
Why? Because that’s where new volume tends to enter — where pending buy orders (the UFOs) become filled, strengthening the delta and giving the move fresh fuel.
A potential plan might look like this:
Entry: 418 (within support)
Stop-Loss: 411 (below the zone)
Target 1: 430 (first resistance, partial exit)
Target 2: 442 (final resistance, full exit)
This setup maintains a clear reward-to-risk ratio above 3:1, assuming disciplined execution and volatility-adjusted sizing. It’s not about prediction — it’s about preparation. Waiting for retracement allows participation in a confirmed move, rather than reacting to emotional excitement at the breakout.
5. Contract Specifications & Margin Requirements
Understanding your instrument is as important as reading your chart.
Here’s what traders should know about these CME-listed Corn contracts:
ZC – Corn Futures (Standard Contract)
Contract Size: 5,000 bushels
Tick Size: ¼ cent per bushel (0.0025) → Tick Value = $12.50
Approx. Margin: Around $1,000 USD, varying by broker and volatility
MZC – Micro Corn Futures
Contract Size: 500 bushels (1/10th of ZC)
Tick Size: ½ cent per bushel (0.0050) → Tick Value = $2.50
Approx. Margin: Around $100 USD, varying by broker and subject to market conditions
Micro contracts allow smaller-scale traders to apply the same analysis and structure as the full-size contract, but with controlled risk exposure — a major advantage for capital management.
6. When New Volume is Injected in the Market
Think of Volume Delta as a glance in the rear-view mirror — it tells us what’s already been filled. On the other hand, analyzing support and resistance levels with the idea of where new unfilled orders might come in helps us prepare to enter trades just before momentum potentially reactivates.
When both are combined:
Rising delta confirms a healthier follow-through on breakouts.
Negative delta near resistance warns of a likely fading move.
Key support and resistance zones show where resting orders could inject new volume.
7. Risk Management — Protect Before You Project
Every solid trade plan starts with a stop.
For this setup, a logical stop below 411 ensures protection if the wedge breakout fails completely.
Scaling out at 430 reduces exposure early, locking gains in case the move stalls.
Always size positions relative to account equity and volatility — the most underrated edge in trading is survival.
The best traders don’t just hunt profits — they hunt consistency. Managing risk transforms a potentially stressful market environment into a structured decision process.
8. CME Context & Final Thoughts
Both ZC and MZC are cornerstone agricultural contracts traded on the CME Group’s CBOT exchange, giving traders exposure to one of the world’s most economically significant commodities.
While the setup we’ve explored is a case study, the takeaway extends beyond Corn:
Breakouts need participation. Volume confirms conviction. Key support and resistance levels reveal intention.
In markets where fake-outs are common, aligning technical structure, order flow, and patient trade planning gives traders the clearest edge of all — confidence grounded in data, not emotion.
When charting futures, the data provided could be delayed. Traders working with the ticker symbols discussed in this idea may prefer to use CME Group real-time data plan on TradingView: www.tradingview.com - This consideration is particularly important for shorter-term traders, whereas it may be less critical for those focused on longer-term trading strategies.
General Disclaimer:
The trade ideas presented herein are solely for illustrative purposes forming a part of a case study intended to demonstrate key principles in risk management within the context of the specific market scenarios discussed. These ideas are not to be interpreted as investment recommendations or financial advice. They do not endorse or promote any specific trading strategies, financial products, or services. The information provided is based on data believed to be reliable; however, its accuracy or completeness cannot be guaranteed. Trading in financial markets involves risks, including the potential loss of principal. Each individual should conduct their own research and consult with professional financial advisors before making any investment decisions. The author or publisher of this content bears no responsibility for any actions taken based on the information provided or for any resultant financial or other losses.
GOLD Will Break ATH Again? Buy!
Hello,Traders!
GOLD Price is maintaining a strong bullish structure, consolidating just beneath its all-time high. Liquidity build-up above the highs suggests potential for an impulsive breakout, extending toward new record levels as buyers remain in full control. Time Frame 5H.
Buy!
Comment and subscribe to help us grow!
Check out other forecasts below too!
Disclosure: I am part of Trade Nation's Influencer program and receive a monthly fee for using their TradingView charts in my analysis.

EURNZD BEARISH BREAKOUT|SHORT|
✅EURNZD pair has confirmed a clean breakout below the key level, signaling potential continuation toward the 2.0240 target area. Price has already taken out internal liquidity and is now likely to expand further as sellers remain in control. Time Frame 2H.
SHORT🔥
✅Like and subscribe to never miss a new idea!✅

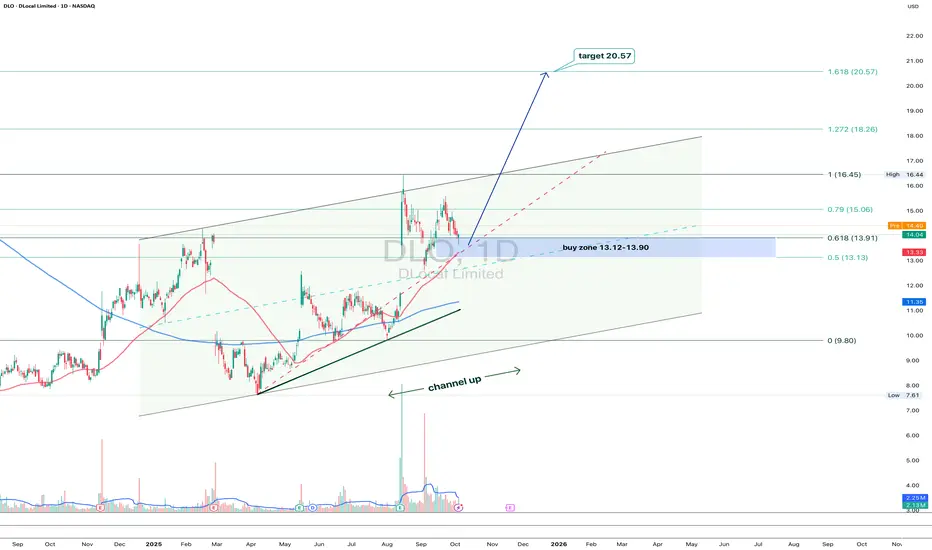
DLO 1D: steady within the channel, eyes on $20+On the daily chart, DLocal keeps trading inside a clean upward channel. After a strong leg up, price is pulling back toward the 13.12–13.90 buy zone - a confluence of the 0.5–0.618 Fibonacci retracement and the channel’s lower boundary.
As long as both MA50 and MA200 stay below price, buyers remain in control. Volume expansion supports the idea of another bullish swing ahead.
First resistance is near $16.45, with the broader target sitting at $20.57 - the 1.618 Fibonacci extension.
From a fundamental standpoint, DLocal keeps strengthening its presence in emerging markets. The fintech theme is still alive, and this setup looks like a calm pullback before another push higher.
In short - wait for confirmation around support, then let the trend do the heavy lifting. Just remember: even the cleanest channels have bumps along the road
USDCHF: Momentum into NY SessionKey Observations
This pair is starting off slow, but I'm expecting momentum to pick up during the New York session.
The daily chart is indicating an overall downtrend. Price is holding below both EMAs. However, the price action is a little bit weaker and the daily HTL isn't a significant level.
On the H1 timeframe, price is showing overlapping bars. I am hoping to see a stronger break to the downside as price crosses out of the EMA brand and accelerates.

GBPCAD: Price Supported Above Daily HTLKey Observations
Price is holding above the daily HTL, which is a good sign that this breakout is likely structural and there isn't much selling pressure (resistance)
On the H1 timeframe, price is also showing a similar characteristic. Price tried to trade below the EMA but could not.
Since price is accelerating to the upside once again, it's likely we'll be seeing trend continuation throughout the rest of the week.

Global Uncertainty, Fed Moves, and the Golden Opportunity AheadHey everyone, good to see you here. Let’s unpack what’s been happening with gold after another explosive week in the markets.
Last Friday, gold pushed to new record highs, touching close to 4,400 before heavy profit-taking kicked in during the US session. The pullback shaved roughly 165 off the top, but even with that drop, gold still managed to close the week nearly 6% higher. That makes it nine straight weeks of gains — an incredible run we haven’t seen in years. Since this short-term rally began, gold’s climbed more than 25%, outperforming the 2020 surge that once shook the market.
So what’s driving this strength? It’s a mix of global uncertainty, geopolitical tensions, and traders positioning around the Fed’s policy shift. Rate cuts and the looming risk of a US government shutdown have added volatility, but also reinforced gold’s status as a safe-haven play. Every dip so far has been met with buyers stepping in confidently — a clear sign that sentiment remains firmly bullish.
Technically, the 4,200 zone stands out as key support. As long as price holds above it, the “buy-the-dip” strategy stays valid. The Fibonacci retracements around 0.5 and 0.618 align perfectly with this level, highlighting an area where buyers could reload before the next leg up.
If momentum keeps building, the path toward 4,500 looks open and realistic. The trend is strong, the fundamentals are supportive, and gold continues to attract both institutional flows and retail interest.
Right now, gold isn’t just shining — it’s commanding attention. The question is, are you watching closely enough to catch the next move?

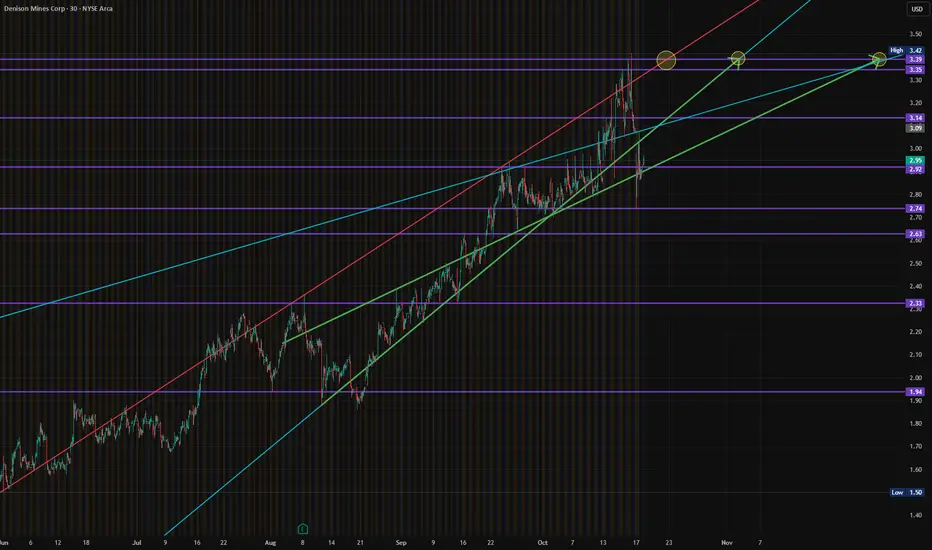
$DNN - Denison Mines - $3.39 RetestAMEX:DNN has completed consolidation, showing support and momentum shifting to push through the $3.14s and retest the $3.39 Levels of Reistance once again. It needs to hold support above the $2.92's.
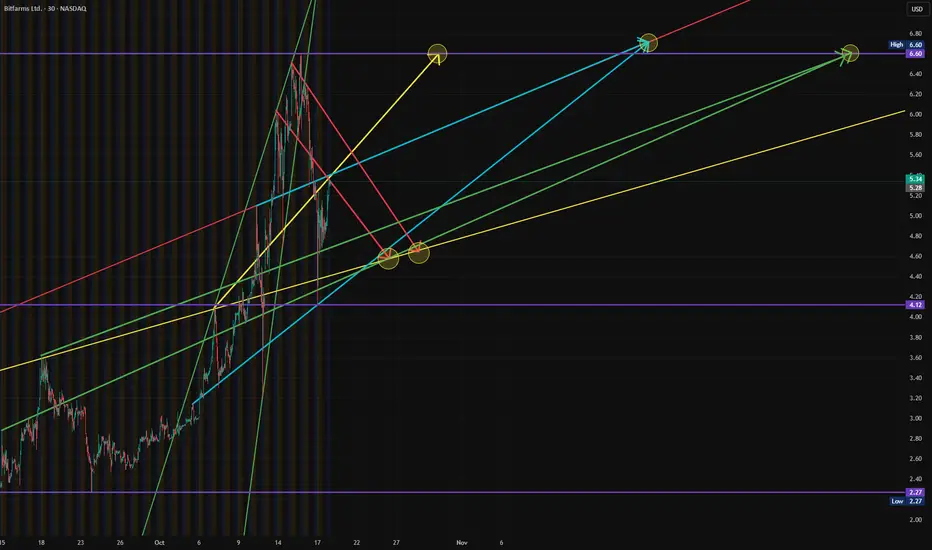
$BITF - Bitfarms LTD - $6.60 RetestNASDAQ:BITF as since consolidated after tapping $6.60, finding support on the $4.12. We're looking for a re-entry around the $4.40's to hold #Long to $6.60 for a 50% Swing Trade
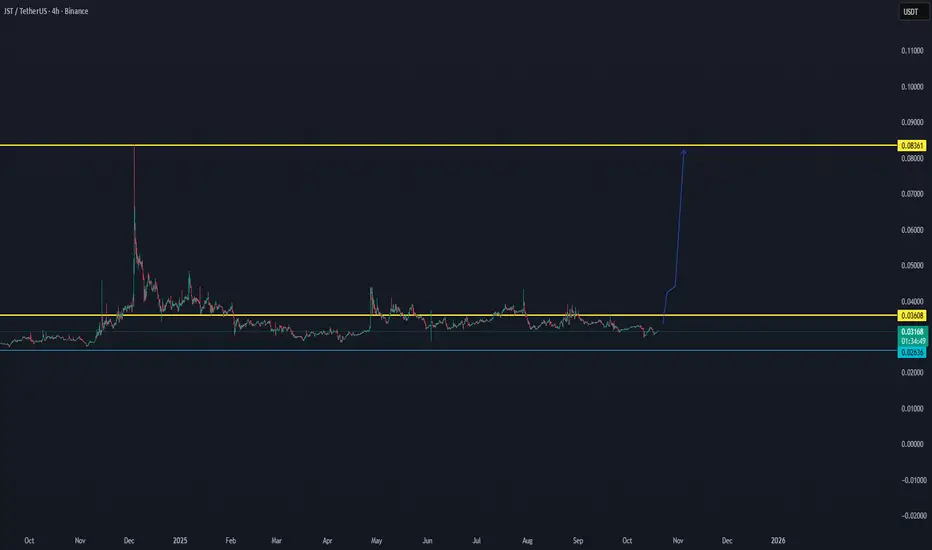
JST/USDT Second BREAKOUT ON WAY..Data view shows that there is a high chance JST can break out for the second time since the last volume data. We will follow these coming time frames to see what is able to do.
Asahi India Glass Limited chart analysisEntry: ₹941-945 (Current Level)
Target 1: ₹971-975
Target 2: ₹988-995
Target 3: ₹1,020+ (Extended)
Stop Loss: ₹925
Technical Rationale:
Powerful breakout from prolonged consolidation (870-940)
Strong bullish momentum with +3.02% gain today
Massive volume spike (441.46K) - significantly above average
RSI trending upward near 60, showing strong momentum
Price breaking above key resistance at 931-940 zone
Fresh 52-week high territory - no overhead resistance
Auto sector tailwinds supporting glass demand
Clear support established at breakout level (931)
Risk-Reward: Excellent 1:3+ ratio
Strategy: Momentum breakout play - Book 30% at Target 1, 30% at Target 2, trail remaining with SL at 960 after T1
Key Levels to Watch:
Support: 931, 920
Resistance: 971, 988, 1,000 (psychological)

SHELL/USDT — Reclaiming Key Zone, Potential BreakoutThe best DCA coin of the moment for the low cap
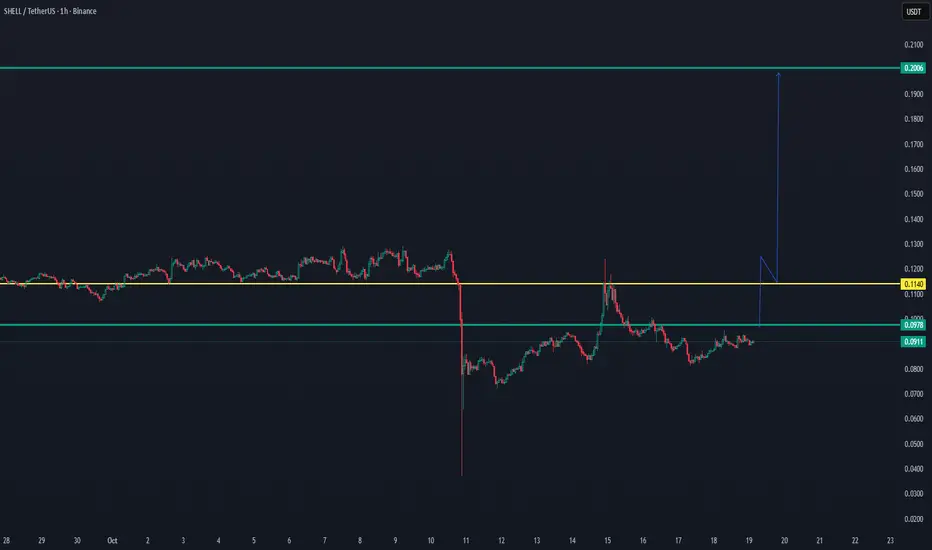
SHELL/USDT — Reclaiming Key Zone, Potential Breakout Toward $0.20 🚀
SHELL is currently building momentum near the $0.097–$0.100 zone, after reclaiming short-term structure from its recent drop. This consolidation indicates accumulation, setting the stage for a potential breakout move.
The $0.114 zone remains the key breakout level — a 1H close above it could confirm continuation toward the $0.20 target, aligning with the next major resistance area.
📊 Technical Overview:
Support: $0.090
Breakout Level: $0.114
Main Target: $0.200
Momentum: Recovering with early bullish signals
Once the price confirms above $0.114 with strength, the chart opens a wide “open space” toward the next resistance at $0.20, creating strong potential for a trend expansion.
📈 Bias: Bullish setup forming
🎯 Targets: $0.114 → $0.200
BTCUSD: Pivot from Support level and Rally to $116KHello everyone, here is my breakdown of the current Bitcoin setup.
Market Analysis
From a broader perspective, after a powerful rally to a new All-Time High around 126000, the market for Bitcoin has entered a significant and complex corrective phase. This entire correction has been developing within the confines of a large triangle pattern, with price coiling between major support and resistance.
Currently, the price has rotated down and is now at a critical inflection point, testing the ascending support line of this multi-week triangle. This area also aligns with the major horizontal Support around the 110500 level, creating a strong confluence of support.
My Scenario & Strategy
I see this test of the Triangle Support Line as a logical point for buyers to step in and defend the structure, just as they have done at previous lows within this pattern.
I'm looking for the price to make one final small corrective dip into this support area. The key signal for me would be a confirmed and strong bounce from this level, which would indicate that the selling pressure is exhausted and a new rotation to the upside is beginning.
The primary target for this rotational move is 116000, a key level of prior price action inside the triangle.
That's the setup I'm tracking. Thank you for your attention, and always manage your risk.


XAUUSD: Detecting the Rising Wedge PatternOANDA:XAUUSD has experienced a significant rise recently, but we are currently seeing the formation of a Rising Wedge pattern, which often signals buyer exhaustion and a potential reversal toward a bearish trend. As the structure tightens near the top, the upward momentum starts to weaken, indicating that the buying pressure is fading.
A strong breakout below the trendline would confirm selling pressure and could signal a move toward the 4,130 level. However, until that happens, patience is key. It’s important to wait for a clear breakout with high volume to avoid false signals.
In summary, don’t rush into the market too early. Caution and waiting for a clear signal are essential to maximize your chances of success. Best of luck and happy trading!

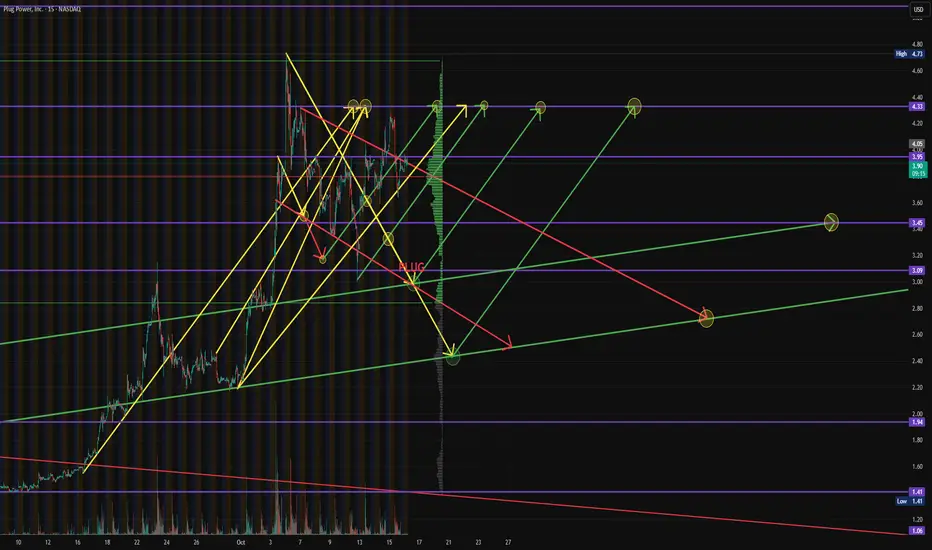
$PLUG - Plug Power - $4.33 RetestNASDAQ:PLUG is currently tracking along one of our potential breakouts to recheck the $4.33 Level of Resistance, but we need to break and hold above that $3.95 Level first. If not, consolidation.
GBPCAD STRONG BREAKOUT|LONG|
✅GBPCAD has confirmed an ICT-style bullish breakout above the key level, showing strong displacement and market structure shift. A possible retest of the breaker block could offer continuation toward the 1.8920$ target. Time Frame 5H.
LONG🚀
✅Like and subscribe to never miss a new idea!✅

AUDUSD: Weak DowntrendKey Observations:
Price is holding below the daily HTL, which gives me a bearish sentiment
The latest reaction from the daily HTL is a bit weaker, which gives me a small point of concern
This is going to be another attempt to trade the price acceleration from the EMA band to the downside
If price fails to make a significant low, I think it's safe to say that we'll see a reversal and stronger likelihood to the upside

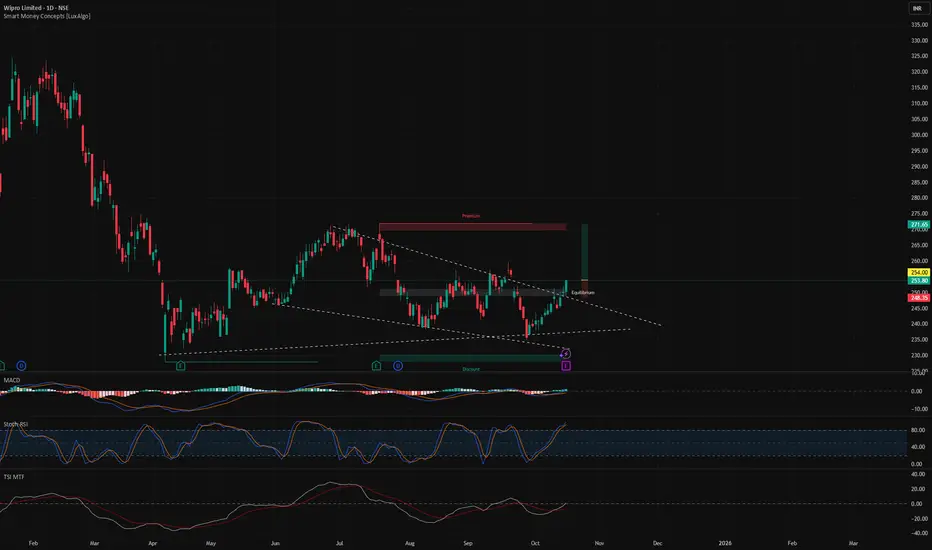
Breakout in WIPROBreakout in WIPRO.
Entry - 254
Targets - 270, 285 & 310
SL - 248
DISCLAIMER: I am not SEBI registered and the ideas posted are only for educational purpose. Do a proper analysis and always trade with STOP LOSS.
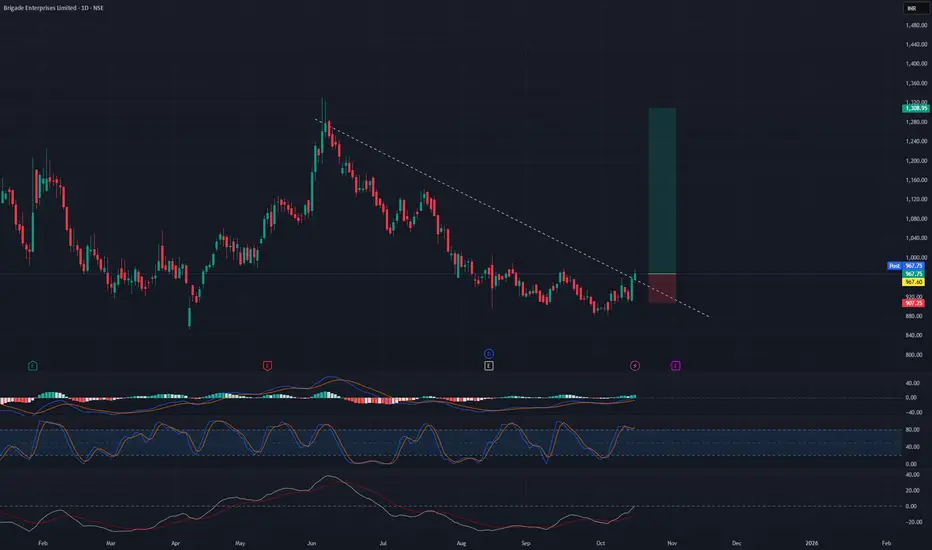
Breakout trading in BRIGADESwing trading opportunity in BRIGADE.
Entry - 970
Targets - 1130 & 1300
SL - 904
DISCLAIMER: I am not SEBI registered and the ideas posted are only for educational purpose. Do a proper analysis and always trade with STOP LOSS.