EUR-CAD Bullish Wedge! Buy!
Hello,Traders!
EUR-CAD is trading in an
Uptrend and the pair formed
A bullish wedge pattern and
Now we are seeing a bullish
Breakout from the wedge so
We are bullish biased and we
Will be expecting a further
Bullish move up
Buy!
Comment and subscribe to help us grow!
Check out other forecasts below too!
Disclosure: I am part of Trade Nation's Influencer program and receive a monthly fee for using their TradingView charts in my analysis.
Breakout!

Breakout on Vodafone?Looks like a Head and shoulders reversal, plus breakout this week. Too early to say though as it still needs confirmation. Could still be a fake-out?
This is not a solicitation to trade in Vodafone shares.

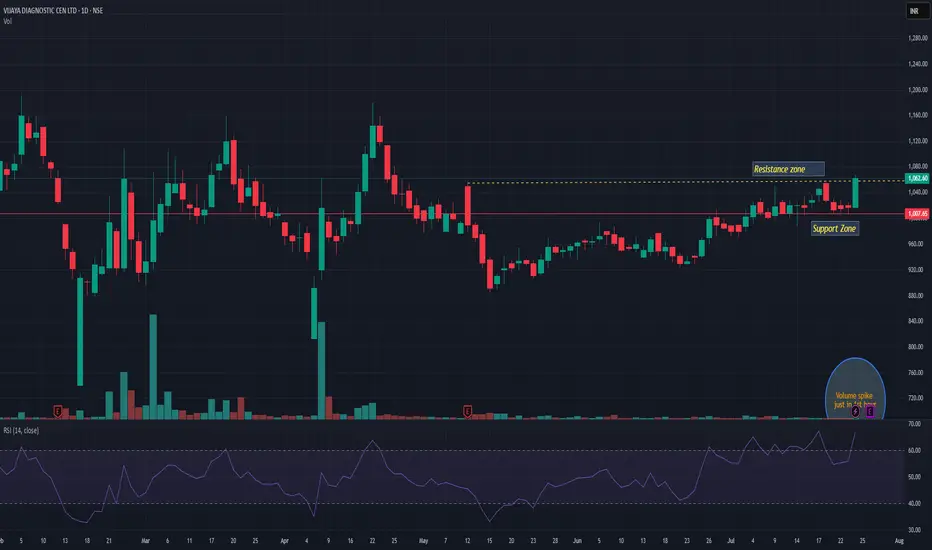
VIJAYAVIJAYA giving trendline breakout with decent volume. Q1 result is on 28th July may push momentum rally. Support seems near 1005 level. We may see momentum up to 1170 in coming days. Keep it on radar.
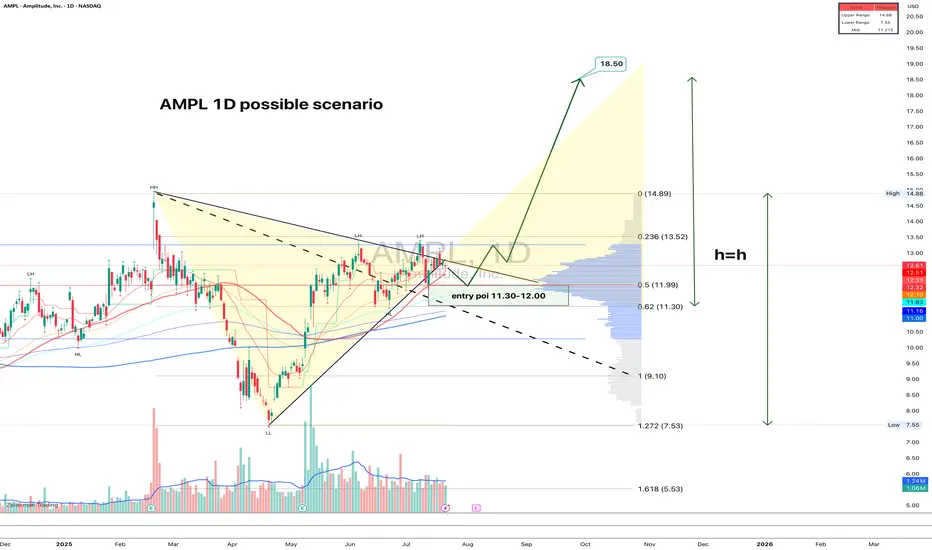
AMPL: structure clean, volume right, fundamentals warming upAMPL just broke out of a symmetrical triangle on the daily chart. The breakout was confirmed with decent volume, and now price is calmly pulling back into the 11.30–12.00 zone — exactly the kind of textbook retest that gets serious traders interested. The 0.618 Fib level sits at 11.30, and 0.5 at 11.99, strengthening this entry area. Volume has tapered off post-breakout, which is typical before a continuation. Moving averages are stacked bullish, confirming the trend shift. First upside target is 13.52, followed by 14.89, and if the full h = h move plays out, price could reach 18.50. A natural stop sits just below 11.00. Clear structure, solid risk control — this is one of those setups that checks all the boxes.
On the fundamental side, Amplitude remains a key player in product analytics and digital optimization. After a slow 2024 marked by cost-cutting and stagnating revenue, the company is showing early signs of recovery this year. The broader SaaS market has stabilized, and AMPL is benefiting from renewed enterprise demand, especially for AI-driven user behavior analytics. Recent earnings came in better than expected, and institutional interest has quietly returned. Valuation is still moderate at these levels, giving it room to re-rate if momentum builds.
A clean breakout with technical alignment and an improving macro picture - when both sides of the story match, it's worth paying attention.
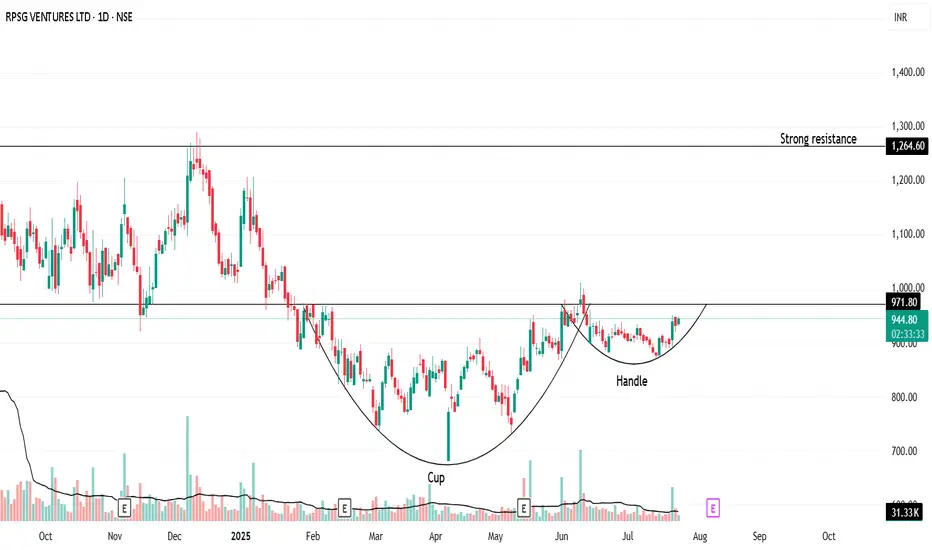
"Handle Tightening… Is RPSG Ready to Explode?"Once upon a trend, RPSG Ventures brewed a picture-perfect Cup & Handle—a structure born not out of coincidence, but crowd psychology and silent accumulation.
After nearly 9 months of consolidation, the stock crafted a deep, symmetrical cup (between November 2024 and May 2025). Traders forgot about it. Volumes dried. Hope faded.
But quietly, the handle formed—short, shallow, and tight. It’s not just a chart pattern—it’s a test of patience. And now, the breakout zone at ₹971.80 is like the rim of a boiling kettle: silent… until the whistle.
🧭 Possible Future?
If it breaks out: A rally toward ₹1,264 isn't just possible—it’s logical.
If it fakes out: Back to base, retest near ₹890.
💬 What makes this unique?
This isn’t just technical analysis. It’s a behavioral pattern. Fear, exhaustion, optimism—they're all baked into this structure. Cup & Handle isn’t bullish because of lines—it's bullish because it reflects crowd hesitation turning into confidence.
🚨 "Spill or Serve?" — comment below .
🧠 Watch the volume.
🛑 Don't jump the gun.
✅ Let the breakout come to you.
📜 Disclaimer:
This is not trading advice—this is pattern psychology in motion. Always consult your financial advisor before making real trades. This story is meant to provoke thought, not profits.
GMDC, Long 1D, Breakout, VolumesGMDC has shown a good volume in the stock today and has taken support from the previous low. If it breaks its recent high of 428 with Bullish candlestick patterns like Bullish Engulfing, Hammer & Inverted Hammer, Piercing Line, Morning Star, Three White Soldiers, Tweezer Bottoms or Bullish Harami, then take a long trade on this stock.
Entry: 428 (on Bullish candlestick pattern)
Target1: 445
Target2: 450 till 480.

PDD Monster breakoutThis chart looks insanely good.
To go with the breakout there was today a 1.5M order for November, 135c.
I am looking to buy dips on this name!
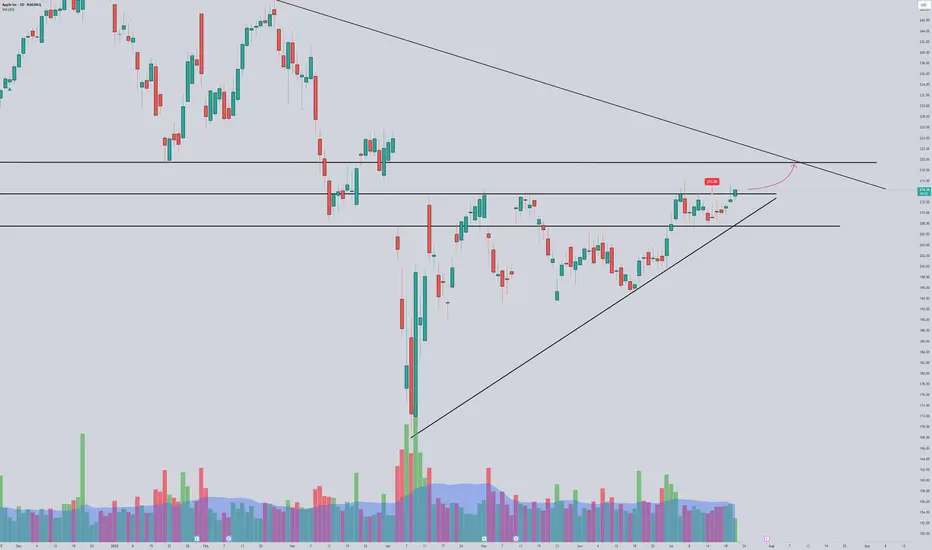
AAPL next leg up?A daily close above 213.75 could set AAPL to move towards 220
We are retesting some strong resistance at 215, and above it we could see price moving faster to retest trendline.
Keeping this on the watch as ERs is not far and we can see a pre run
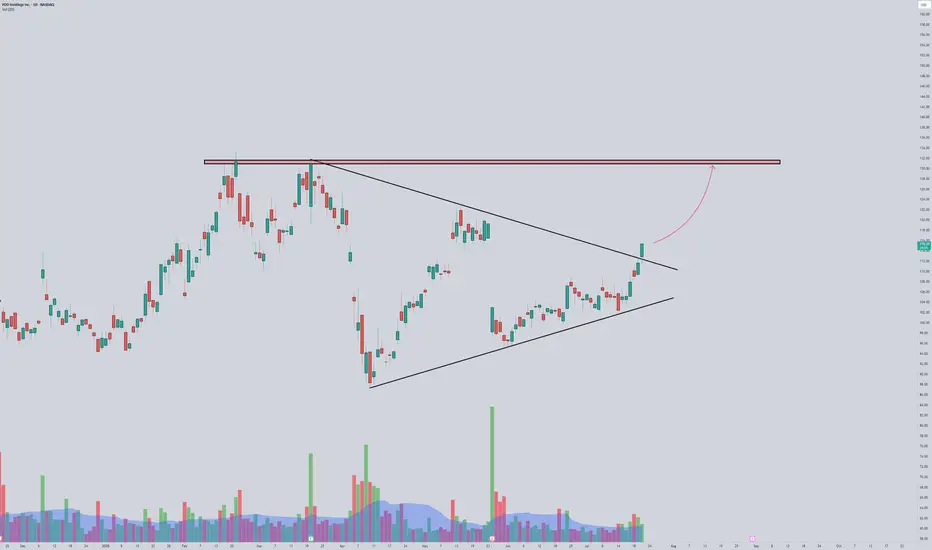
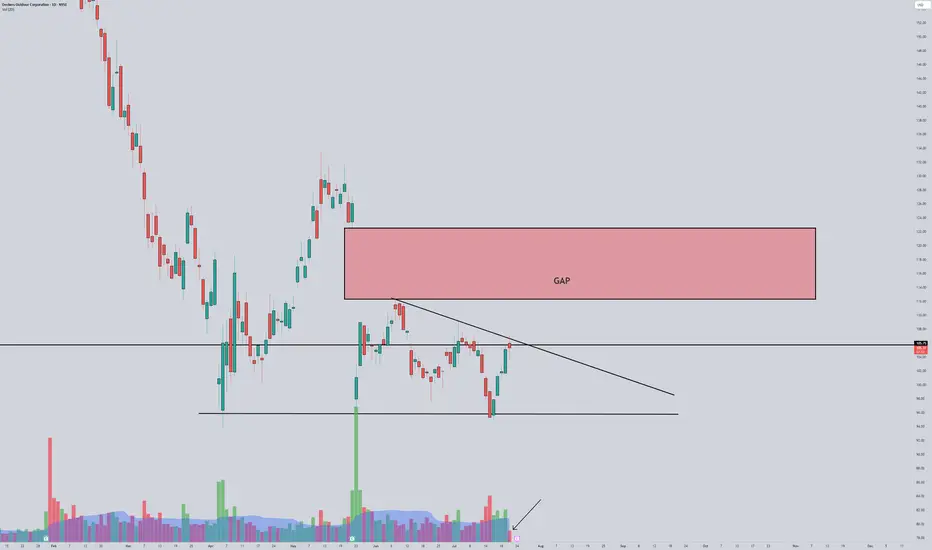
Intriguing setupOn 7/21 a OTM call flow came in for 114c expiring this Friday July 25th
Almost $130k in calls on a strike that has very low OI.
We have a beautiful gap above and a possible flag break in very low volume today.
Also, ER on thursday.
Do they know something??
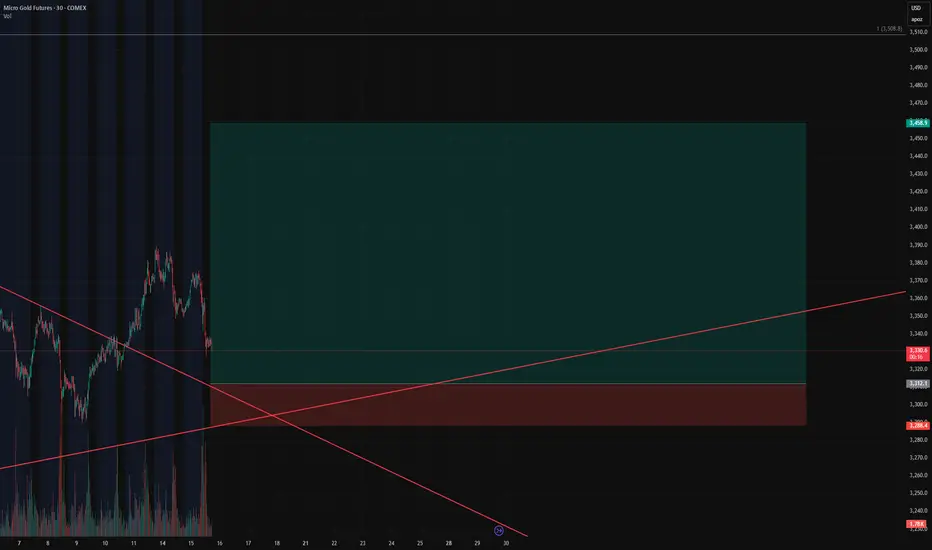
Gold Bulls Loading Up – Our Short Squeeze Trigger is Set!🚨 Gold Bulls Loading Up – Our Short Squeeze Trigger is Set!
We’re flipping the script on COMEX_MINI:MGC1! After a prolonged downtrend and textbook wedge compression, our breakout long is LIVE – but not without trapping the late shorts first.
💥 Entry: $3,312.1
🛑 Stop: $3,288.4
🎯 Target: $3,458.9
🧮 Risk/Reward: 6.19
Price just bounced at the retest of the wedge apex, and volume is confirming the move. If this holds, we’re riding momentum all the way up – and letting short pressure fuel the breakout.
📈 Trendline breached.
⏳ Time compression converging.
⚠️ If you’re still short, watch your stops!
NYKAA<>BreakoutA breakout is occurring with increasing volume. A high-volume close above the 221-222 level would confirm the breakout, potentially from a Cup & Handle pattern.
Keeping on radar.

Denta Water & Infra Solutions Ltd <>Returns Chart shared on July 16th has already yielded a 20%+ return. Analysis suggests the stock should consolidate at its current high level after the recent steep rise, followed by a potential breakout.

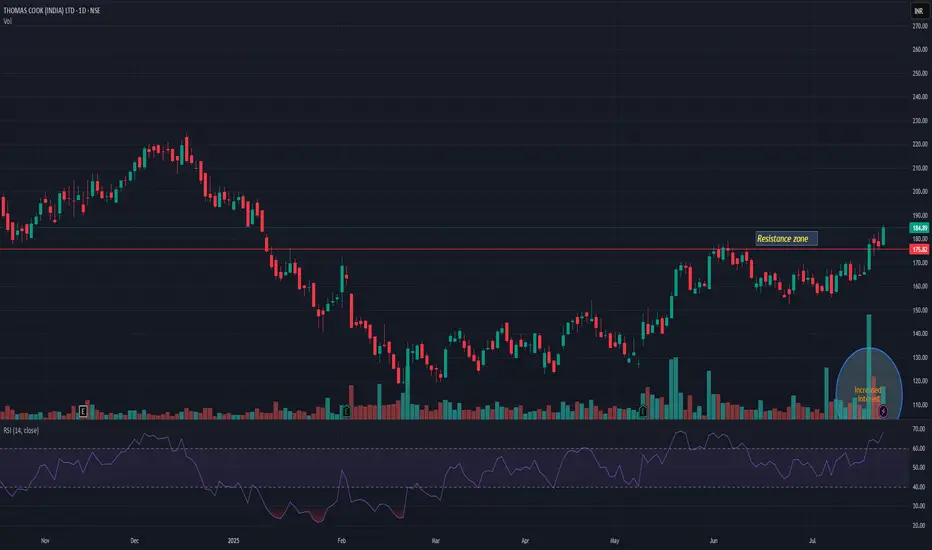
THOMASCOOKTHOMASCOOK has broken previous resistance level. Market participation is also increased with breakout. It may resist nr 210-12 level. Closing below 175 may change my view. Keep it on radar.
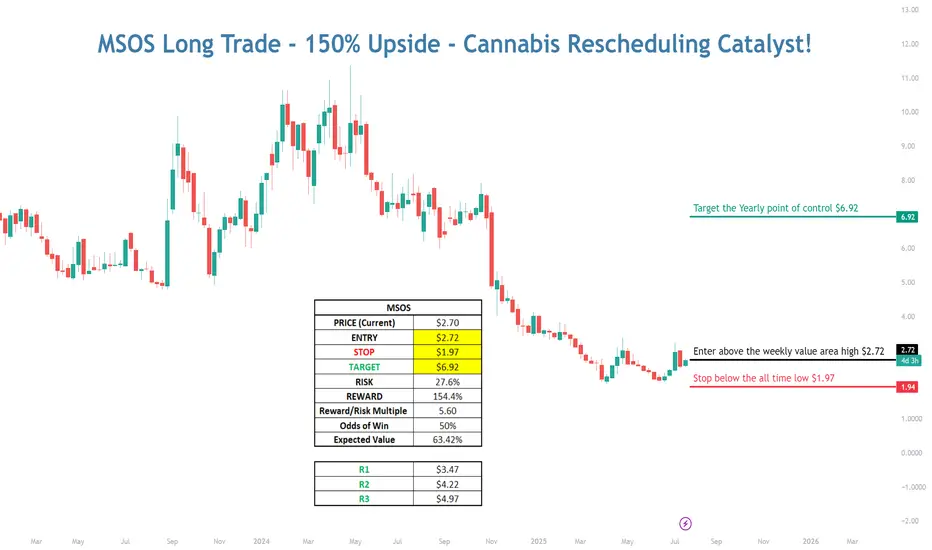
MSOS Long with 150% Upside - Cannabis Rescheduling Catalyst💠 Catalyst : Cannabis is currently classified as a schedule I drug alongside heroin, bath salts, and synthetic opioids that kill thousands every year — all while being safer than Tylenol and legal in over half the country. Cannabis is likely to be rescheduled to a schedule III drug soon after Terry Cole is confirmed as the head of the DEA. The vote to confirm him is expected to take place...TODAY
As a schedule I drug, cannabis companies can’t deduct regular business expenses for tax purposes, have limited access to banking, must transact with customers in all cash, and US multi-state operators are unable to list on the major US exchanges.
Terry Cole will be confirmed as the new head of the DEA, and when he is confirmed, the stalled process to reschedule cannabis from a schedule I to a schedule III drug should resume. If cannabis is rescheduled, that will pave the way for further research, destigmatize it, and open the door to banking and uplisting of US multi-state operators to the major exchanges in the near future.
This trade capitalizes on the fact that investors are not positioned for reform and further positive catalysts. The worst-case scenario is priced into the MSOS ETF, and when good news on rescheduling hits the tape, that should start a NEW Bull market in the MSOS cannabis stocks.
💠 Technical Setup:
Bear Market
• Multi-year bear market throughout the entire Biden administration on promises to reschedule that were never followed through on
• Capitulation when Trump won the election on the prospect of potentially another 4 years of no reform
Bearish to Bullish Technical Transition!
• LT Stage 1A Bottom Signal (Price > 50D SMA)
• ST Stage 2A Breakout (First day Price > 10D EMA and 20D SMA)
• Hourly Chart – Breaking out above Weekly Value Area
• Daily Chart – Trading above the Monthly Value Area
• Overlapping prior monthly value areas in sight!
• VPOC in sight!
• Weekly Chart – Targeting a retest of the Yearly POC
💠 Trade Plan
ENTRY: $2.72 (Break above weekly value area high)
STOP: $1.97 (Below the prior all-time-low)
TARGET: 6.92 (A retest of the yearly point of control from 2024)
RISK: 27.6%
REWARD: 154.4%
R/R Multiple: 5.6X
Probability of Win: 50%
Expected Value: 63.42%

MSOS Long with 150% Upside - Cannabis Rescheduling Catalyst💠 Catalyst: Cannabis is currently classified as a schedule I drug alongside heroin, bath salts, and synthetic opioids that kill thousands every year — all while being safer than Tylenol and legal in over half the country. Cannabis is likely to be rescheduled to a schedule III drug soon after Terry Cole is confirmed as the head of the DEA. The vote to confirm him is expected to take place...TODAY
As a schedule I drug, cannabis companies can’t deduct regular business expenses for tax purposes, have limited access to banking, must transact with customers in all cash, and US multi-state operators are unable to list on the major US exchanges.
Terry Cole will be confirmed as the new head of the DEA, and when he is confirmed, the stalled process to reschedule cannabis from a schedule I to a schedule III drug should resume. If cannabis is rescheduled, that will pave the way for further research, destigmatize it, and open the door to banking and uplisting of US multi-state operators to the major exchanges in the near future.
This trade capitalizes on the fact that investors are not positioned for reform and further positive catalysts. The worst-case scenario is priced into the MSOS ETF, and when good news on rescheduling hits the tape, that should start a NEW Bull market in the MSOS cannabis stocks.
💠 Technical Setup:
Bear Market
• Multi-year bear market throughout the entire Biden administration on promises to reschedule that were never followed through on
• Capitulation when Trump won the election on the prospect of potentially another 4 years of no reform
Bearish to Bullish Technical Transition!
• LT Stage 1A Bottom Signal (Price > 50D SMA)
• ST Stage 2A Breakout (First day Price > 10D EMA and 20D SMA)
• Hourly Chart – Breaking out above Weekly Value Area
• Daily Chart – Trading above the Monthly Value Area
• Overlapping prior monthly value areas in sight!
• VPOC in sight!
• Weekly Chart – Targeting a retest of the Yearly POC
💠 Trade Plan
ENTRY: $2.72 (Break above weekly value area high)
STOP: $1.97 (Below the prior all-time-low)
TARGET: 6.92 (A retest of the yearly point of control from 2024)
RISK: 27.6%
REWARD: 154.4%
R/R Multiple: 5.6X
Probability of Win: 50%
Expected Value: 63.42%
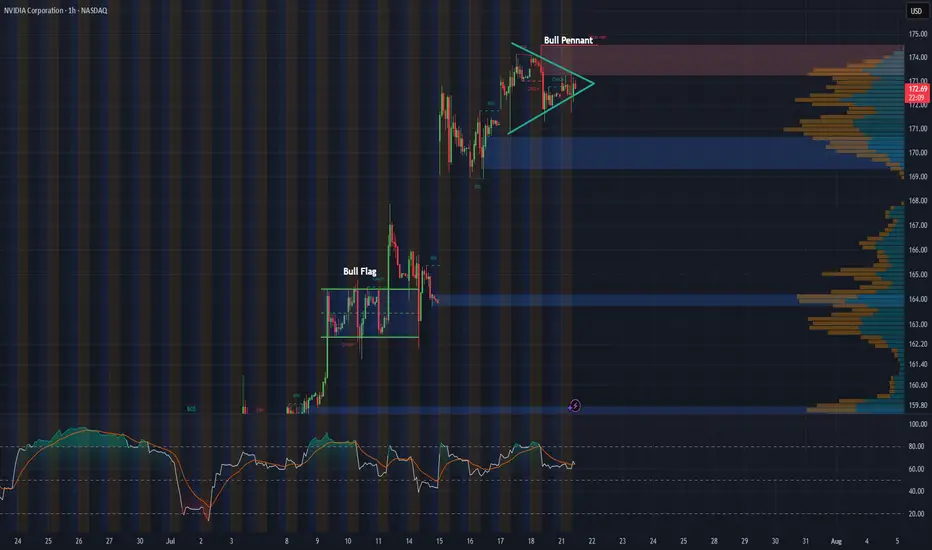
NVDA 1-Hour Chart UpdateHey everyone, just wanted to share a quick update on NVDA’s 1-hour chart. Following last week’s bull flag breakout, the stock appears to be consolidating into what looks like a solid bull pennant formation.
With major tech earnings on the horizon and the recent approval to sell H20 chips to China, this pattern could be setting the stage for another breakout. Will NVDA continue its impressive rally, or is this just a breather before the next move?
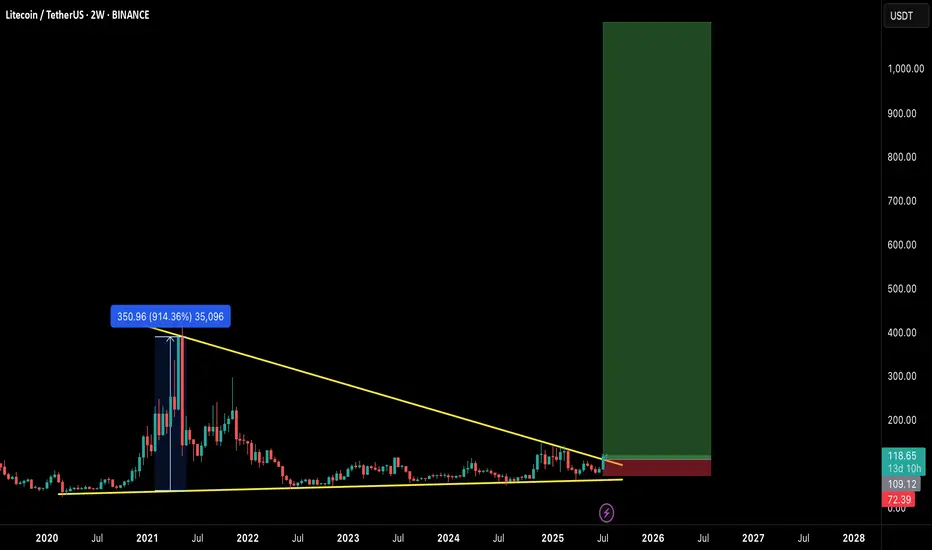
$LTC READY FOR EXPLOSION! THE COMEBACK OF THE OG?Litecoin has quietly formed one of the most massive macro structures in the market — a multi-year falling wedge on the 2-week timeframe, now breaking out with early confirmation.
This could be the start of a generational move, similar to the 2020 breakout. Let's break it down:
🧠 Technical Breakdown:
✅ Falling wedge forming since 2021 — 4 years of compression
✅ Volume and structure support breakout
✅ LTC already gave a 914% rally last time it broke a similar level
📏 Target zone extends above $900–$1000
🛒 Entry Zone:
Current Price: $118
🟢 Buy on breakout or dips near $105–$110 for safer entries
🎯 Target Zones:
TP1: $280
TP2: $400
TP3: $650
TP4: $950+
🛑 Stop-loss:
Breakdown below $72 (last higher low & wedge base)
⚖️ Risk-to-Reward:
High timeframe structure = High conviction play.
Potential R:R > 8x — Rare macro opportunities like this don’t come often.
🧩 Final Thoughts:
LTC may not be the flashiest alt anymore, but this setup is technically undeniable. If BTC enters full bull cycle, LTC could ride the wave explosively.
🔥 This could be a "buy and forget" macro play for 6–12 months.
💬 Let me know your thoughts in the comments & hit that ❤️ if you like macro setups like these!
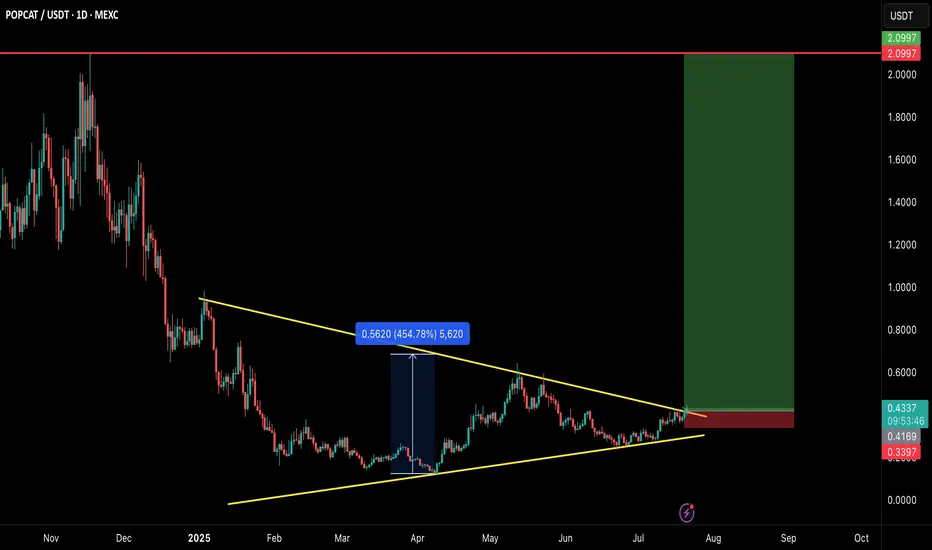
POPCAT/USDT – MEGA BREAKOUT INCOMING!POPCAT is breaking out of a large symmetrical triangle structure that has been developing for several months. This is a textbook bullish reversal setup with explosive potential — and the chart says it all! 👇
🧠 Technical Breakdown:
✅ Clean symmetrical triangle breakout on daily timeframe
🔥 Strong base formation followed by volume breakout
💹 Consolidated above trendline for weeks — breakout looks real
🛒 Entry Zone:
CMP ($0.43) or buy in dips toward $0.40–$0.42
🎯 Targets:
TP1: $0.65
TP2: $1.10
TP3: $1.60
TP4: $2.10
🛑 Stop-loss:
Close below $0.34
📊 Risk/Reward:
Solid RR > 4.0 with high potential if momentum kicks in. Volume and structure both support a strong upside.
📢 Final Thoughts:
This is not just a breakout — it's a multi-month accumulation breakout. If the market stays bullish, POPCAT could go parabolic again just like it did earlier.
🚨 Always use proper risk management and SL!
💬 Drop your thoughts in comments & don’t forget to hit that ❤️ if you find this helpful.
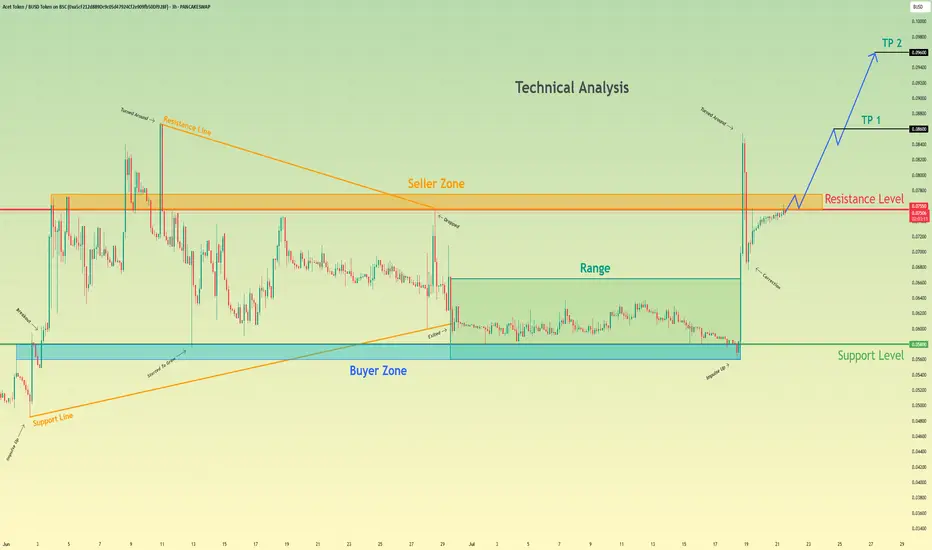
Acet Token will break resistance level and continue to move upHello traders, I want share with you my opinion about Acet Token. Looking at the recent price action, we can see a clear narrative unfolding. The asset initially formed a large wedge pattern, experiencing a trend reversal that led to a breakdown and a period of prolonged consolidation within a defined range between the buyer zone around 0.0580 and the upper boundary. Recently, however, the market showed a strong impulse, breaking out of this range and decisively moving upwards. Currently, the price of act is testing the key resistance level at 0.0755, an area historically defined as a seller zone. The hypothesis is that after this powerful impulse, the asset will manage to break and hold above this resistance. A successful retest of the 0.0755 level would likely signal a continuation of the uptrend, paving the way towards our specified take-profit targets. The first goal is set at TP 1 at 0.0860, with a further extension to TP 2 at 0.0960, capitalizing on the anticipated bullish momentum. Please share this idea with your friends and click Boost 🚀
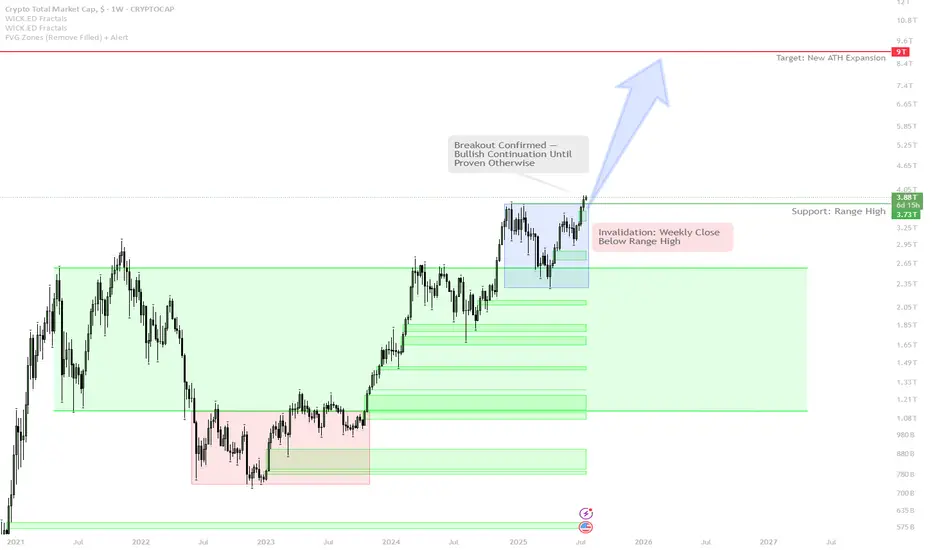
Total Crypto Market Cap: Weekly Breakout Signals Bull Run Contin
The weekly candle has closed above the key range high — this is a major bullish signal, similar to the breakout seen in early 2021.
As long as price remains above this breakout level, the scenario is a continuation uptrend — expect further expansion and strong price action.
If the market fails and closes back below the range high, the breakout will be invalidated — this would signal a potential range or pullback phase.
Current strategy is to trade with the trend:
Hold spot exposure and add on confirmed breakouts.
Do NOT short without a clear breakdown and structure reversal.
If a failed breakout occurs (weekly candle closes back below range high), take profit quickly and switch to risk-off mode.
Market psychology: Most buyers hesitate at lows, but FOMO after a strong move is classic. The disciplined approach is to buy the setup, not the hype.
This is a textbook technical breakout with historical precedence for explosive upside. As long as Total Market Cap holds above the range high, the path of least resistance is up. Attempting to fade the breakout is risky unless there is a clear weekly close back below the level. Trend continuation is favored until proven otherwise. The correct approach is to stay with the trend and manage risk only if a breakdown occurs.
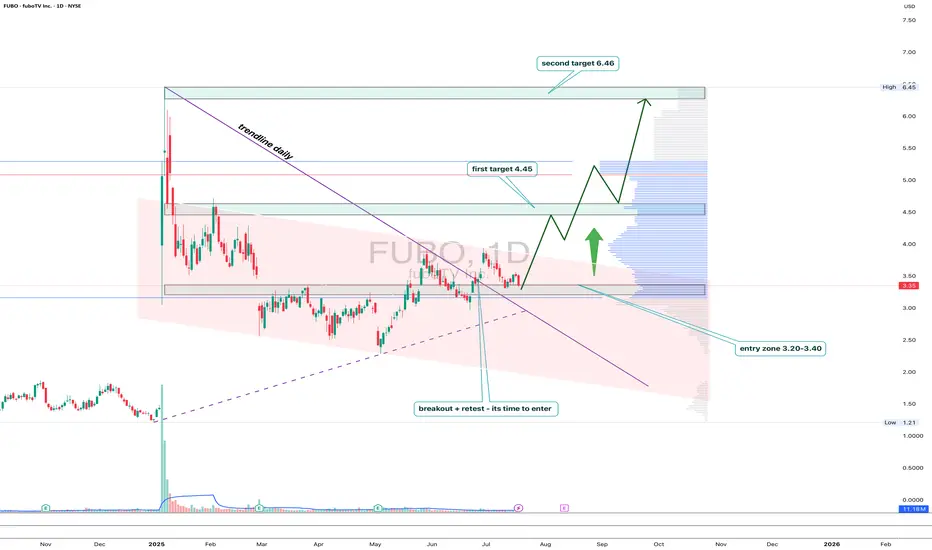
FUBO: trendline breakout with a subscription to $6.46FUBO has broken out of the descending trendline on the daily chart, followed by a clear retest and consolidation above the key 3.20–3.40 area. This zone coincides with the 0.5 Fibonacci retracement and high-volume support, confirming strong buyer interest.
As long as price holds above 3.20, the setup looks bullish with targets at 4.45 (0.382), 5.22, and finally 6.46 — the major resistance and top of the current range. Volume picked up on the breakout, validating accumulation from bigger players.
Fundamentally, FuboTV remains a niche contender in the sports streaming market. With optimized spending and new partnerships with major sports leagues, interest may spike ahead of events like the Olympics and NFL season.
Tactical setup:
— Entry zone: 3.20–3.40
— Must hold: above 3.20
— Targets: 4.45 / 5.22 / 6.46
— Invalidation: break below entry without buyer confirmation
This breakout might just be FUBO’s ticket to prime time.
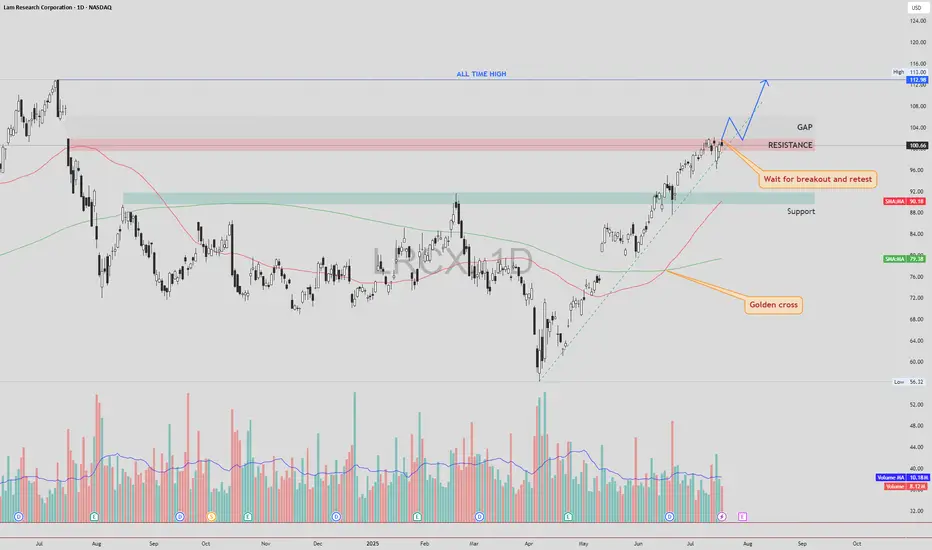
LRCX – Gap Fill First, Then Retest and Potential Move to ATHLRCX NASDAQ:LRCX is currently trading just below a key resistance zone, supported by strong bullish momentum and a confirmed Golden Cross formation.
🔍 Technical Scenario
There is a high probability that price may fill the gap above without retesting the current resistance. After the gap is filled, we could see a pullback to retest the previously untouched resistance zone (now acting as support).
If this retest is successful and holds, the structure may support a continuation move toward the All-Time High (ATH) zone.
📌 Trade Plan
Entry: Avoid chasing the breakout candle. Wait for a gap fill, followed by a clean retest of the broken resistance zone. Enter on confirmation of support holding.
Stop Loss: Place SL just below the retest zone or under the most recent higher low (structure-based stop).
Target 1: Gap fill completion
Target 2 : All-Time High (ATH), if retest confirms
⚠️ Risk Management
The gap-fill rally without retest can be volatile. Patience is key — let the price come back and confirm the breakout zone as new support.
As always, DYOR and manage your position sizing based on your risk profile.
CARR – Bullish Breakout Toward Gap and ATHCarrier Global NYSE:CARR has closed above a key resistance zone near $76.50–$77.00 , indicating a possible breakout setup in progress. This move comes after a Golden Cross , where the 50 SMA crossed above the 200 SMA — a long-term bullish signal.
🔍 Technical Highlights:
✅ Golden Cross: Bullish momentum building.
✅ Breakout level: Price broke above horizontal resistance zone.
🔄 Next step: Wait for a potential retest of the breakout zone.
🔊 High volume on the breakout and retest would increase the strength and reliability of the setup.
🎯 Target Levels:
First Target (TP1): ~$80.00 — near the top of the existing gap.
Second Target (TP2): ~$83.32 — the current All-Time High (ATH).
🛡 Trade Plan:
Entry idea: After a clean retest of the breakout level with supportive volume.
Stop-loss: Below the retest zone or under 50 SMA (~$72-74 area).
Invalidation: If price falls back below resistance on high volume.
Conclusion:
CARR shows a strong breakout setup after a Golden Cross. A confirmed retest with volume could open the door toward the gap fill and new all-time highs.
DYOR – This is not financial advice.
