PYTH 4H ANALYSIS – Bullish Setup in PlayAfter completing a 5-wave impulse to the downside, PYTH has shown signs of a trend reversal. The first upward impulse displayed a clear 5-wave Elliott structure, breaking out of the descending channel — a strong bullish signal.
Following this, a classic A-B-C zig-zag correction occurred, which acted as a retest of the broken channel resistance, now turned support. This confluence increases the probability of a bullish continuation.
With market structure aligning and correction likely complete, PYTH is showing potential for a 50%+ move to the upside.
🟢 Entry Zone: 0.1400 – 0.1500
🔴 Stop Loss: 0.1272 (Below wave C & structural support)
🎯 Target Price: 0.2235
💡 Note: Always manage your risk and confirm with your own analysis before entering any trade.
Breakout!

TRUMP is Back on the Move! Breakout Trade Setup Inside!!🚀 TRUMP Bull Pennant Breakout – 40% Potential Incoming?! 👀🔥
Hey Traders! If you're all about high-conviction plays and real alpha, smash that 👍 and tap Follow for more setups that actually deliver! 💹💯
TRUMP is breaking out of a symmetrical triangle in the 4H time frame — signaling the potential for a massive upside move! The last time we saw similar consolidation, it exploded with over 40% gains.
📈 Entry: Current Market Price
🎯 Target: $18.70+
🛑 Stop Loss: $12.58
Lev: Use low lev (Max 5x)
📊 Risk/Reward: High-reward setup for breakout traders
🔥 With momentum building and volume picking up, this setup could deliver strong returns if the breakout sustains.
💬 What are your thoughts on this move? Are you trading $TRUMP?

ONT ANALYSIS 📊 #ONT Analysis
✅There is a formation of Falling Wedge Pattern on daily chart with a good breakout and retest and currently trading around its support zone🧐
Pattern signals potential bullish movement incoming after the confirmation of retest
👀Current Price: $0.1483
🚀 Target Price: $0.1940
⚡️What to do ?
👀Keep an eye on #ONT price action and volume. We can trade according to the chart and make some profits⚡️⚡️
#ONT #Cryptocurrency #TechnicalAnalysis #DYOR

Xrp - Prepare for at least a +50% move!Xrp - CRYPTO:XRPUSD - will head much higher:
(click chart above to see the in depth analysis👆🏻)
Xrp has perfectly been respecting market structure lately and despite the significant volatility, the overall crypto market remains bullish. Especially Xrp is about to perform a bullish break and retest, which - if confirmed by bullish confirmation - could lead to a rally of about +50%.
Levels to watch: $3.0
Keep your long term vision!
Philip (BasicTrading)

DYDX ANALYSIS📊 #DYDX Analysis
✅There is a formation of Falling Wedge Pattern on daily chart and currently trading around its support zone🧐
Pattern signals potential bullish movement incoming after the confirmation of retest
👀Current Price: $0.6344
🚀 Target Price: $0.7580
⚡️What to do ?
👀Keep an eye on #DYDX price action and volume. We can trade according to the chart and make some profits⚡️⚡️
#DYDX #Cryptocurrency #TechnicalAnalysis #DYOR

ETH ANALYSIS📊 #ETH Analysis
✅There is a formation of Falling Wedge Pattern on daily chart and currently trading around its major support zone🧐
Pattern signals potential bullish movement incoming after sustain above the major support zone
👀Current Price: $2380
🚀 Target Price: $2785
⚡️What to do ?
👀Keep an eye on #ETH price action and volume. We can trade according to the chart and make some profits⚡️⚡️
#ETH #Cryptocurrency #TechnicalAnalysis #DYOR

NZD-JPY Bearish Breakout! Sell!
Hello,Traders!
NZD-JPY made a bearish
Breakout of the rising support
Line then made a retest of the
New resistance and is going
Down now so we are bearish
Biased and we will be expecting
A further bearish move down
Sell!
Comment and subscribe to help us grow!
Check out other forecasts below too!
Disclosure: I am part of Trade Nation's Influencer program and receive a monthly fee for using their TradingView charts in my analysis.

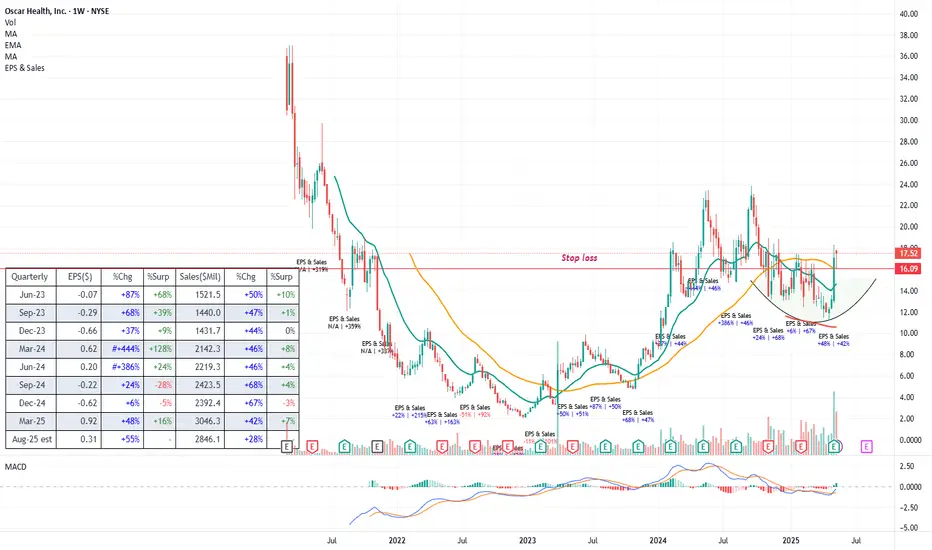
OSCR (Long) - Impressive growth, with low but improving marginsMy last healthcare idea, which is also my most recent, has gone spectacularly wrong after the stock fell precipitously on news which I was not able to source despite my extensive efforts. So, what else to do then than to jump on another attractive healthcare idea - NYSE:OSCR
Fundamentals
The underlying growth of NYSE:OSCR can only be described as impressive, with the firm growing by more than 40% every quarter (y-o-y) ever since it has gone public back in 2021 (despite already reaching over 10b in annual sales) - I left the numbers in the chart for a reference
The reason why its valuation is so low (0.4 P/S) compared to its peers is mainly the razor-thin margins , with EBITDA margins hovering only around 2% - but this is coming from a negative territory and most importantly, continues improving.
The firm just reported another stellar earnings and from the public discourse, its insurance solutions seem to steaming through the market and gaining market share
The main risk, which is pretty significant if realized, is political, and tied to the ACA subsidies - for a great article you can read about it here
However, for someone who plans to hold for the next 3-6 months (like myself), this shouldn't be an issue
Technicals
As mentioned, the firm recently released stellar earnings which propelled the price >20% higher. After a little consolidation, the price seems to have held its ground and is now poised to go higher
The stock price also broke out from a base as depicted on the chart, though I have to admit, it does not have the degree of accumulation I would prefer but the overall setup still looks very attractive
Momentum indicators like Stochastic and MACD are all entering positive territory, meaning we are likely only entering the upside potential
Trade
I entered the trade right after the breakout as I had been eyeing the stock for some time. The next few days confirmed the breakout and the stock is now seemingly heading higher, providing another good entry point
The low of where the stock price now consolidated also represents a great stop loss point (marked by the red line on the graph)
No price targets as I am just looking to watch how the price action evolves over next weeks, but breaking the previous local high would be a good point for potentially adding
Follow me for more analysis & Feel free to ask any questions you have, I am happy to help
If you like my content, Please leave a like, comment or a donation , it motivates me to keep producing ideas, thank you :)
GUN/USDT – Breakout Retest in Play!🚀 GUN Breakout Alert – 100% Potential Incoming?! 👀🔥
Hey Traders! If you're all about high-conviction plays and real alpha, smash that 👍 and tap Follow for more setups that actually deliver! 💹💯
GUN just completed a clean breakout from a long-term symmetrical triangle and is now retesting the breakout zone — a classic bullish continuation signal! 🔁
✅ Strong breakout followed by healthy pullback
✅ Retesting previous resistance turned support
✅ Perfect technical structure for a potential explosive move ahead 💥
📍 Entry: CMP and add more around $0.051
🎯 Target: $0.107
🛑 SL: Close below $0.047
📊 Leverage: Use low leverage (Max 5x) for safety
Momentum looks primed for another 100%+ rally if support holds.
Let’s ride this wave! 🌊
What do you think about this? Share your views in the comments section.

DAX Will Keep Growing! Buy!
Hello,Traders!
DAX broke the key horizontal
Level of 23,319 and the index
Made a pullback and retest
And is now going up again
So we are bullish biased
And we will be expecting
A further bullish move up
Buy!
Comment and subscribe to help us grow!
Check out other forecasts below too!
Disclosure: I am part of Trade Nation's Influencer program and receive a monthly fee for using their TradingView charts in my analysis.

EUR_AUD BULLISH WEDGE|LONG|
✅EUR_AUD made a bullish
Breakout from the bullish
Wedge pattern and the
Breakout is confirmed so
We are bullish biased and
We will be expecting a
Further bullish move up
On Monday when the
Market reopens
LONG🚀
✅Like and subscribe to never miss a new idea!✅
Disclosure: I am part of Trade Nation's Influencer program and receive a monthly fee for using their TradingView charts in my analysis.

EURJPY Analysis: Range Bounces & BreakoutHello traders!
EURJPY is in a daily range and is offering three trading scenarios.
The first scenario suggests the pair may react bearishly from the currently approached zone, setting up a bounce opportunity that could drive price lower toward the 162.130 area.
The second scenario anticipates a bounce toward the 158.400 area, if price reaches the support zone of the range.
The third scenario anticipates a breakout above the resistance zone, followed by a retest, which could present a strong opportunity for continuation toward the 169.300 area.
Discretionary Trading: Where Experience Becomes the Edge
Discretionary trading is all about making decisions based on what you see, what you feel, and what you've learned through experience. Unlike systematic strategies that rely on fixed rules or algorithms, discretionary traders use their judgment to read the market in real time. It's a skill that can't be rushed, because it's built on screen time, pattern recognition, and the ability to stay calm under pressure.
There's no shortcut here. You need to see enough market conditions, wins, and losses to build that intuition—the kind that tells you when to pull the trigger or sit on your hands. Charts might look the same, but context changes everything, and that's something only experience can teach you.
At the end of the day, discretionary trading is an art, refined over time, sharpened through mistakes, and driven by instinct. It's not for everyone, but for those who've put in the work, it can be a powerful way to trade.

EURNZD Analysis: Bounce & BreakoutHello traders!
EURNZD is in a 1h range and is offering two trading scenarios.
The first scenario suggests the pair may react bearishly from the resistance zone, setting up a bounce opportunity that could drive price lower toward the 1.90000 area.
The second scenario anticipates a breakout above the resistance zone, followed by a retest, which could present a strong opportunity for continuation toward the 1.92000 area.
Discretionary Trading: Where Experience Becomes the Edge
Discretionary trading is all about making decisions based on what you see, what you feel, and what you've learned through experience. Unlike systematic strategies that rely on fixed rules or algorithms, discretionary traders use their judgment to read the market in real time. It's a skill that can't be rushed, because it's built on screen time, pattern recognition, and the ability to stay calm under pressure.
There's no shortcut here. You need to see enough market conditions, wins, and losses to build that intuition—the kind that tells you when to pull the trigger or sit on your hands. Charts might look the same, but context changes everything, and that's something only experience can teach you.
At the end of the day, discretionary trading is an art, refined over time, sharpened through mistakes, and driven by instinct. It's not for everyone, but for those who've put in the work, it can be a powerful way to trade.

Euro may break support level and fall to support line of channelHello traders, I want share with you my opinion about Euro. In this chart, we can see how the price after another rejection from the resistance boundary of the descending channel, the Euro began to show renewed bearish pressure. The price attempted to gain ground above the buyer zone, but the breakout lacked follow-through and quickly reversed. This false breakout scenario often acts as a trigger for a deeper drop, especially when it occurs near the mid-range of a well-defined channel. The market remains inside a structured downward channel, with lower highs and lower lows still intact. At this point, the price is approaching the upper section of the buyer zone again. If sellers regain control and push the market lower, a breakdown below 1.1135 could open the way for another leg to the downside. I expect EUR will continue declining toward the support line of the channel. That’s why my current TP 1 is set at 1.100, which aligns with the lower boundary of the structure and marks a potential short-term target for bearish continuation. Please share this idea with your friends and click Boost 🚀

EUR-AUD Bullish Breakout! Buy!
Hello,Traders!
EUR-AUD has formed a bullish
Wedge pattern and now we are
Seeing a bullish breakout which
Is confirmed so we are bullish
Biased and we will be expecting
A further bullish move up
Buy!
Comment and subscribe to help us grow!
Check out other forecasts below too!
Disclosure: I am part of Trade Nation's Influencer program and receive a monthly fee for using their TradingView charts in my analysis.

Convex Finance (CVX) Rectangle (1W)BINANCE:CVXUSDT has been trading in a rectangle with well-defined boundaries since January 2023, and it has recently reclaimed the 1-year EMA, potentially shifting the bias to bullish.
Key Levels to Watch
• $1.5-$2.0: Main demand zone and invalidation point for any bullish TA if broken
• $3.0: 1-year EMA, successfully reclaimed and retested as support
• $4.4: Rectangle midline, previously relevant as a S/R
• $6.1-$7.2: Main supply zone and upper boundary of the rectangle
• $13.0: Previous swing high and rectangle breakout target, which would be confirmed by a weekly close above $7.2 with good volume
