BTCUSD Tests Buyer Zone — Eyes Break Below $100KHello traders, here’s my current outlook on Bitcoin (BTCUSD). The market continues to trade within a broader bearish structure after breaking down from the previous rising channel. The price failed to hold above the $110,000–$111,000 Seller Zone, where multiple fake breakouts occurred, indicating strong bearish pressure and aggressive selling activity in that region. After the rejection from the Seller Zone, BTC shifted into a descending trend structure, forming lower highs along a clearly defined Resistance Trendline. Each corrective move to the upside has been capped by this trendline, confirming that sellers are maintaining control. Meanwhile, the Support Level around $100,200–$101,000 has acted as a key Buyer Zone, where price has repeatedly paused and reacted, suggesting that buyers are attempting to absorb selling pressure here. Currently, BTC is consolidating just above this Support Zone, but the overall momentum remains bearish. If the price fails to break above the descending Resistance Line, we could see a continuation of the downtrend, likely pushing toward a retest of the $100,200 Support Level. A confirmed breakdown below this level would expose the next downside support levels and reinforce the sellers’ dominance. However, if buyers manage to hold the price above $100,200 and force a breakout above the descending Resistance Line, a short-term corrective recovery could unfold toward the $103,000–$105,000 region. This area remains critical and is likely where sellers may look to re-enter the market based on previous reaction structure. For now, the market structure favors a bearish bias, with the trend down and sellers maintaining stronger control. I am watching for a reaction at the current support — if the level breaks, continuation lower becomes the primary expectation. Please share this idea with your friends and click Boost 🚀
Breakout!

Nifty Metal Index NIFTY METAL INDEX Updated Chart for members Reference.
On Big Breakout (BO). On Confirmation Big rally on card 🧐
Support, Resistance /BO level, Tgt, Updated Tgt Marked in Chart.
Stocks to be noted
TATA STEEL
HINDALCO
JINDAL STEEL
SAIL
NMDC & NMDC STEEL
GALLANT ISPAT
WELSPUN
GPIL

Berkshire Hathaway is breaking out of channelBerkshire Hathaway NYSE:BRK.B is breaking out of its long descending channel on the daily timeframe.
After months of consolidation, price has finally pushed through the upper boundary near $495, signaling the start of potential upward momentum.
If this breakout holds, the next major target could be around the mid-range near $520 — setting up what could become a powerful trend reversal for one of the market’s strongest giants.

GBPJPY BULLISH BIAS|LONG|
✅GBPJPY after mitigating the key demand level, price shows bullish order flow and imbalance fill. A potential rally may target the next external liquidity zone above recent swing highs. Time Frame 4H.
LONG🚀
✅Like and subscribe to never miss a new idea!✅

BTCUSD Short: Bearish Rejection Targeting $100.6K Support ZoneHello traders! Bitcoin (BTCUSD) continues to trade within a well-defined descending channel, reflecting sustained bearish pressure after the rejection from the $116,000 Supply Zone. The market previously experienced a Fibonacci Arc retracement followed by a strong sell-off, signaling exhaustion from buyers and the formation of a broader corrective structure.
Currently, we have seen multiple fake breakouts on both the upper and lower boundaries of the channel, suggesting that liquidity sweeps are actively influencing volatility. Notably, price recently tapped the major Demand Zone around $100,600, a level that has historically triggered strong reactions. The sharp wick and immediate recovery from this support indicate buyer accumulation and defense of the zone. A short-term pivot point has now formed near $103,500–$104,000, marking a key decision area. If buyers hold above the $100,600–$101,000 support, a corrective move toward the upper channel boundary becomes increasingly likely.
I expect Bitcoin to retest the $103,500–$105,000 Pivot Resistance Zone, which aligns with the mid-channel level and previous breakout point. If price shows rejection in this region — such as bearish candlestick patterns or weakening momentum — it would provide a favorable entry point for short positions. A break and hold below $100,600 would strengthen bearish momentum and may trigger a continuation toward $98,000. However, if the price breaks and closes above $105,200, the short setup becomes invalid, as this would signal a potential shift in structure and a move toward $110,000. Manage your risk!

EURUSD Long: Rebound Setup Targeting 1.1560 Pivot ResistanceHello traders! EURUSD continues to trade within a clearly defined descending channel, maintaining a consistent bearish structure characterized by lower highs and lower lows. The recent rejection from the 1.1660 Supply Zone once again confirmed strong seller presence at that level. Additionally, the fake breakout above the channel resistance further highlighted the inability of buyers to shift the market structure.
Currently, price continued moving lower and is now testing the 1.1475–1.1500 Demand Zone, which aligns with the lower boundary of the descending channel. This area has previously acted as a reaction zone, meaning buyers have shown interest here before. The recent candle structure suggests that bears are slowing down near the demand area, indicating potential for a corrective pullback rather than immediate continuation downward.
In my opinion, If buyers manage to defend the 1.1475 Demand Zone, we could see a short-term bullish rebound toward the 1.1560 Pivot Resistance. This creates a favorable area for short-term long positions aiming for corrective upside movement. However, if sellers break below 1.1475 and price closes beneath the demand line, this would signal continuation of the primary bearish trend, opening the path toward lower levels around 1.1420–1.1380. For now, as long as price holds above the demand zone, a corrective rebound remains the more probable scenario. Manage your risk!

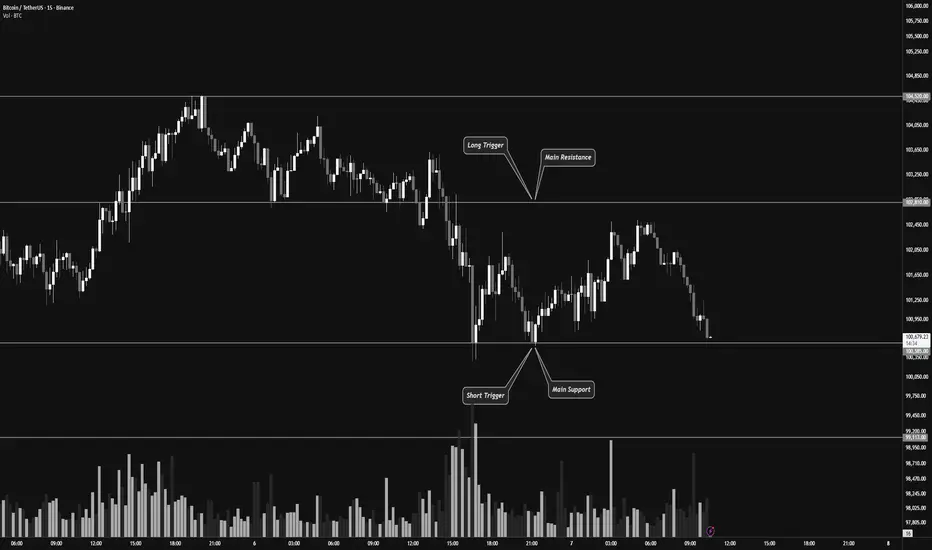
Break of Support or Multi-Timeframe Trend Reversal ?👋🏻 Hey everyone! Hope you’re doing great! Welcome to SatoshiFrame channel.
✨ Today we’re diving into the 15-Mimutes Bitcoin analysis. Stay tuned and follow along!
👀 On the 15-minute timeframe for Bitcoin, we can see that after breaking a multi-timeframe support, Bitcoin is currently testing its support zone around $100,585.
If this zone breaks, Bitcoin could continue its downward move and experience further decline.
However, if it moves upward and breaks the resistance zone around $102,810, it could trigger a potential trend reversal.
🕯 Pay attention to Bitcoin’s volume — the volume indicator currently shows an increase in selling pressure, suggesting that we might see a short-term volume consolidation before the price continues downward again.
✍️ The current scenarios for Bitcoin include both long and short setups, which you can use to plan your trades based on how the market reacts.
🟢 Long Position Scenario : A break above the $102,810 resistance zone, accompanied by increasing buy volume and bullish momentum, could signal a good long opportunity toward higher levels.
🟥 Short Position Scenario : A break below the $100,585 support zone, along with increasing sell pressure turning into strong selling momentum, could offer a short opportunity in line with the current trend.
❤️ Disclaimer : This analysis is purely based on my personal opinion and I only trade if the stated triggers are activated .
BTCUSD: Falling Wedge Reversal in Play Toward 106KHello everyone, here is my breakdown of the current Bitcoin setup.
Market Analysis
Bitcoin (BTCUSD) has recently shown signs of recovering bullish momentum after rebounding from the 100,600–101,000 Support Zone, which has acted as a key demand region during previous tests. The market experienced a fake breakout below the wedge support line, but buyers quickly stepped back in, pushing the price back inside the structure — a classic indication of seller exhaustion and accumulation interest.
Currently, BTC is trading inside a falling wedge pattern, which is typically considered a bullish reversal formation. The recent bounce from the lower boundary suggests that buyers are attempting to regain control, especially after the sharp decline from the 113,700 Resistance Zone. The price is now gradually approaching the mid-range of the wedge, signaling a potential continuation toward the upper resistance line.
My Scenario & Strategy
If Bitcoin holds above the 100,600–101,000 support, the bullish scenario remains valid. I expect the price to gradually move toward the 104,000–106,000 area as the next short-term target, aligned with the wedge resistance line. A breakout and confirmed hold above the wedge resistance would likely signal a trend reversal, opening the door for a larger continuation toward the 113,700 resistance zone, and possibly beyond.
However, if BTC loses the 100,600 support again and closes below the wedge, this would invalidate the bullish setup and could trigger a deeper move toward 98,000 before a new structure forms.
That's the setup I'm tracking. Thank you for your attention, and always manage your risk.

EURUSD Holds Key Support — Potential Recovery Toward 1.1540Hello traders, I’d like to share my view on EURUSD. The market has been trading in a consistent downtrend, respecting the descending Resistance Line, which has acted as a strong dynamic barrier for price throughout the recent move. Each attempt to break above this trendline resulted in either a turnaround or a fake breakout, confirming continued bearish pressure. However, recently price has reached an important Buyer Zone near 1.1480, where strong reaction has been seen several times in the past. This area aligns with horizontal support, increasing its significance. After touching the buyer zone again, EURUSD has shown initial signs of accumulation and early bullish momentum. Currently, the price is attempting to recover from this demand area, forming a breakout above the short-term Support Line — which now potentially flips into bullish structure. From here, I expect EURUSD to attempt a move toward the next resistance area around 1.1540, which represents the nearest Resistance Level. A confirmed breakout above this zone would open the path toward the higher Seller Zone around 1.1660, where previous fake breakouts occurred. But for now, the key confirmation will be whether the price holds above 1.1480 Buyer Zone. A breakdown below the zone would invalidate the bullish setup and likely continue the downtrend. Please share this idea with your friends and click Boost 🚀

Gold Forms Higher Low — Potential Upside Toward Resistance LineHello traders, here’s my current outlook on Gold (XAUUSD). Gold has recently transitioned out of a strong bearish phase, where the price moved inside a descending channel and found significant support near the $3,930–$3,950 Buyer Zone. This support zone has proven to be a key reaction level multiple times, with several fake breakouts followed by strong bullish recoveries — confirming the presence of active buyers. After breaking out of the descending channel, the price began forming a higher-low structure, aligning along the Support Line, suggesting that bullish momentum is gradually returning. However, the market remains capped by the Resistance Line, where several strong rejections occurred, indicating that sellers are still defending higher levels. At the moment, Gold is trading between the Buyer Zone and the $4,020–$4,140 Resistance Zone (Seller Zone). If buyers manage to hold support and form another bullish push from the current levels, we could see an upward move targeting the $4,020 area first, and if momentum continues — a potential retest of the key resistance at $4,140. For now, the structure shows accumulation above strong support, suggesting that buyers still have the advantage. Please share this idea with your friends and click Boost 🚀

EURCAD Reveals a Stunning Reversal You Can’t IgnoreHey everyone, Erik here.
EURCAD has been in a strong downtrend, though that bearish momentum is starting to lose its intensity. The market is now shaping what appears to be an inverse head and shoulders pattern, a classic sign that sellers may be running out of strength while buyers are beginning to show interest.
After the right shoulder formed, buyers made a confident move above the neckline, signaling a possible shift in market structure from bearish to bullish. At the moment, I’m watching for a short-term pullback toward the neckline area, a healthy retest that could confirm the strength of this move before any continuation higher.
As long as price holds above that level, the bullish scenario remains valid. The next upside target is around 1.63185, which aligns with the next resistance zone and the projected move derived from the pattern.
This setup is clean, logical, and full of potential. It illustrates how market momentum can shift naturally from exhaustion to recovery, hinting at the early stages of a possible trend reversal.

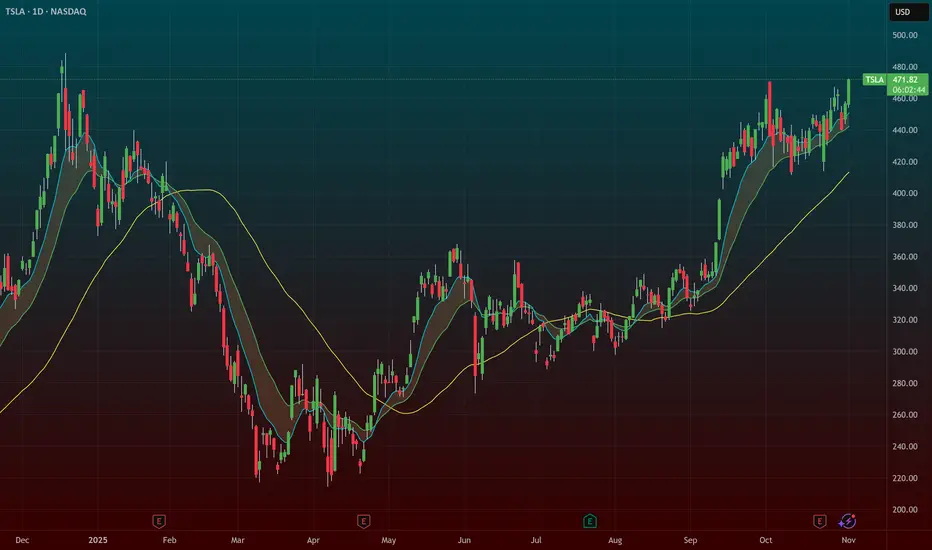
$TSLA – Breakout Setup Targeting ATHs → $500 ZoneTesla ( NASDAQ:TSLA ) looks ready for liftoff. After months of absorbing negative headlines and post-earnings volatility, it’s finally setting up for a major breakout that could take it back to all-time highs — and possibly the $500 level.
🔹 The Setup:
NASDAQ:TSLA has shaken off every piece of bad news — earnings, delivery headlines, margin fears — all absorbed without breaking trend.
The stock is now coiling under major resistance, and the tape is showing accumulation.
The narrative has flipped from “EV slowdown” to autonomous driving and robotics, giving the stock new life.
🔹 Why This Setup Has Juice:
It’s the last major leader yet to make a big move — the rotation setup is real.
Market sentiment is improving, and NASDAQ:TSLA is showing relative strength.
Volume expansion here could mark the start of the next major leg higher.
🔹 My Trade Plan:
1️⃣ Position: Added $500 calls (2 weeks out) at the open this morning.
2️⃣ Stop: If the stock goes under $450, I’m out — keeping risk tight.
3️⃣ Targets: First stop at ATHs, then a potential run toward $500 if momentum holds.
Why I Love This Chart:
The structure is perfect — long base, trendline reclaim, sector rotation lining up.
NASDAQ:TSLA has flipped from “bad news reaction” to “no sell reaction,” a clear sentiment shift.
Risk/reward is ideal here with a tight stop and clear upside roadmap.
Hecla Mining Company - BullishBreakout after 26 year wedge pattern
Plenty of volume too and no retest yet, especially in September 2025.

A Bearish XAUUSD Setup You Can’t Afford to MissOANDA:XAUUSD has dropped sharply, reflecting the complete dominance of sellers who continue to push the market lower with strong bearish momentum.
After the decline, the price paused and then began to rise slowly, forming a familiar wedge pattern, a classic signal of trend continuation. Buyers attempted to regain control, but the buying pressure was weak, and every rally was quickly met with renewed selling.
Eventually, the price broke below the pattern with significant pressure and is now retesting the breakout area. This confirms that the market remains bearish, with limited chances of a meaningful reversal. If the price continues to break below this zone, further declines are likely to follow.
I anticipate the next bearish wave could reach around 3,885, aligning with the broader downtrend.
This analysis is for educational purposes only and does not constitute trading advice or financial recommendation.

USD/JPY: Setup Screams Buying Opportunity—Are You Watching?The USDJPY pair may continue to ascend following a test of a robust support cluster, which consists of a horizontal range and a rising trend line on the daily chart.
Subsequent to the test of this support cluster, we observed a positive bullish reaction, accompanied by a bullish Change of Character on a 4-hour timeframe, indicating significant buying interest
Our target is 155.00.

Buy Cholamandalam Investment & Finance above 1707Buy above 1707.
Stop-loss: 1640.
Targets: 1745 / 1791.

Oberoi Realty Limited chart analysis: BUY SetupEntry: ₹1,687-1,695 (Current Level)
Target 1: ₹1,722-1,725
Target 2: ₹1,754-1,760
Target 3: ₹1,800+ (Extended)
Stop Loss: ₹1,650
Technical Rationale:
Massive bullish momentum with +5.35% surge today
Strong breakout from consolidation zone (1,600-1,690)
Huge volume spike (2.61M) - highest in recent months
RSI spiking above 60, indicating strong bullish momentum
Price breaking above long-term resistance at 1,680
Gap-up opening showing institutional interest
Real estate sector showing strength
Clear resistance levels at 1,722 and 1,754
Risk-Reward: Favorable 1:2.5+ ratio
Strategy: Momentum play - Book partial at Target 1 (1,722), trail SL to 1,670 at Target 2. Hold remaining for extended targets
Caution: Watch for profit booking after such strong rally. Avoid chasing if price goes significantly above 1,700

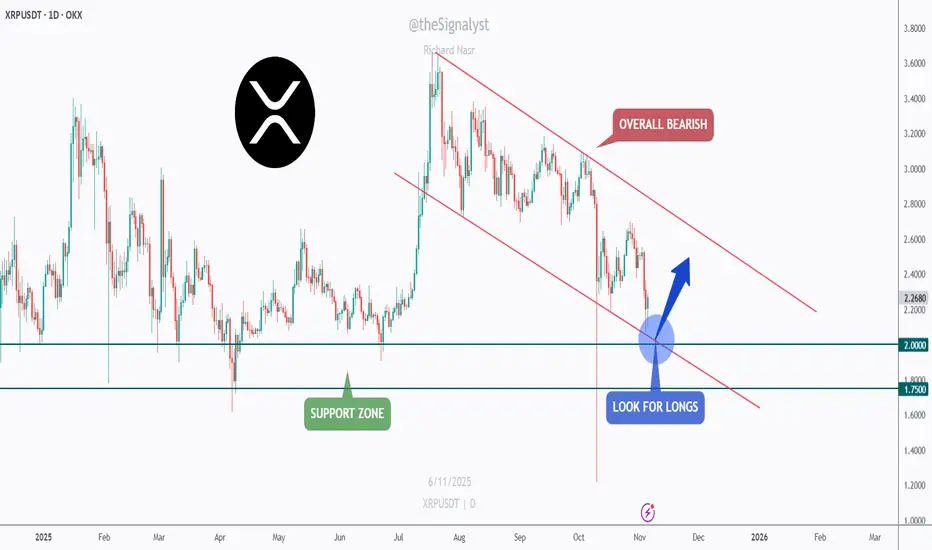
XRP - Watching the Confluence Zone for a Bullish Rebound!📉XRP has been in a clear bearish channel for months , forming consistent lower highs and lower lows.
However, the current structure is approaching a critical confluence zone, where the lower bound of the red channel meets the major green support area between $1.75 and $2.00.
⚔️As long as this intersection holds, I’ll be looking for potential long opportunities, anticipating a short-term bullish correction toward the upper boundary of the channel.
This setup offers a clean risk-to-reward opportunity if the bulls manage to defend the zone and regain momentum.
If the support gives way, further downside could follow, but for now, this area remains a key decision point for XRP’s next move.
⚠️ Disclaimer: This is not financial advice. Always do your own research and manage risk properly.
📊All Strategies Are Good; If Managed Properly!
~Richard Nasr
HTZ:From Breakdown to Breakout,Bullish Reversal Gaining TractionHertz Global Holdings, Inc. (NASDAQ: HTZ)
Technical Outlook: Potential Reversal Following Structural Breakout
Date : 5 November 2025
Summary
Hertz Global Holdings (HTZ) has exhibited signs of a potential medium-term trend reversal following a prolonged downtrend since mid-2023. Multiple bullish technical signals — including a breakout from key continuation patterns, RSI divergence, and sustained support retests — point toward a possible shift in market sentiment.
Price Action and Technical Developments
1. Downtrend continuation : Since July 2023, HTZ has been in a persistent downtrend, reinforced by a breakdown below major horizontal support.
2. Symmetrical triangle breakdown (Feb 2024) : The stock failed to hold within a consolidation structure, confirming bearish momentum at that stage.
3. Bullish divergence (Sept 2024) : Despite registering new price lows, the RSI formed higher highs, suggesting weakening downside momentum and potential for reversal.
4. Falling wedge breakout (Nov 2024) : Price action reversed from a classic bullish pattern, followed by a strong rally through the end of November.
5. Symmetrical triangle breakout (Apr 2025) : HTZ broke out of consolidation on elevated volume, coinciding with a break above the long-term descending trendline — a key technical inflection point.
6. Current setup (Nov 2025) : The share price is consolidating within a falling channel. On 4 November 2025, it rebounded from a confluence of supports — including the uptrend line from September 2024 and prior resistance turned support — reinforcing near-term bullish bias.
Trading Idea
Entry Zone: 4.71 - 5.50
Target: 10.50 and 15.00
Support: 4.71
Conclusion
After a long downtrend, HTZ is showing a clear shift in momentum. With multiple bullish patterns confirmed and strong support holding, the stock may be entering a new uptrend phase toward USD 10.50 and USD 15.00.

XAUUSD Long: Demand Line Supporting Move Toward $4,080 TargetHello traders! Gold (XAUUSD) continues to show resilience as price action holds above the key $3,950 Demand Zone, signaling that buyers are still defending this area effectively. After forming a Double Top pattern near the $4,150 Resistance, the market entered a correction phase, which was guided by a clean break below the neckline, followed by a retracement defined by the Fibonacci Arc. This retracement created a series of Pivot Points that now serve as short-term references for buyers and sellers. The price has since found solid support along the Demand Line, aligning with the overall ascending Trend Line that has held firm since early October. Each rejection from this zone has been met with renewed buying pressure, suggesting that the current move could represent a continuation phase within the larger bullish structure.
Currently, gold is trading around the $4,000 level, consolidating just above its Demand Line. If bullish momentum accelerates from this area, we could see a push toward the $4,080 short-term target, followed by a possible test of the $4,150 major resistance — a critical level for confirming a broader breakout.
My base scenario anticipates a gradual upward move toward $4,080, which aligns with both the trend and key resistance confluence. A clean breakout above $4,150 would open the path for a stronger bullish continuation, potentially toward $4,200+. However, a confirmed breakdown below $3,950 could shift short-term sentiment to bearish, exposing the next support area near $3,900. For now, I maintain a bullish bias, expecting further upside momentum as long as the demand structure holds firm. Manage your risk.

EURUSD: Rebound Phase Developing From 1.1510 Support ZoneHello everyone, here is my breakdown of the current Euro setup.
Market Analysis
EURUSD has been forming a complex market structure, transitioning through several distinct phases. Initially, the pair traded within a Range Zone, showing indecision between buyers and sellers. A strong bullish breakout from the range led to the creation of an Upward Channel, where buyers maintained momentum until the price reached the 1.1660 Resistance Zone. This level acted as a significant supply area, resulting in multiple rejection points and eventually a bearish breakout from the channel.
Recently, EURUSD began consolidating in a Descending Triangle Pattern, with the Triangle Resistance Line serving as a dynamic barrier against bullish attempts and the Triangle Support Line acting as a demand zone. Currently, the pair is testing this support zone around 1.1500–1.1480, which has already provided several short-term rebounds. A clear break below this area could confirm a continuation of the bearish structure, potentially pushing price lower toward 1.1450 and even 1.1400. On the other hand, a rebound from the support line with strong bullish momentum could signal the beginning of a reversal move, targeting the resistance levels at 1.1530–1.1540.
My Scenario & Strategy
From my perspective, EURUSD sits at a pivotal technical point. If the Triangle Support Line continues to hold, I expect a bullish breakout attempt above the triangle’s resistance, confirming a possible trend reversal toward higher levels. Short-term traders could look for long entries near the 1.1500 support zone with tight stop-losses below 1.1480, aiming for a retest of 1.1530–1.1540. However, if the pair breaks and closes below 1.1480, it would invalidate the bullish scenario and likely trigger renewed selling pressure toward 1.1450–1.1400. For now, I remain cautiously bullish, expecting a potential rebound from the support base before a decisive move unfolds.
That's the setup I'm tracking. Thank you for your attention, and always manage your risk.

XAUUSD: Bulls Defend Channel Support, Eyeing $4,130 ReboundHello everyone, here is my breakdown of the current Gold setup.
Market Analysis
Gold (XAUUSD) continues to trade within a well-defined upward channel, showing a clear structure of higher highs and higher lows. After a series of breakouts and retests, the price recently tested the channel support and the key demand zone around $3,900–3,920, confirming buyers’ activity in that area.
Currently, previous fake breakout above the $4,130 resistance area led to a pullback, but the market is now stabilizing and showing early signs of bullish momentum. This zone aligns with both the lower boundary of the ascending channel and a horizontal support area — a technically strong confluence that often attracts long positions.
My Scenario & Strategy
The current setup suggests that as long as the $3,900 support holds, gold remains in a bullish structure. A confirmed bounce from the lower channel boundary would likely trigger a new impulsive move toward the $4,130 resistance zone, which is also the previous breakout area. If buyers manage to break and hold above that resistance, the next potential upside target is around $4,200–$4,250, aligning with the upper boundary of the channel.
My strategy here is to look for bullish confirmation signals (candlestick patterns or volume breakout) near the support zone and aim for long entries with targets toward $4,130 and higher. A daily close below $3,880 would invalidate this scenario and open the door for a deeper correction.
That's the setup I'm tracking. Thank you for your attention, and always manage your risk.

EUR/CAD: Bullish Outlook📈EURCAD formed a significant inverted head and shoulders pattern on a 4-hour timeframe.
The neckline for this pattern is identified between 1.6226 and 1.6210.
Should the price successfully break and close above this neckline, it would indicate a strong bullish signal.
In such a scenario, the market could potentially advance towards the 1.6560 level.
Please note that the neckline currently acts as a robust demand area. Shorting opportunities should only be considered after a confirmed breakout of this level.
