XAUUSD Holds Bullish Structure - Resistance at $4,380 in FocusHello traders! Here’s my technical outlook on XAUUSD (Gold) based on the current chart structure. After a corrective phase, Gold established a solid base and transitioned into a bullish recovery, forming higher lows and respecting the rising Support Line. The price previously moved through a consolidation Range, where accumulation took place before a clear breakout confirmed renewed buying momentum. Following this breakout, XAUUSD continued to trade within an ascending channel, showing a well-structured bullish trend. Recently, price pulled back into the Buyer Zone around 4,280, which aligns with the horizontal Support Level and the lower boundary of the rising structure. Buyers successfully defended this area, keeping the bullish structure intact. From this support, Gold has started to rebound and is now pressing higher toward the Seller Zone / Resistance Level near 4,380 (TP1) — a key supply area where sellers may attempt to slow the move. As long as XAUUSD holds above the 4,280 Support, the bullish scenario remains valid. I expect continued upside pressure toward the 4,380 Resistance (TP1). A clean breakout and acceptance above this seller zone would open the path for further bullish continuation. However, rejection from resistance could lead to a short-term consolidation or a healthy pullback back toward support. For now, the structure favors buyers, with 4,280 as key support and 4,380 as the main upside target. Always manage your risk and trade with confirmation. Please share this idea with your friends and click Boost 🚀
Breakout!

What Is the Bull Side – and What Is the Bear Side?In trading, there are concepts that everyone has heard of , but not everyone truly understands correctly . “ Bull side ” and “ Bear side ” are two such terms. Many traders use them every day, yet often assign them overly simplistic meanings: bulls mean buying, bears mean selling.
In reality, behind these two concepts lies how the market operates , how capital flows think , and how traders choose which side to stand on .
What Is the Bull Side?
The Bull side (bulls) represents those who expect prices to rise . However, bulls are not simply about buying .
The true essence of the bull side is the belief that the current price is lower than its future value , and that the market has enough momentum to continue moving upward .
The bull side typically appears when:
Price structure shows that an uptrend is being maintained
Active buying pressure controls pullbacks
The market reacts positively to news or fresh capital inflows
More importantly, strong bulls do not need price to rise quickly . What they need is a structured advance , with healthy pauses and clear support levels to continue higher.
What Is the Bear Side?
The Bear side (bears) represents those who expect prices to fall . Like bulls, bears are not merely about selling .
The core of the bear side is the belief that the current price is higher than its true value , and that selling pressure will gradually take control .
The bear side tends to strengthen when:
An uptrend begins to weaken or breaks down
Price no longer responds positively to good news
Every rally is met with clear selling pressure
A market dominated by bears does not always collapse sharply . Sometimes, it shows up as weak rebounds , slow and extended , but unable to travel far .
When Does the Market Lean Toward Bulls or Bears?
The market is never fixed to one side . It is constantly shifting .
There are periods when bulls are in control , times when bears dominate , and moments when neither side is truly strong .
Professional traders do not try to predict which side is right . Instead, they observe:
Which side controls the main move
Which side is reacting more weakly over time
What price is respecting more: support or resistance
These price reactions reveal who is in control , not personal opinions or emotions.
Common Mistakes When Talking About Bulls and Bears
Many traders believe they must “ choose a side ” and remain loyal to it . In reality, the market does not require loyalty .
The market only demands adaptation .
Today’s bulls can become tomorrow’s bears .
A skilled trader is someone who is willing to change perspective when the data changes , rather than defending an outdated view .

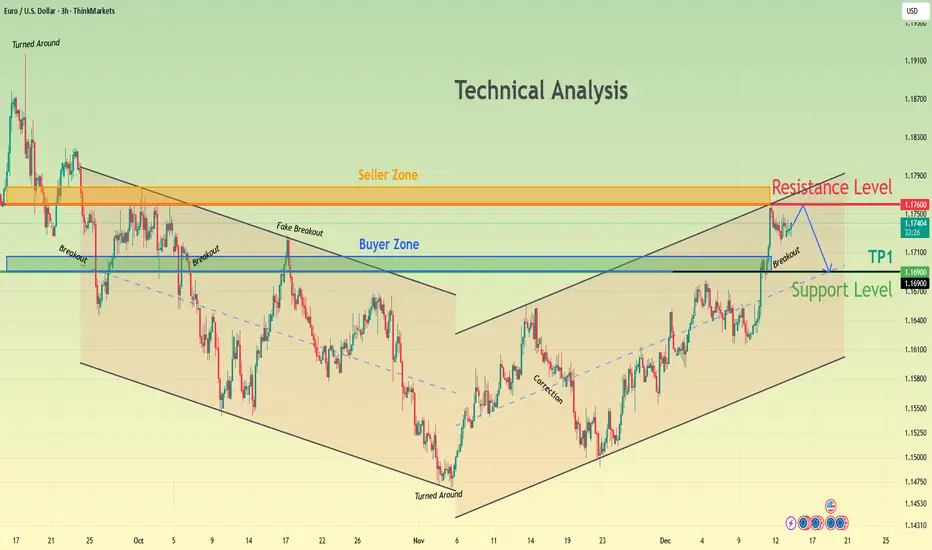
EURUSD Market UpdateHello, it’s a pleasure to discuss FX:EURUSD with you.
The EUR/USD pair remains stable today after two days of mild declines, trading around 1.1740 at the time of writing.
From a technical perspective, the bullish momentum is strengthening as price continues to hold above the ascending trendline. The immediate resistance is seen at 1.176, followed by the key level at 1.1800.
I remain optimistic about EURUSD—what’s your view?

EURUSD Potential Continuation from Key OrderblockQuick Summary
EURUSD is expected to push higher into the orderblock around 1.17395 This zone may act as a strong resistance area to resume the bearish move The presence of inducement before the orderblock increases the probability of a rejection with downside continuation targeting 1.17029
Full Analysis
EURUSD is currently showing a corrective move to the upside within a broader bearish context Price is expected to continue this retracement toward the orderblock located around 1.17395 This area represents a high probability zone where selling pressure may re-enter the market
What strengthens this scenario is the presence of inducement just before the orderblock This suggests that price may be driven higher to attract late buyers before reacting from the orderblock and to hit Stop loss for sellers
If price reaches the 1.17395 and shows a clear rejection or bearish confirmation this would support the idea of trend continuation to the downside In that case the next logical target would be the previous low at 1.17029 where liquidity is resting

EURUSD Long: 1.1700 Demand Zone Holds the Key to a 1.1760 RetestHello traders! Here’s a clear technical breakdown of EURUSD based on the current chart structure. EURUSD remains within a well-defined ascending channel, forming consistent higher highs and higher lows from the pivot point — a clear sign that the broader structure is still bullish. After the impulsive move higher, price reached the 1.1760 Supply Zone, where temporary rejection and a fake breakout occurred. This reaction signaled short-term profit-taking rather than a structural reversal.
Currently, following the rejection, price pulled back into the 1.1700 Demand Zone, which aligns with the previous breakout level and the mid-range of the ascending channel. This pullback appears corrective, not impulsive, suggesting buyers are absorbing supply and defending structure. The market is now stabilizing above demand, indicating renewed buying interest.
My scenario: as long as EURUSD holds above the 1.1700 Demand Zone, the bullish structure remains intact. A strong reaction from this area could trigger the next impulsive leg toward the 1.1760 Resistance / Supply Zone. A clean breakout and acceptance above 1.1760 would confirm trend continuation and open the path for further upside. Only a decisive breakdown below demand would invalidate the long scenario. For now, the bias favors buyers while price respects the ascending channel. Manage your risk.

XAUUSD Long: Trend Line Holds - Buyers Aim for $4,350Hello, traders! Gold (XAUUSD) is trading within a well-defined bullish structure, supported by an ascending channel that started from the pivot point near the trend line. After forming higher lows, price entered a consolidation Range, indicating temporary balance between buyers and sellers. This range acted as an accumulation phase before the next impulsive move.
Currently, a clean breakout above the Range high occurred around the 4,260 Demand Zone, confirming renewed buying pressure. This level is now acting as a key support area, aligned with the rising Trend Line, strengthening its importance. Following the breakout, price accelerated upward and is currently trading below the major 4,350 Supply Zone, where sellers have historically shown strong reactions. The recent pullback from the highs appears corrective, not impulsive, suggesting that buyers are still in control as long as price holds above the Demand Zone.
My scenario remains bullish while XAUUSD holds above the 4,260 Demand Zone and the rising Trend Line. If buyers continue to defend this area, I expect another push toward the 4,350 Supply, which remains the primary upside target. A confirmed breakout above 4,350 would open the path for further bullish continuation. However, a failure to hold the Demand Zone could trigger a deeper pullback toward the Trend Line, while still keeping the broader bullish structure intact. For now, the market favors buyers, with 4,260 as key support and 4,350 as the main resistance to watch. Manage your risk!

BTCUSDT: Sellers Defend Resistance - Support Zone at $85,200Hello everyone, here is my breakdown of the current BTCUSDT setup.
Market Analysis
BTCUSDT previously moved inside a clear downward channel, confirming strong bearish pressure. After reaching the lower boundary, price produced a temporary bounce and broke above the channel, but this move failed to develop into a sustainable bullish trend. Instead, BTC entered a consolidation range below the key 88,000 Resistance Zone, showing clear hesitation from buyers. Following the range formation, price developed a descending triangle structure, with lower highs forming along the Triangle Resistance Line and support being tested near the 85,200 Support Zone. Multiple fake breakouts above resistance and below support indicate liquidity grabs rather than true reversals. Recent price action shows rejection from the Resistance Zone and a failure to reclaim the upper range, suggesting seller dominance is returning.
Currently, BTCUSDT is trading below the 88,000 Resistance Zone and remains capped under the Triangle Resistance Line, keeping bearish pressure intact.
My Scenario & Strategy
My scenario is short-biased as long as BTCUSDT stays below the 88,000 Resistance Zone and the Triangle Resistance Line. I expect price to continue drifting lower toward the Triangle Support Line, with a primary target at the 85,200 Support Zone. A confirmed breakdown below this support would signal continuation of the bearish trend and open the path for deeper downside.
However, if price instead breaks and holds above 88,000 with strong momentum, the short scenario would be invalidated. Until that happens, rallies into resistance are viewed as selling opportunities.
That’s the setup I’m watching. Trade carefully and always manage your risk.

BTCUSD Holds Triangle Support - Bounce Toward 88,500 ExpectedHello traders! Here’s my technical outlook on BTC/USD based on the current chart structure. After a prolonged bearish move inside a downward channel, Bitcoin found a base near the lower boundary and reversed sharply, signaling seller exhaustion and a shift in momentum. This reversal was followed by a breakout above the descending resistance, confirming the end of the bearish phase. Price then entered a consolidation range, where accumulation took place before a confirmed breakout pushed BTC higher. Following the range breakout, the market formed a triangle structure, with price respecting the Triangle Support Line while facing pressure from the Triangle Resistance Line. Recently, BTC revisited the Buyer Zone around 86,300–85,500, which aligns with both horizontal support and the lower triangle boundary. Buyers stepped in at this level, defending the structure and keeping the recovery scenario intact. Currently, BTC is attempting a rebound from the Buyer Zone and is aiming toward the 88,500 Resistance Level (TP1). As long as price holds above the support zone, a move toward this resistance remains likely. A clean breakout above 88,500 would confirm further upside continuation, while rejection could lead to another consolidation or retest of support. For now, the structure favors buyers, with 86,300–85,500 as key support and 88,500 as the main upside target. Please share this idea with your friends and click Boost 🚀

Gold - Pullback or Reload Before the Next Push?📈 Gold remains overall bullish , trading within a well-defined ascending structure.
Price is now approaching a high-confluence area, where the demand zone aligns perfectly with the lower red trendline. This intersection is critical, as it represents a classic trend-following buy zone within a healthy uptrend.
⚔️As long as this zone holds, we will be looking for bullish reactions and continuation setups, aiming for a move back toward the upper side of the channel and the previous highs.
A clean rejection from this level would confirm buyers are still in control.
A decisive breakdown below it would invalidate this bullish scenario.
Is Gold setting up for another trend continuation, or will it surprise the crowd? 🤔👇
⚠️ Disclaimer: This is not financial advice. Always do your own research and manage risk properly.
📚 Stick to your trading plan regarding entries, risk, and management.
Good luck! 🍀
All Strategies Are Good; If Managed Properly!
~Richard Nasr

NML (PSX) – Bullish Setup on 4H Chart📈 Nishat Mills (NML) – 4H Bullish Reversal Setup with Multi-High Divergence
📍 Entry Zone: 148.96 – 150.75
🛑 Stop Loss: Below 140.93
🎯 Targets: TP1 @ 156 | TP2 @ 164 | TP3 @ 172+
✅ Key Trigger: Bullish RSI Divergence + Higher Lows (LL) forming after sharp decline
✅ Confirmation: Price reclaiming key trendline & breaking descending structure
✅ Risk-Reward: > 1:3 (Conservative entry near support)
Disclaimer:
*This idea is for educational and research purposes only, based on technical patterns. It is not investment advice. Always conduct your own analysis (DYOR) and manage your risk carefully before entering any trade.*

AUUSD → Buyers Defend Structure, Upside Continuation in FocusHello everyone,
Gold is continuing to trade with a constructive tone, and the current structure suggests the bullish trend remains intact. From a macro perspective, the U.S. dollar has softened slightly while Treasury yields have stabilized , reducing downside pressure on non-yielding assets like gold. In an environment where investors remain cautious but not risk-off, gold continues to benefit from its role as both a hedge and a momentum asset .
From a technical standpoint on the H1 chart, price action is clearly supportive of further upside . Gold broke out of a bullish flag pattern after a strong impulsive move , then successfully respected the rising trendline on the pullback . This behavior signals healthy consolidation rather than weakness , with buyers stepping in at higher levels and maintaining control of the broader move.
As long as price holds above the trendline support, the bullish structure remains valid . A continuation above recent highs would open the door toward the 4,385 area, with extension potential toward 4,458 if momentum accelerates. Only a decisive break below the trendline would call for reassessing this bullish outlook .
In summary, XAUUSD is showing a well-organized uptrend supported by both structure and sentiment . Patience and discipline remain key, as the market appears to be positioning for the next leg higher rather than signaling exhaustion .
Wishing you clear judgment, disciplined risk management, and sustainable trading performance.

Gold Enters Controlled Consolidation Within a Bullish StructureGold is no longer advancing in an accelerated manner, but is instead entering a phase of controlled consolidation . This is a natural response following a clear impulsive move, as the market needs time to rebalance supply and demand. Despite a cautious overall sentiment amid mixed macro conditions, capital flows continue to maintain exposure to gold.
On the H1 timeframe , the technical structure continues to support the bullish bias. Price is rotating within a narrow range, with higher lows being preserved , indicating that selling pressure is not aggressive and is largely driven by short-term profit-taking. This suggests that buyers remain in control of the primary move .
Current price action reflects a supply absorption phase . If the upper resistance zone is absorbed and price achieves a clear and decisive close above it , the bullish trend will be reaffirmed, opening the path toward the 4,385 area . Conversely, further sideways movement should not be viewed as a negative signal; a well-formed consolidation base often precedes a more sustainable advance. Only a decisive break below support would require reassessing the bullish scenario.

XAUUSD – Buyers Remain in ControlHello everyone, it’s great to see you again.
Today, the gold market continues to test the new support area around USD 4,300 per ounce and is attracting mild bullish momentum as the U.S. labor market remains relatively stable but shows early signs of slowing. Bearish sentiment toward the U.S. dollar, driven by the Federal Reserve’s accommodative monetary policy, combined with ongoing risk-off sentiment, is providing positive support for the precious metal.
At the time of writing, gold is up around USD 20 from the session low. In the short term, OANDA:XAUUSD maintains a mild bullish trend, with key support levels located at USD 4,270 and USD 4,300.
I remain optimistic in this analysis, with the first upside target at the USD 4,350 resistance level, followed by a potential push toward the record zone around USD 4,375.
And you - what’s your view on gold at this stage?

Bitcoin (BTCUSD) — Base Forming Ahead of a Bullish BreakoutBitcoin is approaching a critical moment . After a prolonged decline downside momentum has clearly slowed and price is beginning to stabilize , which is a common sign that selling pressure is being gradually absorbed . On the macro side market sentiment has improved slightly as investors grow more comfortable with expectations of easier financial conditions ahead , giving risk assets some room to recover.
On the H1 chart , the technical picture is turning constructive . BTC is forming a double bottom within a descending structure , showing strong buyer participation around the same support zone . At the same time price is pressing against the descending trendline , suggesting that seller control is weakening . This combination typically appears near transition phases rather than during strong bearish continuation.
The key now is confirmation . A clean breakout and close above the descending trendline would activate the double bottom target near 90000 , signaling a shift from corrective price action into a new bullish phase . Until that breakout occurs patience remains essential , but the technical risk to reward is starting to favor the upside .

AUDUSD FREE SIGNAL|SHORT|
✅AUDUSD strong bearish displacement confirms an ICT breakout below the prior supply level. Price fixed below the zone now, signaling a market structure shift with sell-side liquidity likely to be targeted next after any minor retracement into discount.
—————————
Entry: 0.6607
Stop Loss: 0.6619
Take Profit: 0.6590
Time Frame: 4H
—————————
SHORT🔥
✅Like and subscribe to never miss a new idea!✅

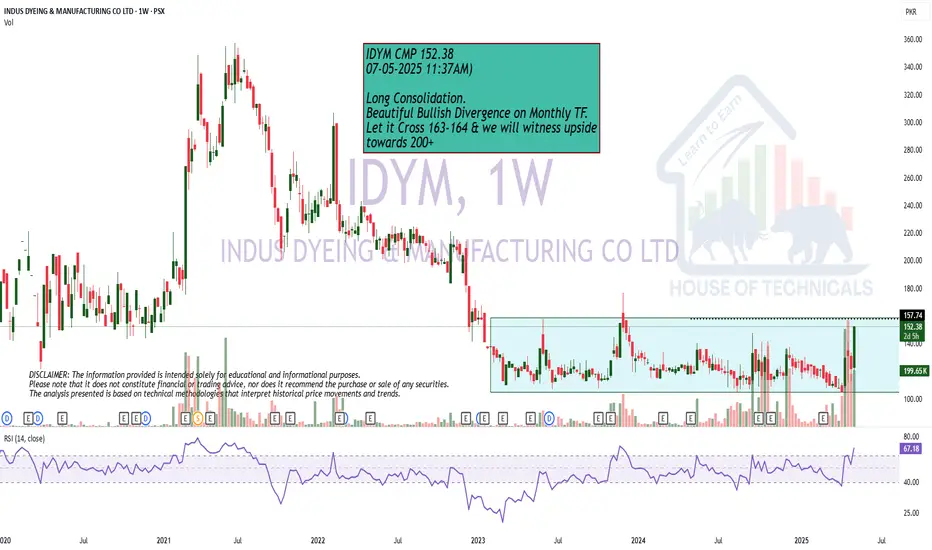
Near BreakoutLong Consolidation.
Beautiful Bullish Divergence on Monthly TF.
Let it Cross 163-164 & we will witness upside
towards 200+
GOLD STRONG BULISH BIAS|LONG|
✅XAUUSD Price is compressing inside a bullish triangle after respecting ascending ICT structure. Liquidity is building below equal lows while buy-side rests above the supply. A clean breakout and displacement above the range opens the path for bullish continuation toward premium targets. Time Frame 2H.
LONG🚀
✅Like and subscribe to never miss a new idea!✅

AUD-NZD Bearish Breakout! Sell!
Hello,Traders!
AUDNZD break of the rising trendline confirms bearish BOS, with supply holding firm above. Price shows weak demand reaction, suggesting a corrective pullback targeting sell-side liquidity below recent lows. Time Frame 8H.
Sell!
Comment and subscribe to help us grow!
Check out other forecasts below too!
Disclosure: I am part of Trade Nation's Influencer program and receive a monthly fee for using their TradingView charts in my analysis.

BTCUSDT Long: Demand Support Fuels Push Toward $92,500Hello, traders! BTCUSDT previously traded within a well-defined Descending Channel, confirming strong bearish pressure and controlled sell-side momentum. Price consistently respected the channel boundaries, producing lower highs and lower lows until a decisive breakdown occurred near the lower channel edge. After this breakdown, Bitcoin reached a clear Pivot Point, where sellers began to lose control and buyers stepped in aggressively. This reaction marked the end of the bearish impulse and initiated a structural shift. From this pivot low, price started forming higher lows, signaling the emergence of demand and the beginning of a recovery phase.
Currently, BTC broke above local resistance and entered a Range phase, where price consolidated between the 88,000 Demand Zone and the 92,500 Supply Zone. Multiple breakout attempts occurred inside this range, confirming active participation from both buyers and sellers. However, each dip toward the demand area was quickly absorbed, showing strong buyer interest and defense of the lower boundary. A rising Demand Line formed beneath price, reinforcing bullish pressure and supporting higher lows within the range. This structure indicates accumulation rather than distribution, suggesting preparation for a directional move.
My primary scenario is bullish as long as BTCUSDT holds above the 88,000 Demand Zone and continues respecting the ascending demand line. The recent pullback into demand appears corrective rather than impulsive, favoring continuation to the upside. I expect price to push back toward the 92,500 Resistance, which represents the upper boundary of the range and a key decision level. A clean breakout and acceptance above 92,500 would confirm bullish continuation and open the path for further upside expansion. Manage your risk!

How to Use VWAP in Confluence with StructureVWAP is one of the few indicators that consistently adds value when used correctly. It does not predict direction and it does not replace market structure, but it provides a powerful reference point for where fair value sits within the current session or trend.
When combined with structural analysis, VWAP helps you filter trades, improve timing, and avoid impulsive entries that fight the underlying flow.
The first step is understanding what VWAP represents. It shows the average price weighted by volume, reflecting where most transactions have occurred. When price trades above VWAP, it signals that buyers are in control of the session.
When price trades below it, sellers dominate. This context becomes meaningful only when it aligns with the higher timeframe structure.
Start by establishing your bias through market structure.
If the higher timeframe is in an uptrend and price trades within a discount zone, VWAP becomes a dynamic confirmation tool. A reclaim of VWAP after a liquidity sweep or after a break of structure is one of the cleanest signals that buyers are stepping back in.
The same applies in reverse for downtrends: a VWAP rejection after a pullback into premium strengthens the short bias.
VWAP also adds clarity during intraday consolidation. Ranges often form around VWAP because it reflects the session’s equilibrium. Breakouts that occur away from VWAP without pullbacks frequently lack durability.
However, a breakout followed by a retest of VWAP shows acceptance and builds confidence in continuation. This combination turns a common indicator into a reliable filter rather than a standalone signal.
Another effective use of VWAP is identifying exhaustion. When price aggressively pushes far above or below VWAP, it often signals that the move is extended. This does not mean you fade the trend, but it does mean you tighten expectations and wait for structure to align before entering. Once price reconnects with VWAP and shows intent, the next move becomes more sustainable.
VWAP becomes particularly powerful when paired with session logic. Trading above VWAP in a bullish higher timeframe environment during London or New York sessions often leads to cleaner impulses.
Trading against VWAP during low-volume hours produces far more false signals. Timing, structure, and VWAP together create a cohesive framework.
Used in confluence, not in isolation, VWAP supports disciplined decision-making.
It aligns entries with momentum, filters low-quality setups, and clarifies whether the market accepts or rejects a level. When you combine VWAP with structure, liquidity, and session context, your trades become more intentional, less emotional, and significantly more consistent.
EURUSD: Rejection at Key Resistance - Support Zone at 1.1720Hello everyone, here is my breakdown of the current EURUSD setup.
Market Analysis
EURUSD is trading within a broader bullish structure, but the current price action points to a short-term corrective phase. After establishing an upward channel, price successfully broke above the previous consolidation range, confirming bullish momentum. This breakout pushed the pair higher toward the 1.1770 Resistance Zone, which has historically acted as a strong supply area.
Currently, at this resistance, price has shown hesitation and rejection, indicating that sellers are starting to defend this level. As a result, EURUSD is now pulling back from the highs, moving toward the 1.1720 Support Zone, which aligns with the previous breakout area and the lower boundary of the upward channel. This support zone is critical, as it represents the key demand area sustaining the bullish structure.
My Scenario & Strategy
My scenario is short-term bearish as long as EURUSD remains capped below the 1.1770 Resistance Zone. I expect a controlled pullback toward the 1.1720 Support, where buyers are likely to step in and attempt to defend the trend. A clean breakdown below this support would confirm a deeper correction within the channel.
However, if price holds above the support zone and shows a strong bullish reaction, the broader uptrend remains intact, and another attempt toward the resistance highs may follow. For now, the focus is on the corrective move, with 1.1720 as the key level to watch.
That's the setup I'm tracking. Thank you for your attention, and always manage your risk.

EURUSD Weakens at Seller Zone - Support at 1.1690 Under WatchHello traders! Here’s my technical outlook on EUR/USD based on the current chart structure. After a prolonged bearish move inside a downward channel, EURUSD found a base and reversed from the lower boundary, signaling a loss of bearish momentum. The price then broke above the descending resistance and entered a recovery phase, forming a higher low structure. Following this shift, EURUSD moved into a rising channel, where buyers have been gradually gaining control. Currently, price has pushed into the 1.1760 Resistance Zone (Seller Zone), which previously acted as a strong supply area. The market has already shown signs of rejection from this level, suggesting sellers remain active. Below the current price, the 1.1690–1.1670 Support Level (Buyer Zone) acts as the key demand area and aligns with the lower boundary of the rising structure. As long as EURUSD holds below the resistance, a pullback toward the support zone (TP1) is likely. A deeper correction would still be considered healthy as long as the price remains above structural support. However, a clean breakout and acceptance above 1.1760 could invalidate the short-term bearish pullback scenario and open the way for further upside. For now, the market favors a corrective move, with resistance at 1.1760 and support around 1.1690 as the key levels to watch. Please share this idea with your friends and click Boost 🚀
Ethereum — Bearish structure confirmed amid weak macro sentimentHello everyone,
At the moment, Ethereum is trading within a broader risk-off environment, where defensive sentiment continues to dominate risk assets. Capital flows have yet to show a strong enough return to support a sustainable bullish trend, while investors remain cautious amid macroeconomic uncertainty and overall liquidity conditions. This hesitation has caused recent ETH rebounds to lack follow-through and remain vulnerable to selling pressure.
From a technical perspective , the H4 chart clearly reflects a weakening market structure. After a sharp impulsive move higher, Ethereum failed to maintain expansion and was quickly rejected at higher levels, forming a failed breakout . The return of price below the breakout area signals that buyers were unable to maintain control, allowing sellers to reassert dominance.
The zone around 3,270–3,320 USD now acts as a key resistance area . This region aligns with prior supply and important technical factors, where price has repeatedly faced rejection. As long as the bearish structure remains intact, rallies into this area should be viewed as trend-aligned SELL opportunities , rather than early signs of a bullish reversal.
On the downside, the 3,070–3,000 USD region represents the nearest support target. While this zone has previously generated price reactions, within an active downtrend it should be treated primarily as a potential profit-taking area , not a safe BUY zone. Attempting to catch a bottom while the lower-high, lower-low structure remains intact introduces unnecessary risk.
Looking at market behavior , recent recoveries have been characterized by weak momentum, narrow ranges, and a lack of decisive buying participation. This suggests a phase of distribution and rebalancing , rather than accumulation for trend continuation. When the market fails to accept higher prices, the probability of downside continuation outweighs that of an early reversal.
In conclusion , Ethereum remains in a controlled corrective downtrend. With neither the technical structure nor the current news backdrop supporting a bullish scenario, the most prudent approach is to prioritize selling rallies , apply strict risk management, and remain patient until the market delivers clearer signals. In trading, aligning with the dominant trend consistently offers a higher probability edge than attempting to anticipate a bottom.
Wishing you clear judgment, disciplined risk management, and sustainable trading performance.
