AEVO — 230 Days of Accumulation, Breakout AheadAEVO has been consolidating for the past 230 days in what looks like a Wyckoff accumulation between the 100M–150M market cap range. AEVO is now on the verge of breaking its long-term bear trend.
🟢 Long Setup Idea
Entry Zone: $0.13–$0.12
Stop-Loss: Below $0.11
Target: ~$0.35
Key Resistance Levels
Yearly Dynamic VWAP → $0.1384 → current resistance / key S/R zone
Anchored VWAP (Dec 7, 2024 high at $0.6549) → ~$0.17 → key resistance in confluence with the key highs → A clean break above this = bullish
150M Market Cap → $0.164 → major breakout level
Once cleared, significant upside potential opens up.
Higher Timeframe Targets
$0.35 Zone → Primary long target (POC of the 2024 trading range, yearly Open at $0.3614, 0.5 Fib retracement of the downtrend at $0.359)
$0.43 Zone → 0.618 Fib retracement of the downtrend, in confluence with the 400M market cap
$0.50 Zone → Anchored VWAP resistance + psychological level
$0.53 Zone → 0.786 Fib retracement
$0.55 Zone → 500M market cap resistance
Key Levels
Support → $0.12–$0.13
Resistance → $0.1606–$0.17 → $0.35 → $0.43–$0.55
🔍 Indicators used
DriftLine — Pivot Open Zones → For identifying key yearly/monthly/weekly/daily opens that act as major S/R reference points
➡️ Available for free. You can find it on my profile under “Scripts” and apply it directly to your charts for extra confluence when planning your trades.
_________________________________
💬 If you found this helpful, drop a like and comment!
Breakout!

EURAUD: Counter-Trend TradeNot my conventional signal as this one is looking to trade in the opposite of the trend.
Daily Timeframe:
EMA20 is barely below EMA60 > downside momentum might pick up
Price is barely crossing below EMA20 > another indication of downside momentum
Price crossed below ATL, pulled back, and now seems to be continuing lower
H1 Timeframe:
Price crosses below ATL > first indication of uptrend failing to continue
Note that EMA20 is above EMA60 still > there is a risk that this will trap sellers

XAUUSD Long: Path to $3715 After Successful RetestHello, traders! The price auction for XAUUSD has been developing within a well-defined upward wedge for some time. This bullish structure has guided the price higher through a series of higher highs and higher lows, with the demand zone 2 at 3575 acting as a key pivot point low for the formation, establishing the underlying uptrend.
Currently, the auction has reached a critical stage after a strong impulse resulted in a breakout above the key horizontal demand level at 3665. This move shows strong bullish initiative, but such breakouts are often followed by a retest to confirm their validity before the next major leg up.
My scenario for the development of events is based on this breakout being successful. I expect the price to make a corrective pullback to retest the broken 3665 demand level from above. In my opinion, if this former resistance holds as new support, it will be a strong confirmation of the bullish trend. This should trigger a continuation of the rally towards the upper resistance line of the wedge. The take-profit is therefore set at 3715, just below this upper boundary. Manage your risk.

EUR_NZD BULLISH BREAKOUT|LONG|
✅EUR_NZD is going up
Now and the pair made a bullish
Breakout of the key horizontal
Level of 2.0000 and the breakout
Is confirmed so we are bullish
Biased and we will be expecting
A further bullish move up
LONG🚀
✅Like and subscribe to never miss a new idea!✅

ACE ANALYSIS🔮#ACE Analysis 💰💰
#ACE is trading in a symmetrical triangle in a weekly time frame and breakouts with high volume and we could see a bullish momentum in #ACE. Before that we will see little bit retest and then bullish movement
🔖 Current Price: $0.5745
⏳ Target Price: $0.8548
⁉️ What to do?
- We can trade according to the chart and make some profits in #ACE. Keep your eyes on the chart, observe trading volume and stay accustom to market moves.💲💲
#ACE #Cryptocurrency #Pump #DYOR

Archer (ACHR) Bullish Pennant Breakout?I love this chart setup so wanted to share. It has a little bit of everything from market structure, fib levels, pattern recognition, falling wedges.. a bullish backdrop for tech, speculative plays, and the air transportation sector in particular.
Archer's top competitor is $JOBY. They have been performing amazing as of late, experiencing all time highs, even. During the last few months though I have watched NYSE:ACHR closely looking for an opportunity to diversify and buy up some real estate. Now is looking like a decent time to start accumulating for a swing trade in my humble opinion.

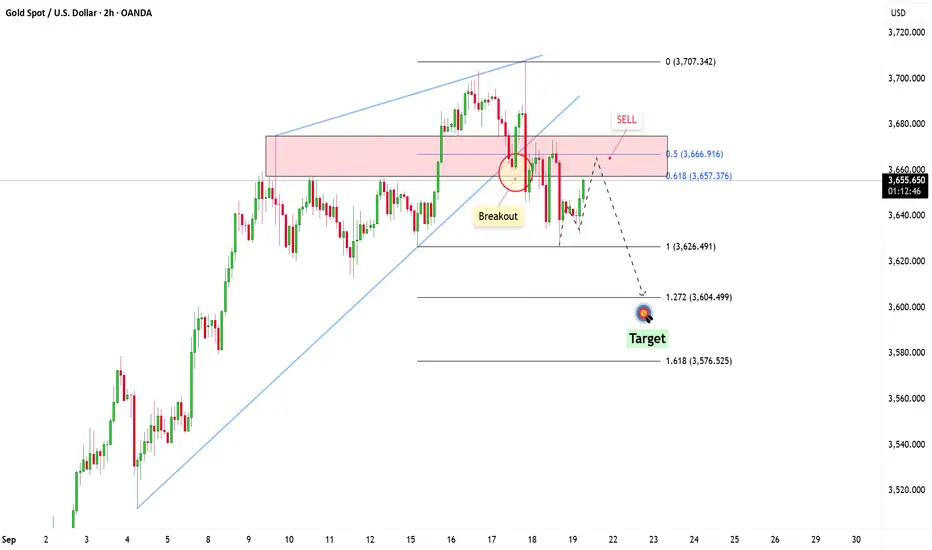
Gold Faces Major Resistance: Is a Sharp Decline Imminent?Hey everyone, looking at XAUUSD today, I noticed something quite interesting. Gold has reached an important resistance level, one that in the past has acted as a strong barrier, pushing the price down. This area has also been a strong supply zone, where sellers have previously taken control of the market. Therefore, it becomes a "hot" spot for those looking for shorting opportunities.
If the price starts showing bearish signals, such as rejection wicks, bearish candlestick patterns, or signs of weakening buying pressure, I think there's a good chance we could see a drop towards 3,604, and possibly even lower to 3,5XX if the selling pressure remains strong. However, if the price breaks this resistance clearly, the bearish outlook might be invalidated, and we could see a further rally.
This is just my personal view on the support and resistance levels, not financial advice. Always double-check your signals and ensure proper risk management.
Good luck with your trades!
EUR_GBP BULLISH BREAKOUT|LONG|
✅EUR_GBP broke the key
Structure level around 0.8710
While trading in an local
Uptrend which makes me bullish
And as the retest of the level
Is complete bullish continuation
Will follow on Monday
LONG🚀
✅Like and subscribe to never miss a new idea!✅

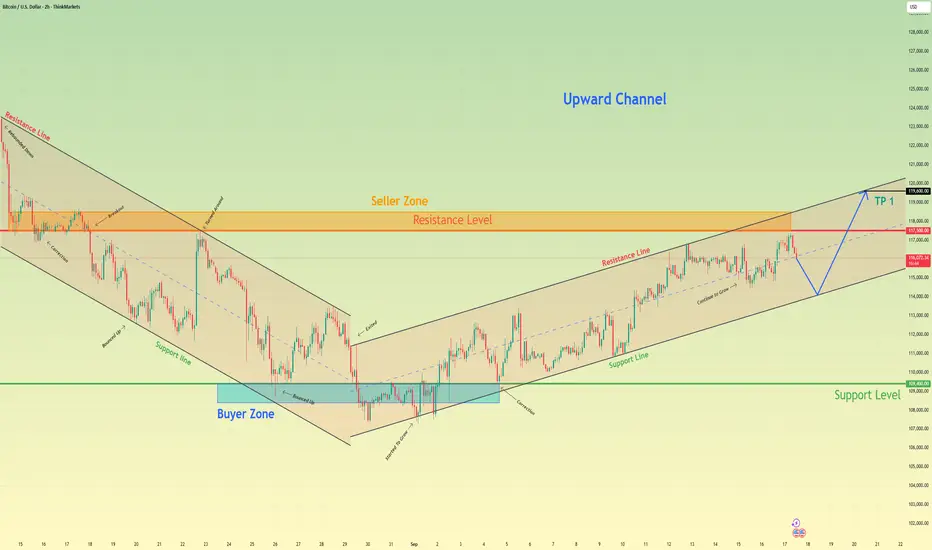
Bitcoin Has Potential to Continue – Don’t Miss Out!Hello everyone, Ken here!
Let’s dive deeper into the current price action of Bitcoin.
As you can see, price is moving within a clear upward channel, signaling strong bullish momentum. After a sharp rise, the price has slightly pulled back to retest the broken resistance. This is a classic break and retest setup within a larger channel, a popular trading pattern I often use.
The key point here is that if this level holds as support, buyer confidence will be further solidified. And we’re already seeing that happen!
With this momentum, I believe 118,850 USDT is the next target, where the price could reverse depending on market reactions at that point.
Wishing you successful trades and a disciplined strategy!

BTCUSD Long: Awaiting Bounce from Channel SupportHello, traders! The prior price auction for BTCUSD was controlled by a downward wedge, which guided the price to the major 110000 DEMAND level. A strong bullish initiative from this demand zone caused a reversal and a breakout from the wedge, establishing the current bullish market structure and shifting control to buyers.
Currently, the price action is being guided by a new ascending channel. The auction has recently pushed up to test the significant horizontal supply at the 117600 level and is now in a corrective pullback phase, heading towards the lower support line of this channel for what I see as a critical test.
My scenario for the development of events is a continuation of this uptrend after the corrective dip completes. I believe the price will find strong support on the ascending demand line of the channel. In my opinion, a successful bounce from this dynamic support will confirm that buyers are still in control, triggering the next impulsive wave higher and breaking the 117600 supply level. The take-profit is therefore set at 120300, targeting the upper resistance line of the channel. Manage your risk!

HBARUSDT: Ready for the Next Bull Run to 0.27430!The HBARUSDT market is looking incredibly bullish! We've just seen a strong shift from a downtrend to an uptrend, creating a perfect opportunity to go long.
The price has broken through a key resistance level, then pulled back to retest it – a textbook breakout & retest setup. This highlights the strength of the bullish momentum.
Now, with the price rejecting that level and turning it into new support, this is a strong long signal with the next target in sight!
My target is 0.27430. Let’s get ready for the next move!

Bitcoin will break resistance level and continue to move upHello traders, I want share with you my opinion about Bitcoin. The market dynamic for Bitcoin has undergone a significant shift, with the prior bearish trend being invalidated by a strong breakout from a downward channel. This reversal has established a new bullish market structure, with the price action for BTC now being methodically guided higher within a well-defined upward channel. This pattern has been confirmed by multiple rotations between its support and resistance boundaries, originating from the 108400 - 109400 buyer zone. Currently, the asset is undergoing a healthy correction after testing the upper part of the channel, and the price is now approaching a critical confluence of support. This area is defined by the ascending support line of the channel and the major horizontal 109400 support level. The primary working hypothesis is a long, trend-continuation scenario, anticipating that buyers will defend this support confluence. A confirmed bounce from this area would signal the end of the correction and the resumption of the primary upward trend. This move is expected to break through the intermediate 117500 resistance level. Therefore, the TP is logically placed at 119600, targeting the upper resistance line of the channel. Please share this idea with your friends and click Boost 🚀
Disclaimer: As part of ThinkMarkets’ Influencer Program, I am sponsored to share and publish their charts in my analysis.
NEAR ANALYSIS🔮 #NEAR Analysis 💰💰
🌟 As we can see that there is a breakout of trendlind in daily time frame. Also #NEAR is trading above major support zone and if #NEAR sustain here then we would see a good bullish move
🔖 Current Price: $3.200
⏳ Target Price: $3.679
⁉️ What to do?
- We have marked some crucial levels in the chart. We can trade according to the chart and make some profits in #NEAR. 🚀💸
#NEAR #Breakout #Cryptocurrency #DYOR

GBP-CAD Bearish Breakout! Sell!
Hello,Traders!
GBP-CAD made a bearish
Breakout of the key horizontal
Level of 1.8740 and the
Breakout is confirmed so
We are bearish biased and
We will be expecting a
Further bearish move down
Sell!
Comment and subscribe to help us grow!
Check out other forecasts below too!
Disclosure: I am part of Trade Nation's Influencer program and receive a monthly fee for using their TradingView charts in my analysis.

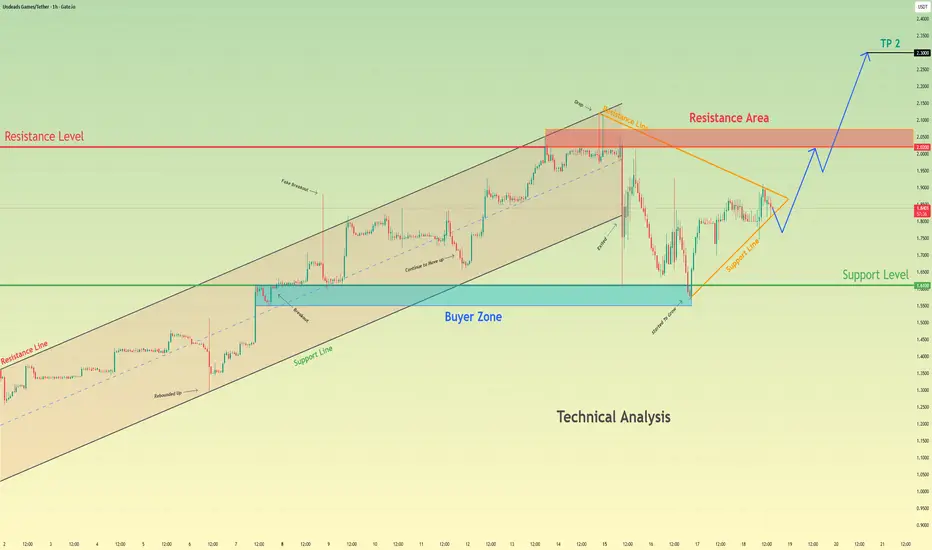
Undeads Games may Be Preparing for its Next Major Move UpHello traders, I want share with you my opinion about Undeads Games. The market for Undeads Games has transitioned from a strong impulsive uptrend into a prolonged corrective phase, setting the stage for its next potential major move. After a rally within an upward channel peaked near the 2.0200 Resistance Level, the price entered a lengthy consolidation, forming a large pennant pattern. This correction guided the price of UDSUSDT back down to the key 1.6100 buyer zone, where it found significant support. Currently, the asset is at a critical inflection point, with the price coiling tightly at the apex of this pennant, signaling that a high-volatility breakout is imminent. The primary working hypothesis is a long scenario, which anticipates a bullish resolution to this consolidation. The expectation is that the price will break out from the top of the pennant and rally towards the major Resistance zone at 2.0200, which serves as TP 1. Following the achievement of this first target, a healthy correction or retest of the broken resistance is anticipated. A successful hold of this level as new support would then provide the foundation for the next impulsive wave higher, with a secondary objective set at TP 2 at the 2.3000 level. Please share this idea with your friends and click Boost 🚀
BITCOIN Bullish Bias! Buy!
Hello,Traders!
BITCOIN is trading in an
Uptrend and the coin broke
The key horizontal level
Of 117k$ so we are
Bullish biased and we
Will be expecting a
Further local move up
Buy!
Comment and subscribe to help us grow!
Check out other forecasts below too!
Disclosure: I am part of Trade Nation's Influencer program and receive a monthly fee for using their TradingView charts in my analysis.

This $PENGU Can Fly
Summary
COINBASE:PENGUUSD has traced a broad 2025 “cup” base, with April setting the low and price now back to the January supply shelf. Price forming a bullish wedge just below all-time highs. As we retest what I call the "blue sky" box, we attempt to resolve a contracting wedge to the upside, printing a fresh daily higher high (HH). While price accepts above local resistance, the path of least resistance is higher with an initial magnet toward the ATH "blue sky" box.
Market Structure and Setup
The higher-timeframe structure is the completed cup + reclaim of the former supply shelf ("blue sky" box). On the daily, the sequence is: retest of the shelf as support → wedge compression → upside break → HH. This multi-timeframe alignment (HTF reclaim + D1 momentum) provides defined risk against the shelf and clear upside reference points (ATH → extensions).
Fibonacci-Based Upside Roadmap
Anchor the swing from the April handle low to the August/September impulse high. The roadmap is:
First waypoint: prior ATH band / 1.00 extension (supply; expect reactions).
Continuations: 1.272 and 1.618 extensions of the April → August leg as conditional targets if ATH is accepted and weekly momentum persists.
These are waypoints, not promises—active only while price holds above the reclaimed shelf.
Microstructure: Acceptance > Expansion
The break produced a HH, but the higher-quality entry often comes from acceptance: a shallow pullback that holds the top of the blue box and forms a D1/4H higher low (HL). That HL becomes the pivot to trail against. If momentum continues without a pullback, treat local range highs as a go-with trigger and manage tightly.
Execution Plan
Setup A – Retest Buy (preferred): Accumulate on a controlled retest into the blue breakout box, then look for a 4H reclaim and higher low to confirm buyers. Invalidation is a daily close back below the shelf or loss of the HL. Distribute into the ATH band first; let a runner work toward 1.272/1.618 if acceptance above ATH materializes.
Setup B – Continuation Buy: If there’s no retest, enter on a clean break-and-hold above the recent HH as a momentum trigger. Invalidation sits under the breakout pivot (last 4H swing). Use smaller size and trail faster given the paid-up entry.
Setup C – Failed-Break Short (contingency/hedge): Engage only if price loses the shelf on a daily close and then rejects on a reclaim attempt from below. Invalidation is re-acceptance back above the shelf. Targets are the cup’s midpoint and the 50–61.8% retrace of the April → August impulse.
Invalidation Criteria
Near-term: a daily close back below the blue shelf = reclaim failed; stand down and wait for fresh structure.
Structural: a weekly close back inside the mid-cup range would negate the completed base and argue for more time/width.
Risk & Sizing
Risk ≤1% per idea; position size = account_risk ÷ (entry→stop). Cut risk further if liquidity is thin or wicks are frequent.
Use reduce-only stops and avoid clustering at obvious lows/highs.
Take 30–50% into ATH supply; trail the remainder beneath 4H HLs or a fast EMA pair (e.g., 8/21) to self-finance the trade.
Fundamental/Flow Linkages
As a high-beta crypto/NFT-adjacent asset, PENGU’s tape is sensitive to broad crypto liquidity, meme-beta flows, and listing/funding dynamics. A trending BTC/ETH backdrop and favorable risk sentiment are supportive; adverse headlines, liquidity air-pockets, or exchange changes can truncate moves abruptly.
Key Risks
Crypto beta: a risk-off impulse in majors typically unwinds alt momentum irrespective of local structure.
Liquidity/venue risk: thinner books can produce stop-hunts and gap moves; listing or market-maker changes can impact spreads.
Narrative fatigue: meme/NFT-linked tokens can overshoot then mean-revert sharply as attention rotates.
Technical failure: acceptance back below the shelf converts today’s support back into resistance and invites a deeper cup-middle retrace.
Conclusion
While PENGU consolidates around ATHs, I want to be long on retests that form higher lows or on clean continuation through range highs. First distribute into the ATH band; if acceptance builds above it, press runners toward the 1.272 → 1.618 roadmap. Lose the shelf on a daily close, and the trade is off until structure rebuilds.
Not financial advice. Levels and sizing should be adapted to your process and constraints.

SOXL 1D — With a base like this, the ride’s worth itOn the daily chart of SOXL, since early March, a textbook inverse head and shoulders pattern has formed and is now in its activation phase. The left shoulder sits at $16.67, the head at $7.21, and the right shoulder at $15.11. The symmetry is classic, with volume stabilization and a narrowing range — all the elements are in place.
The key moment was the breakout through the descending daily trendline around $19.00. Price didn’t just pierce the level — it held above it, signaling a phase shift. There was an attempt to break through the 0.5 Fibonacci level at $19.60, which led to a pullback — not on heavy selling, but on decreasing volume. This wasn’t a rejection, it was a pause.
This pullback serves as a retest of the breakout zone and the 20-day moving average. The overall structure remains bullish: price stays above all key EMAs and MAs, RSI climbs past 60, and the candlestick structure is stable. Volume rises during up moves and fades during pullbacks — classic signs of reaccumulation.
The measured target from the pattern is $32.00, calculated from the head-to-neckline height projected from the breakout point. As long as price holds above $18.40, the setup remains intact. A break above $19.60 with confirmation would open the door to acceleration.
This isn’t a momentum play — it’s a setup months in the making. The structure is there, the confirmation is there, and most importantly — the price behavior makes sense. With a base like this, the ride ahead looks worth taking.

BTCUSD: Price Exit from Triangle and Reach Resistance LevelHello everyone, here is my breakdown of the current Bitcoin setup.
Market Analysis
From a broader perspective, the price of Bitcoin has been consolidating within a wide Range, oscillating between the major Support zone around the 109500 level and the Resistance Zone up to 121200. This lengthy period of balance has now tightened into a more defined triangle pattern, suggesting energy is building.
Currently, the price is coiling within the final stages of this triangle, a classic sign of volatility compression. After a recent test of the upper resistance line, the price is in a corrective pullback, heading towards the ascending support line for what I see as a key test of buyer strength.
My Scenario & Strategy
I'm looking for the price to complete its corrective move and find strong support on the ascending Triangle Support Line. A confirmed bounce from this dynamic support would be the key signal that the next impulsive move up is about to begin, with the goal being a breakout from the top of the triangle.
Therefore, the strategy is to watch for this bounce. A successful rebound that leads to a breakout above the Resistance Zone would validate the long scenario. The primary target for this breakout move is the 120000 Resistance level.
That's the setup I'm tracking. Thank you for your attention, and always manage your risk.

EURUSD: Correction will ContinuesHello everyone, here is my breakdown of the current Euro setup.
Market Analysis
From a broader perspective, we saw a significant bullish impulse on EURUSD after the price broke out of a multi-week upward wedge. This breakout carried the price well above the Support 1 level at 1.1780, culminating in a new local All-Time High before entering a corrective phase.
Following that peak, the market has pulled back and is now consolidating. Currently, it appears that the price is attempting to build support for another move higher, likely to re-challenge the recent highs.
My Scenario & Strategy
My scenario is a bearish one, built on the expectation of a failed retest of the recent ATH. I'm looking for the price to make one more push upwards towards the recent ATH. The key signal for this short idea would be a clear and strong rejection from that high, showing that buyers no longer have the strength to continue the trend.
Therefore, the strategy is to watch for this failure at the highs. A confirmed reversal would validate the short scenario. The primary target for the subsequent decline is the 1.1795 support zone, which aligns with the Support zone 1 area.
That's the setup I'm tracking. Thank you for your attention, and always manage your risk.

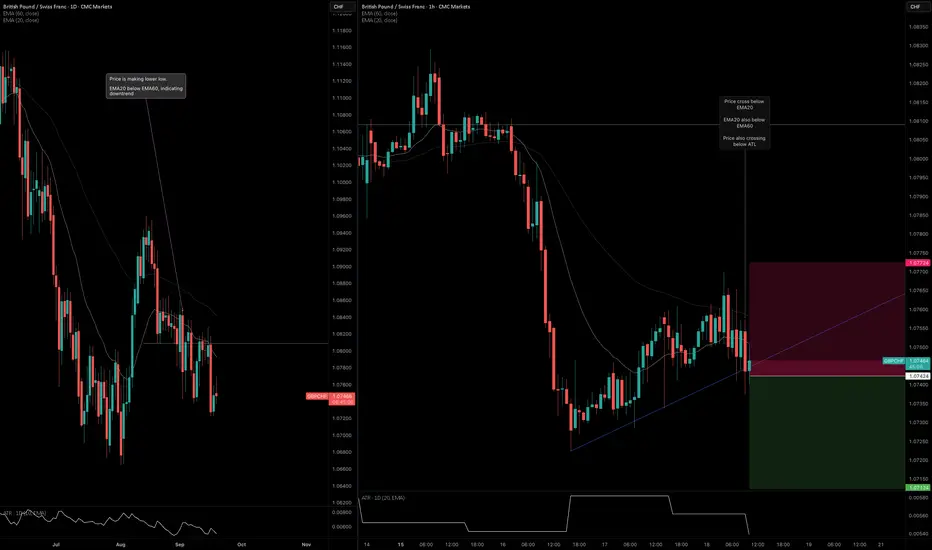
GBPCHF: ATL BreakoutI noticed confluence over on the GBPCHF pair. Here's the breakdown on the daily and H1 timeframes.
Daily Timeframe:
EMA20 is below EMA60 > downtrend structure
Price is also bouncing below EMA20 > confirms downtrend
Price also holding below HTL based on previous end at bearish candle
H1 Timeframe:
Price is exiting the EMA band > momentum has high potential to accelerate lower
EMA20 is below EMA60 and expanding > confluence that momentum is accelerating
OKLO — when nuclear momentum breaks resistanceSince late 2024, OKLO had been consolidating inside a clear rectangle between $17 and $59. The breakout from this long-term range triggered a new bullish impulse. The price has since returned to retest the breakout zone, now aligned with the 0.618 Fibonacci retracement at $51.94. The retest has completed, and the price is bouncing upward, confirming buyer interest.
Technically, the trend remains firmly bullish. The price closed above the prior range, EMAs are aligned below, and the volume spike during breakout supports genuine demand. The volume profile shows a clean path toward $100, indicating limited resistance ahead. The structure suggests a controlled rally rather than an exhausted move.
Fundamentally, OKLO is a next-generation SMR (Small Modular Reactor) company focused on delivering compact, efficient nuclear power solutions. Following its public debut via SPAC and recent capital injection, OKLO is transitioning from development to implementation. Institutional interest is holding strong, and the broader move toward decarbonization and energy independence places the company in a strategic position.
Target levels:
— First target: $100 — psychological and technical resistance
— Second target: $143 — projected from prior range breakout
OKLO isn’t just another clean energy ticker — it’s a quiet disruptor with nuclear potential. The chart broke out. The volume confirmed. Now it’s time to see if the market follows through.

EURUSD Long: Correction Before Impulse UpHello, traders! A large upward wedge pattern has defined the price auction for EURUSD. This bullish structure has been formed by a series of higher highs and higher lows, with key pivot points establishing the diverging supply and demand lines. The auction has been rotating between the demand zone 2 and the supply zone near the 1.1780 level.
Currently, following a rejection from the wedge's upper supply line, the price has entered a corrective phase. This pullback is guiding the auction towards a significant confluence of support. The price is now approaching the ascending demand line, a key area where buyers have previously shown initiative and are expected to defend the trend.
The primary scenario anticipates a successful defense of this ascending demand line. A confirmed bounce from this dynamic support would validate the integrity of the upward wedge and signal that the bullish initiative is ready to resume. This is expected to trigger a full rotation back to the top of the pattern, breaking through the 1.1780 demand level. The take-profit is therefore set at 1.1810, targeting the upper supply line of the wedge. Manage your risk!
