EURGBP — Trendline Breakdown & Seller Zone Entry Toward TargetEURGBP maintained a structured bullish move within ascending channels (UTA/DTA), but price failed to hold above the key trendline and buyer zone. After multiple range distributions, the market broke the trendline decisively, signaling a shift in control from buyers to sellers.
The breakdown triggered a clean pullback into the seller zone, where price showed rejection and continuation pressure. As long as price stays below the broken trendline, bearish momentum remains valid, with the downside target aligned at the lower demand zone. This move reflects a classic trendline break → retest → continuation setup.
Breakout!

GOLD → Bearish Pressure Builds, But Confirmation Still RequiredHello everyone,
At the moment, gold is being influenced by a relatively sensitive macro backdrop. The U.S. dollar remains firm and U.S. Treasury yields stay elevated, making capital flows into non-yielding assets like gold more cautious. However, these factors are not yet strong enough to trigger a decisive sell-off ; they are mainly causing price to stall and lose momentum.
From a technical perspective , the H1 chart shows that gold has not confirmed a break of the bullish structure . Price is still hovering around the ascending trendline and consolidating after forming a double top near the highs. This reflects market indecision—buying pressure is weakening, but sellers have not fully taken control.
Therefore, the bearish scenario is only activated if price breaks and closes clearly below the ascending trendline . If that happens, the short-term structure would shift from bullish to bearish, opening the door for a move toward 4,262 , and potentially deeper to 4,207 , where demand previously appeared.
Conversely, as long as no breakout occurs , current price action should be viewed as consolidation or a corrective phase within the trend. Selling prematurely without a confirmed break carries higher risk and does not align with disciplined trading.
In summary , macro news is applying downside pressure, but technically gold still requires clear confirmation. The rational approach right now is not to predict, but to wait for the market to confirm . Only when structure is truly broken does the bearish scenario become valid and actionable.

GBPNZD BULLISH BREAKOUT|LONG|
✅GBPNZD delivers a clean bullish breakout from the demand zone, showing strong displacement and acceptance above prior consolidation. ICT structure flips bullish as buy-side liquidity is targeted, with momentum favoring continuation toward higher imbalance levels. Time Frame 4H.
LONG🚀
✅Like and subscribe to never miss a new idea!✅

Why the Market Loves to Trap Traders!!!If trading ever feels personal, it’s not.
The market isn’t hunting you; it’s hunting liquidity.
Understanding this single idea changes how you read charts forever.
1️⃣ The Market Moves Toward Liquidity, Not Logic
Most traders expect price to move because a pattern is “complete” or a level is “perfect.”
In reality, price moves to where orders are sitting.
Where is liquidity usually found?
- Above obvious highs
- Below obvious lows
- Around round numbers
- Near breakout levels everyone is watching
The market goes where the orders are, not where traders hope it goes.
2️⃣ Breakouts Are the Most Common Liquidity Pools
When price approaches a clear resistance, traders place:
- breakout buys above
- stop-losses from shorts just above
That creates a liquidity magnet.
Price spikes above the level, fills those orders…
and often reverses sharply once liquidity is consumed.
That’s not manipulation... that’s mechanics.
3️⃣ Traps Reveal Who’s Really in Control
A trap happens when price:
- breaks a key level
- fails to follow through
- returns back inside the range
This tells you something critical:
➡️ The side that should have won… didn’t.
4️⃣ Professionals Don’t Chase; They Wait
Retail traders react to the breakout.
Professionals wait for the reaction after the breakout.
They ask:
- Did price accept above the level?
- Did momentum expand or fade?
- Did structure shift or snap back?
Patience turns traps into opportunities.
📚The Core Lesson
The market’s job is not to reward anticipation. It’s to test conviction.
Once you stop trading where everyone else enters and start observing who gets trapped,
price action becomes clearer, calmer, and more logical.
⚠️ Disclaimer: This is not financial advice. Always do your own research and manage risk properly.
📚 Stick to your trading plan regarding entries, risk, and management.
Good luck! 🍀
All Strategies Are Good; If Managed Properly!
~Richard Nasr
EURUSD Short: Bears Defend Resistance - Next Stop 1.1700Hello, traders! EURUSD is trading within a broader bearish structure, with price action clearly respecting a descending trend line from the higher timeframe. Earlier, the pair reacted from a Pivot Point near the trend line and moved into a consolidation Range, showing indecision before the next directional move. During this phase, price attempted a breakout above the mid-range level, but this move turned into a Fake Breakout, confirming that buyers lacked strength at higher prices. Shortly after, EURUSD formed a clear Head and Shoulders pattern, with a well-defined left shoulder, head, and right shoulder, signaling a potential bearish reversal within the larger downtrend. Following the completion of the right shoulder, price pushed higher and briefly broke above the 1.1700 Demand Zone, but this breakout was quickly rejected. The market then reached the major Supply Zone around 1.1760, where sellers stepped in aggressively, causing a sharp rejection and confirming this area as a strong resistance.
Currently, EURUSD is pulling back from the Supply Zone and moving back toward the 1.1700 Demand Zone, which aligns with previous breakout levels and acts as a key decision area.
My scenario remains bearish as long as EURUSD stays below the descending trend line and the 1.1760 Supply Zone. I expect price to continue pulling back toward the 1.1700 Demand Zone, where the next reaction will define short-term direction. A clean breakdown and acceptance below the 1.1700 level would confirm bearish continuation and open the path toward lower support levels. If price temporarily reacts from demand, a short-term bounce is possible, but the overall bearish bias remains valid while price is capped below the Supply Zone and trend line. For now, sellers remain in control, with the main focus on a move back into the Demand Zone around 1.1700. Manage your risk!

Gold Continues to Search for New HighsHello, smart and prosperous friends — what’s your view on OANDA:XAUUSD ?
Today, gold continues to maintain its bullish momentum and is currently trading around USD 4,305, marking its highest level since October 21. The main driver remains expectations that the Federal Reserve will continue cutting interest rates, which puts pressure on the U.S. dollar and supports the precious metal.
In the near term, market attention is focused on the U.S. Non-Farm Payrolls (NFP) report, along with retail sales and PMI data scheduled for release today. These key indicators could directly influence monetary policy expectations and gold price volatility.
From a technical perspective, the bullish structure remains clearly intact. Strong demand zones below are holding firmly, while recent pullbacks appear to be purely technical in nature.
Notably, the USD 4,350–4,360 area is showing signs of a weak high, suggesting there may still be room for price to sweep liquidity to the upside. As long as gold holds above its structural support, the preferred scenario remains buying on pullbacks, rather than selling against the prevailing trend.
What’s your take on gold prices today? Share your thoughts 👇.

XAUUSD: Rejection at Resistance - Support Zone at 4,270 in FocusHello everyone, here is my breakdown of the current XAUUSD setup.
Market Analysis
Gold (XAUUSD) is trading within a broader bullish structure, but the current price action suggests a short-term corrective move. After breaking above the descending Triangle Resistance Line, price entered a consolidation Range, where accumulation formed before a bullish Breakout. This breakout pushed XAUUSD higher toward the key 4,350 Resistance, which has acted as a strong reaction zone in the past.
Currently, at this resistance level, price showed clear hesitation and rejection, signaling that sellers are becoming active again. The market is now pulling back from the highs, moving toward the 4,270 Support Zone, which aligns with the previous breakout area and the rising Triangle Support Line. This zone is critical, as it represents the main demand area keeping the structure bullish.
My Scenario & Strategy
My scenario is short-term bearish as long as XAUUSD remains capped below the 4,350 Resistance. I expect a controlled pullback toward the 4,270 Support, where buyers may attempt to defend the trend.A clean breakdown below the support zone would confirm a deeper correction toward the Triangle Support Line.
However, if price holds above 4,270 and shows strong bullish reaction, the broader uptrend remains intact and another attempt toward the highs may follow. For now, the focus is on the pullback phase, with 4,270 as the key level to watch.
That's the setup I'm tracking. Thank you for your attention, and always manage your risk.

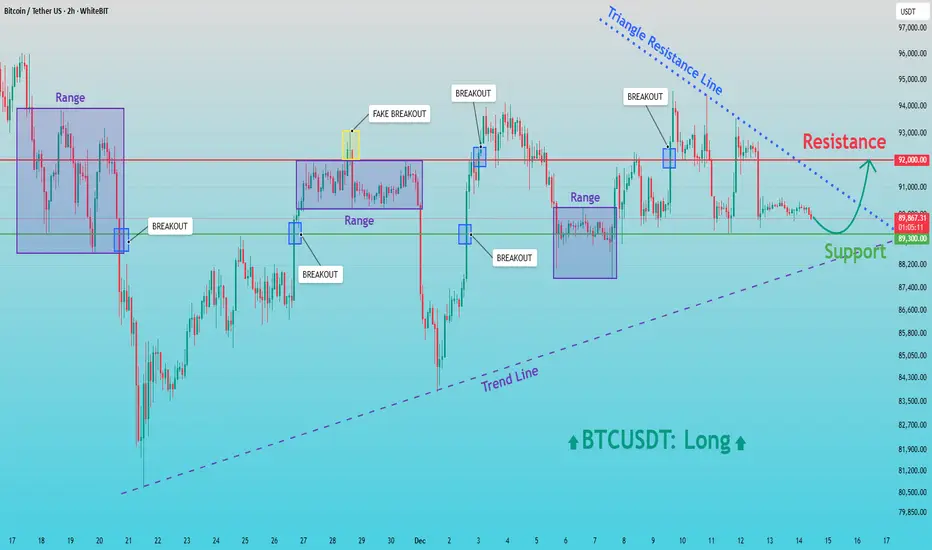
BTCUSD: Buyers in Control - Resistance Retest AheadHello everyone, here is my breakdown of the current BTCUSDT setup.
Market Analysis
BTCUSDT is currently trading within a broadly bullish structure, supported by a rising trend line that has been respected after the major sell-off and subsequent recovery. Following the strong decline, price formed a base near the lower levels and initiated a reversal, creating higher lows and shifting market control back to buyers. After the initial rebound, Bitcoin entered multiple Range phases, where price consolidated and built liquidity. Each range was followed by a breakout, confirming sustained buying interest. Some of these moves included fake breakouts, which briefly trapped participants before price continued to respect the broader bullish structure.
Currently, BTCUSDT is holding above the key Support Zone around 89,300, which has repeatedly acted as a demand area. Price is also compressing under a descending Triangle Resistance Line, while the rising trend line continues to support the market from below. This creates a tightening structure, suggesting that a decisive move is approaching. The 92,000 Resistance level remains the main barrier overhead, where sellers have previously stepped in and rejected higher prices.
My Scenario & Strategy
My scenario remains bullish as long as BTCUSDT holds above the 89,300 Support Zone and continues to respect the ascending trend line. I expect buyers to defend this area and gradually build pressure toward the upper resistance. A clean breakout above the 92,000 Resistance, especially with strong momentum, would confirm bullish continuation and open the path for a move toward higher levels, aligned with the broader trend.
However, if price fails to break the triangle resistance and loses the 89,300 Support, a deeper pullback toward the trend line could occur before buyers attempt another recovery. Until such a breakdown happens, the structure favors buyers. For now, the market remains constructive, with support holding and resistance at 92,000 as the key level to watch.
That’s the setup I’m tracking. Thank you for your attention, and always manage your risk.
XAUUSD Defends Support – Upside Move Toward 4,380 ExpectedHello traders! Here’s my technical outlook on XAUUSD based on the current market structure. Gold continues to trade within a well-established bullish trend, supported by a clear ascending Trend Line that has been respected after multiple pullbacks. After an earlier rejection from the upper Resistance Level, price experienced a corrective decline but successfully turned around near the trend line, confirming strong buyer interest at lower levels. Following this reaction, XAUUSD broke above the descending Resistance Line, signaling a shift in momentum back in favor of buyers. The market then entered a Range phase, where price consolidated between the Support Level around 4,260 and the Buyer Zone near 4,300, indicating accumulation and balance before the next impulse move. A confirmed breakout from the range occurred to the upside, with buyers aggressively pushing price above the Buyer Zone. Currently, gold is trading firmly above 4,300, showing sustained bullish strength and acceptance above previous resistance. The next key area of interest is the upper Seller Zone / Resistance Level around 4,380, which has acted as a strong reaction zone in the past. As long as price holds above the 4,260 Support Level and continues to respect the ascending trend line, the bullish scenario remains valid. My primary scenario is a continuation toward the 4,380 resistance, where a reaction or short-term rejection may occur. A clean breakout above this Seller Zone could open the door for further upside expansion, while rejection may lead to a healthy pullback toward the Buyer Zone or trend line support. For now, the structure clearly favors buyers, with 4,380 as the main upside target. Please share this idea with your friends and don’t forget to manage your risk 🚀

USDJPY Potential SELL SetupBreakout Analysis:
Distribution pattern with breakdown below key support suggests downside acceleration/momentum.
Strategy Framework:
Since the forecast calls for more downside momentum we can anticipate a corrective move towards BOS. The zone between BOS and Resistance Zone give us our POI, where we should be looking for shorts to ride the downside wave towards our targets.
Technical Analysis:
- Entry Strategy: Short on confirmed BOS
- Stop Loss: Above Resistance zone.
Target Zones:
- Primary Target: 1 (R:R 1:2)
- Secondary Target: 2 (R:R 1:3)
- Extension Target: 3 (R:R 1:4)
Bearish Confirmations:
🔻 Rejection candlestick patterns
🔻 Bearish Reversal patterns
🔻 Impulsive moves in line with setups directional bias
Position Management:
- Entry: Scale in on retest failure
- Exit: Partial profits at targets
- Stop adjustment: Trail below resistance
LIKE or COMMENT if this idea sparks your interest, or share your thoughts below!
FOLLOW to keep up with fresh ideas.
Tidypips: "Keep It Clean, Trade Mean!"

Latest Gold Price Update Today – Strong Rally👋Hello everyone, what do you think about the gold price today?
Gold prices are currently undergoing a mild correction, giving back part of the strong gains recorded late in yesterday’s session, and are now consolidating around the key 4,300 USD level after reaching a multi-week high earlier.
This move is driven by expectations that the US Federal Reserve (Fed) will continue to cut interest rates next year. Overall, gold remains on an upward trajectory despite a stronger US dollar and a broad rise in US Treasury yields.
From a technical perspective, the 4,250 USD resistance level has been convincingly broken and has now turned into a new support zone. This area is viewed as a launchpad for the precious metal to continue advancing toward the next resistance level at 4,370 USD.
And you — what’s your view on the gold price today?

TESLA BULLISH BREAKOUT|LONG|
✅TESLA strong ICT bullish continuation as price breaks and holds above a key institutional demand level, confirming a valid breakout. Acceptance above prior highs suggests smart money participation, with upside liquidity resting above the range and favoring continuation into premium targets. Time Frame 2H.
LONG🚀
✅Like and subscribe to never miss a new idea!✅

NZD/USD Building Bullish Structure From DemandDespite recent corrective moves, NZD/USD is developing a strong bullish foundation as price continues to respect the major demand zone at the bottom of the chart. Each rejection from this zone shows clear evidence of institutional buying, with long wicks and aggressive recoveries indicating that sellers are losing power.
The rounded-top and earlier distribution worked mainly as a liquidity sweep, pulling price back into areas where large buyers were waiting. Now, price is forming a higher-low structure, suggesting accumulation rather than continuation of the downtrend. The presence of the Fair Value Gap (FVG 4H) below acts as a completed rebalancing area, giving room for a clean bullish expansion.
If price maintains stability above the buyer zone (0.5690–0.5700), we can expect a progressive move toward the mid-range resistance at 0.5740, and eventually a push back into the upper supply zone around 0.5800, which becomes the primary bullish target. Fresh liquidity is building above recent highs, providing the fuel needed for an upside continuation.
Overall, the market shows signs of accumulation, higher lows, and smart-money support, favoring a bullish continuation as long as price remains above the major demand zone.

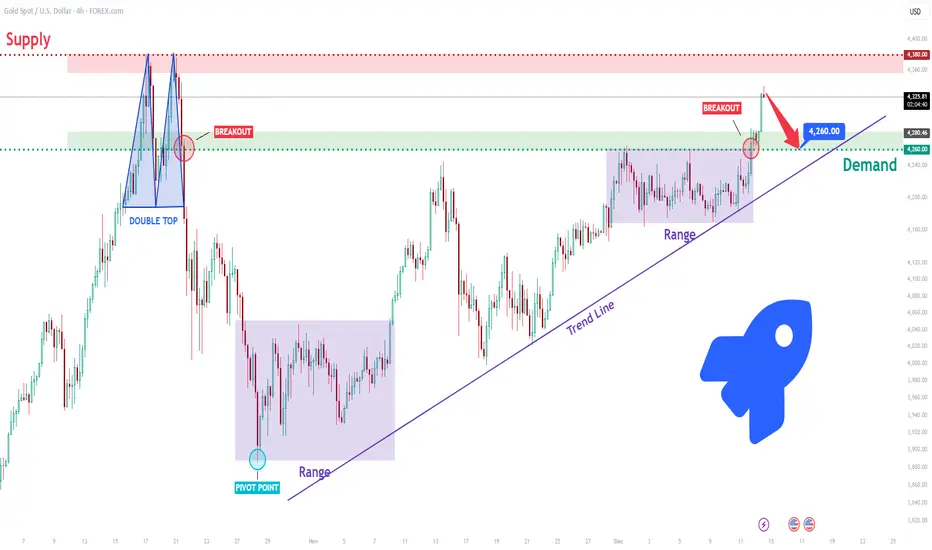
XAUUSD Short: Bears Aim for Pullback Into $4,260 Demand ZoneHello, traders! The current XAUUSD price action is showing early signs of bearish pressure after failing to sustain momentum above the upper resistance zones. Earlier, the market formed a strong Double Top inside the major Supply Zone, which triggered a sharp downside reversal and highlighted the presence of active sellers at the top of the structure. This rejection pushed gold back toward the mid-range levels, signaling a shift in market sentiment. After that decline, XAUUSD entered a prolonged Range phase, where price consolidated and accumulated liquidity for the next move. Although buyers attempted to regain control, the Trend Line breakout attempts showed weakening bullish strength, as each move higher was met with increased selling interest. The second consolidation Range formed near the upper supply boundary, confirming that the market was losing upward momentum.
Currently, gold broke out above the Range high but quickly faced resistance near $4,330, where sellers stepped in aggressively. Price is now pulling back and showing signs of returning toward the $4,260 level — a key decision zone that aligns with previous structure and where demand has recently weakened. As long as XAUUSD remains below the $4,330 resistance and fails to reclaim the local high, the bearish scenario becomes the primary outlook. A sustained move back into the Range and a breakdown below $4,260 would confirm stronger seller dominance and open the path toward deeper corrective movement.
My scenario is a continuation to the downside toward the $4,260 Demand Zone, especially if price breaks below $4,260 and loses the ascending structure. A clean breakdown of this level may trigger a broader bearish continuation. Manage your risk!
EURUSD: Sellers Drive Pullback - 1.1670 Support in FocusHello everyone, here is my breakdown of the current EURUSD setup.
Market Analysis
EURUSD remains in a broader bearish structure, and the recent price action is unfolding within a clear downward context. After moving through a prolonged range phase, the pair broke lower and continued to respect the descending trend line, confirming sustained selling pressure. Price later formed a Triangle Support Line, where buyers attempted to reverse the trend, leading to a breakout above the trend line and a retest of the Support Zone around 1.1670. However, after this retest, EURUSD quickly reached the major 1.1760 Resistance, which has repeatedly acted as a strong reaction zone. From this level, a sharp rejection occurred, showing that sellers are still firmly active and protecting this resistance area.
Currently, the market is pulling back from the Resistance Zone and heading back toward the Support Zone, where the ascending structure meets previous breakout levels.
My Scenario & Strategy
My scenario is bearish as long as EURUSD remains below the 1.1760 Resistance and continues to move away from this rejection zone. I expect the price to pull back toward the 1.1670 Support, where the next reaction will determine short-term direction.
Therefore, a clean breakdown below the 1.1670 Support Zone would confirm further bearish continuation and open the path toward lower levels. However, if the pair tests the support and shows a strong bounce, a short-term recovery toward the trend line may occur — but the bearish outlook remains valid while price stays under the 1.1760 Resistance. For now, the market favors sellers, with the key objective being a move back into the Support Zone around 1.1670.
That's the setup I'm tracking. Thank you for your attention, and always manage your risk.

Gold Continues Its Upward TrendHello everyone — let’s take a look at today’s gold price.
At the start of the new week, gold continues to extend its bullish streak, currently trading around USD 4,326. The precious metal remains strong amid expectations that the U.S. Federal Reserve (Fed) will cut interest rates next year, and it is still on track to close the year with an increase of around 60%, marking its strongest annual gain since 1979.
Regarding this week’s outlook, results from Kitco’s weekly gold price survey show that both investors and analysts continue to expect further upside. In the Wall Street survey, 13 analysts participated, with 85% believing that gold prices will continue to rise. Notably, none forecast a decline, while 15% expect prices to move sideways.
Similarly, in the Main Street online survey, 237 investors took part. Among them, 71% anticipate gold advancing to new highs, 11% predict a decline, and the remaining 18% expect prices to consolidate.
From a personal perspective, the chart structure remains clearly bullish, supported by solid demand zones. The immediate target is the USD 4,350 area , followed by the key psychological level at USD 4,400.
I remain optimistic — how about you? Share your thoughts in the comments section.

BTCUSD Holds Buyer Zone - Push Toward 96,700 LikelyHello traders! Here’s my technical outlook on BTC/USD based on the current market structure. After a prolonged decline, Bitcoin reversed from the Support Level and broke out of the downward channel, shifting momentum in favor of buyers. The price then moved into a consolidation Range, where accumulation formed before a confirmed Breakout pushed BTC higher. Since then, Bitcoin has been respecting the rising Triangle Support Line, forming higher highs and higher lows. Buyers consistently defend this structure, keeping the bullish trend intact despite local corrections. Currently, BTC is holding above the 90,500–88,800 Buyer Zone, which serves as the key demand area maintaining bullish pressure. As long as the price stays above this zone, the upward scenario remains valid. The market is now heading toward the major 96,700 Resistance Level, located inside the broader Seller Zone. A breakout above this level may open the door for further continuation, while rejection could trigger a pullback toward the Triangle Support Line. For now, the structure favors buyers, with 96,700 as the main upside target. Please share this idea with your friends and click Boost 🚀

2 Scenarios - GOLDHello traders,
the gold price has reached the resistance zone (4338 – 4355).
We now have two possible scenarios:
🟢 BULLISH SCENARIO:
If the market breaks and closes above the resistance,
we can expect a bullish continuation 📈
🎯 TARGET: 4400.000
🔴 BEARISH SCENARIO:
If the price breaks and closes below the support,
we may see a strong bearish move 📉
🎯 TARGET: 4192

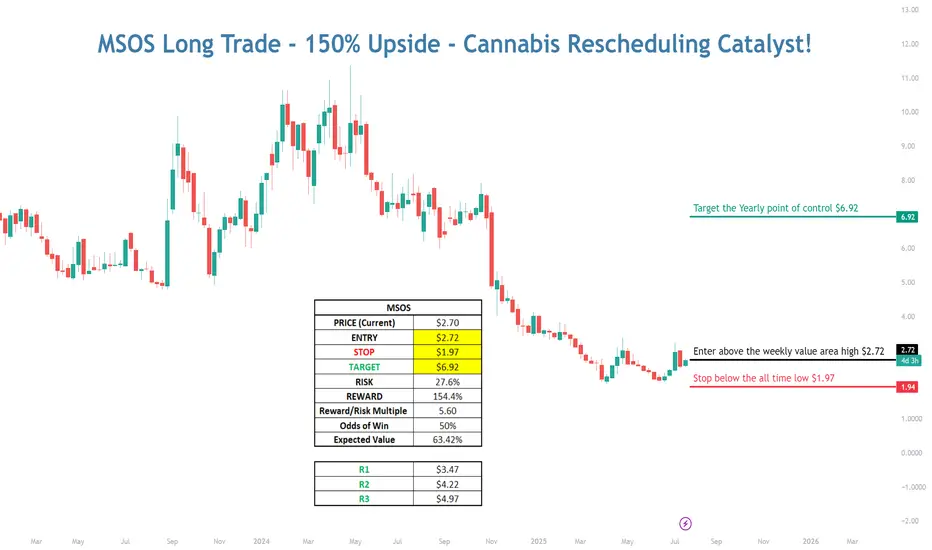
MSOS Long with 150% Upside - Cannabis Rescheduling Catalyst💠 Catalyst: Cannabis is currently classified as a schedule I drug alongside heroin, bath salts, and synthetic opioids that kill thousands every year — all while being safer than Tylenol and legal in over half the country. Cannabis is likely to be rescheduled to a schedule III drug soon after Terry Cole is confirmed as the head of the DEA. The vote to confirm him is expected to take place...TODAY
As a schedule I drug, cannabis companies can’t deduct regular business expenses for tax purposes, have limited access to banking, must transact with customers in all cash, and US multi-state operators are unable to list on the major US exchanges.
Terry Cole will be confirmed as the new head of the DEA, and when he is confirmed, the stalled process to reschedule cannabis from a schedule I to a schedule III drug should resume. If cannabis is rescheduled, that will pave the way for further research, destigmatize it, and open the door to banking and uplisting of US multi-state operators to the major exchanges in the near future.
This trade capitalizes on the fact that investors are not positioned for reform and further positive catalysts. The worst-case scenario is priced into the MSOS ETF, and when good news on rescheduling hits the tape, that should start a NEW Bull market in the MSOS cannabis stocks.
💠 Technical Setup:
Bear Market
• Multi-year bear market throughout the entire Biden administration on promises to reschedule that were never followed through on
• Capitulation when Trump won the election on the prospect of potentially another 4 years of no reform
Bearish to Bullish Technical Transition!
• LT Stage 1A Bottom Signal (Price > 50D SMA)
• ST Stage 2A Breakout (First day Price > 10D EMA and 20D SMA)
• Hourly Chart – Breaking out above Weekly Value Area
• Daily Chart – Trading above the Monthly Value Area
• Overlapping prior monthly value areas in sight!
• VPOC in sight!
• Weekly Chart – Targeting a retest of the Yearly POC
💠 Trade Plan
ENTRY: $2.72 (Break above weekly value area high)
STOP: $1.97 (Below the prior all-time-low)
TARGET: 6.92 (A retest of the yearly point of control from 2024)
RISK: 27.6%
REWARD: 154.4%
R/R Multiple: 5.6X
Probability of Win: 50%
Expected Value: 63.42%
MSOS Long with 150% Upside - Cannabis Rescheduling Catalyst💠 Catalyst : Cannabis is currently classified as a schedule I drug alongside heroin, bath salts, and synthetic opioids that kill thousands every year — all while being safer than Tylenol and legal in over half the country. Cannabis is likely to be rescheduled to a schedule III drug soon after Terry Cole is confirmed as the head of the DEA. The vote to confirm him is expected to take place...TODAY
As a schedule I drug, cannabis companies can’t deduct regular business expenses for tax purposes, have limited access to banking, must transact with customers in all cash, and US multi-state operators are unable to list on the major US exchanges.
Terry Cole will be confirmed as the new head of the DEA, and when he is confirmed, the stalled process to reschedule cannabis from a schedule I to a schedule III drug should resume. If cannabis is rescheduled, that will pave the way for further research, destigmatize it, and open the door to banking and uplisting of US multi-state operators to the major exchanges in the near future.
This trade capitalizes on the fact that investors are not positioned for reform and further positive catalysts. The worst-case scenario is priced into the MSOS ETF, and when good news on rescheduling hits the tape, that should start a NEW Bull market in the MSOS cannabis stocks.
💠 Technical Setup:
Bear Market
• Multi-year bear market throughout the entire Biden administration on promises to reschedule that were never followed through on
• Capitulation when Trump won the election on the prospect of potentially another 4 years of no reform
Bearish to Bullish Technical Transition!
• LT Stage 1A Bottom Signal (Price > 50D SMA)
• ST Stage 2A Breakout (First day Price > 10D EMA and 20D SMA)
• Hourly Chart – Breaking out above Weekly Value Area
• Daily Chart – Trading above the Monthly Value Area
• Overlapping prior monthly value areas in sight!
• VPOC in sight!
• Weekly Chart – Targeting a retest of the Yearly POC
💠 Trade Plan
ENTRY: $2.72 (Break above weekly value area high)
STOP: $1.97 (Below the prior all-time-low)
TARGET: 6.92 (A retest of the yearly point of control from 2024)
RISK: 27.6%
REWARD: 154.4%
R/R Multiple: 5.6X
Probability of Win: 50%
Expected Value: 63.42%

Bitcoin falling trendline soon will break and Bulls will lead Bitcoin is currently trading within an ascending channel, encountering resistance near both the channel's upper boundary and a significant historical descending trendline. While this confluence of resistance has prompted a short-term pullback, the overall structure suggests a potential breakout attempt in the near term.
A decisive move above the falling trendline would signal a shift in market structure, likely invalidating the bearish momentum and transitioning the market into either a consolidation range or a renewed bullish phase .
Following a confirmed breakout, the technical setup would support the potential for further upward movement, with progress expected to become more sustained once this key resistance zone is cleared.
So get Ready also other paths mentioned on the chart too what may happen in your view comment below !!
DISCLAIMER: ((trade based on your own decision))
<<press like👍 if you enjoy💚

Why the Reaction Matters More Than the Level!!!Most traders spend their time hunting for the perfect level.✖️
Support. Resistance. Demand. Supply.
They draw the zone… and assume price must react.
But professionals know something crucial:
The level itself is not the edge.
The reaction is.
Here’s why.
1️⃣ Levels Are Common Knowledge
Everyone sees the same support.
Everyone sees the same resistance.
If levels alone were enough, everyone would be profitable.
A level is just a location.📍
It doesn’t tell you who is in control.
2️⃣The Reaction Reveals Intent
What matters is how price behaves at the level.
Ask yourself:
- Does price reject immediately or hesitate?
- Are candles impulsive or overlapping?
- Does price leave the level with strength or drift away slowly?
A strong reaction tells you:
➡️ One side stepped in aggressively.
A weak reaction tells you:
➡️ The level exists… but conviction doesn’t.
3️⃣ Clean Rejections Beat Perfect Levels
A slightly imperfect level with a violent reaction
is far more valuable than a textbook level with no follow-through.
Professionals wait for:
- sharp rejections
- momentum expansion
- structure confirmation
They don’t assume... they observe.
4️⃣ Failed Reactions Are Warnings
When price reaches a level and does nothing…
that silence is information.
Failed reactions often lead to:
- level breaks
- deeper moves
- trend continuation
The market is telling you:
➡️ “This level no longer matters.”
📚The Big Lesson
Levels tell you where to look.
Reactions tell you what to do.
If you shift your focus from drawing levels to reading behavior at levels,
your trading instantly becomes clearer and more objective.
⚠️ Disclaimer: This is not financial advice. Always do your own research and manage risk properly.
📚 Stick to your trading plan regarding entries, risk, and management.
Good luck! 🍀
All Strategies Are Good; If Managed Properly!
~Richard Nasr

BTCUSDT Long: Demand Strength Holds - Market Eyes 93,8K BreakoutHello, traders! The current BTCUSDT price action shows a constructive bullish structure as the market continues to respect the key Demand Zone and the rising Trend Line. After a series of reactions around demand, buyers have repeatedly defended this area, preventing further downside and maintaining the integrity of the broader upward trajectory. Earlier, the market traded inside a corrective Range, showing temporary consolidation before buyers stepped back in and pushed price away from the lower boundary. Even though BTCUSDT faced strong rejection from the Supply Zone near 93,800, the recent pullback retraced directly into a high-value demand region, where the Trend Line and horizontal support intersect. This confluence has already triggered bullish reactions in the past, signaling that buyers remain active and prepared to protect the current market structure. The presence of multiple breakout attempts and higher lows highlights sustained interest from long-side participants.
Currently, BTCUSDT is testing the Demand Zone again, holding firmly above the Trend Line while forming a potential launch point for another upward impulse. As long as buyers maintain control over this level, the market structure favors a continuation toward the upper Supply Zone at 93,800, which remains the primary upside target. A clean bullish move from demand would confirm continuation of the prevailing trend.
My scenario as long as price stays above the Demand Zone and respects the rising Trend Line, the expectation is for BTCUSDT to move higher toward the 93,800 Supply Zone. A strong reaction from demand could initiate a new bullish leg, and a confirmed breakout above 93,800 would open the path for further upside expansion. However, a decisive break below demand would invalidate this long scenario and signal deeper correction. Manage your risk!
