OKLO — when nuclear momentum breaks resistanceSince late 2024, OKLO had been consolidating inside a clear rectangle between $17 and $59. The breakout from this long-term range triggered a new bullish impulse. The price has since returned to retest the breakout zone, now aligned with the 0.618 Fibonacci retracement at $51.94. The retest has completed, and the price is bouncing upward, confirming buyer interest.
Technically, the trend remains firmly bullish. The price closed above the prior range, EMAs are aligned below, and the volume spike during breakout supports genuine demand. The volume profile shows a clean path toward $100, indicating limited resistance ahead. The structure suggests a controlled rally rather than an exhausted move.
Fundamentally, OKLO is a next-generation SMR (Small Modular Reactor) company focused on delivering compact, efficient nuclear power solutions. Following its public debut via SPAC and recent capital injection, OKLO is transitioning from development to implementation. Institutional interest is holding strong, and the broader move toward decarbonization and energy independence places the company in a strategic position.
Target levels:
— First target: $100 — psychological and technical resistance
— Second target: $143 — projected from prior range breakout
OKLO isn’t just another clean energy ticker — it’s a quiet disruptor with nuclear potential. The chart broke out. The volume confirmed. Now it’s time to see if the market follows through.
Breakout

EURUSD Long: Correction Before Impulse UpHello, traders! A large upward wedge pattern has defined the price auction for EURUSD. This bullish structure has been formed by a series of higher highs and higher lows, with key pivot points establishing the diverging supply and demand lines. The auction has been rotating between the demand zone 2 and the supply zone near the 1.1780 level.
Currently, following a rejection from the wedge's upper supply line, the price has entered a corrective phase. This pullback is guiding the auction towards a significant confluence of support. The price is now approaching the ascending demand line, a key area where buyers have previously shown initiative and are expected to defend the trend.
The primary scenario anticipates a successful defense of this ascending demand line. A confirmed bounce from this dynamic support would validate the integrity of the upward wedge and signal that the bullish initiative is ready to resume. This is expected to trigger a full rotation back to the top of the pattern, breaking through the 1.1780 demand level. The take-profit is therefore set at 1.1810, targeting the upper supply line of the wedge. Manage your risk!

IONQ - BREAKOUT DOWN TRENDLINEIONQ - CURRENT PRICE 48.00 - 50.00
The stock is bullish as the share price is above 50-day EMA. The lows are getting higher - indicating demand is increasing.
The stock broke out down trendline - signaling bullish momentum. This bullish outlook is strengthened by positive readings in RSI (above 50 level).
ENTRY PRICE : 48.00 - 50.00
TARGET : 59.00 and 66.00
SUPPORT : 50-day EMA (CUTLOSS below 50-day EMA on closing basis)

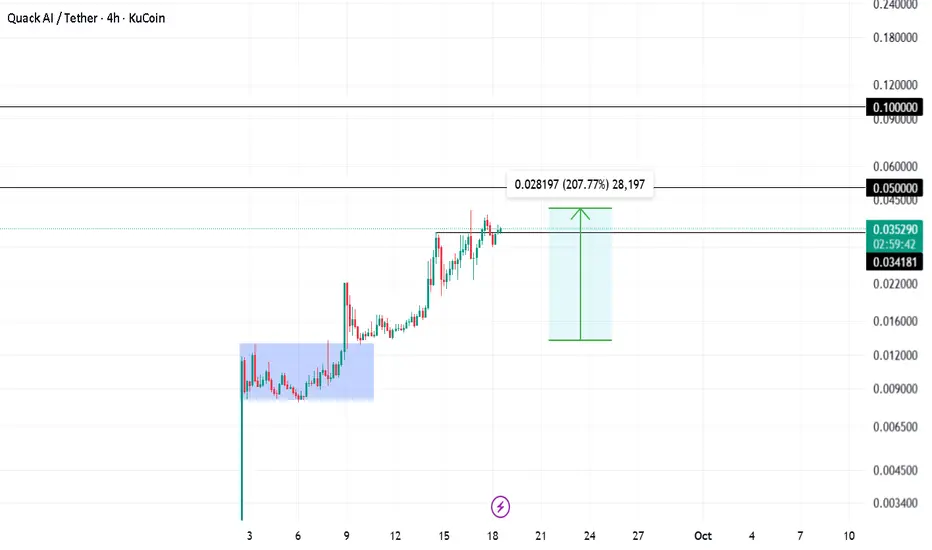
Q Pumped 207% Shared insights on Q trade a while ago. Been holding the trade for a while now and made easy 2x till now.
Hodling for 0.05 and 0.1 targets
Stop loss trailed!
EURJPY: Trend ContinuationNot many confluences here, but there's one key observation on the daily timeframe and another key observation on the H1 timeframe.
Daily Timeframe:
Price crossed the HTL two days ago, and failed to close below it yesterday
The current session's bullish bar signals that momentum is likely to continues upward
H1 Timeframe:
The DTL isn't really at play anymore, not fully marking a clean momentum break
However, price crossing above the EMA20 and exiting the EMA20-60 band signals intraday momentum is accelerating as well

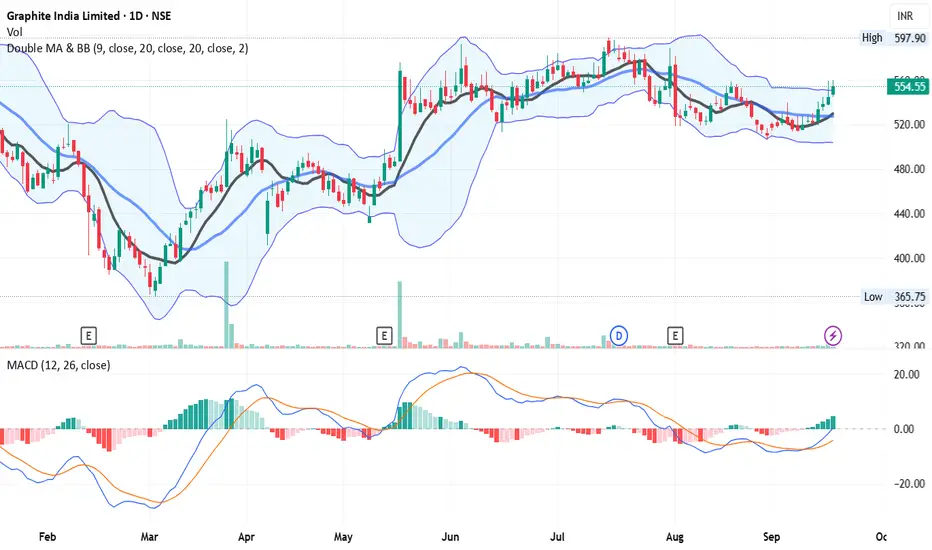
Breakout - Looks Good On Chart - GRAPHITE📊 Script: GRAPHITE
📊 Industry: Industrial Products (Electrodes & Refractories)
Key highlights: 💡⚡
📈 Script is trading at upper band of BB.
📈 MACD is giving crossover .
📈 Crossover in Double Moving Averages.
📈 Right now RSI is around 63.
📈 One can go for Swing Trade.
📈 In Monthly Chart It Script is forming Symmetrical triangle and about to give breakout, we can see good rally in future.
⏱️ C.M.P 📑💰- 555
🟢 Target 🎯🏆 - 578 / 597
⚠️ Stoploss ☠️🚫 - 539
⚠️ Important: Always maintain your Risk & Reward Ratio.
✅Like and follow to never miss a new idea!✅
Disclaimer: I am not SEBI Registered Advisor. My posts are purely for training and educational purposes.
Eat🍜 Sleep😴 TradingView📈 Repeat 🔁
Happy learning with trading. Cheers!🥂
NFP "Goldilocks" playbook? EURUSD triggers revealed!Markets are optimistic and consolidating ahead of the Non-Farm Payrolls (NFP) report, with EUR/USD poised for a breakout, plus a quick technical overview of gold, GBP/USD, and USD/JPY.
Mood : Buoyant—risk assets and equities are near weekly highs, bond yields are easing.
Consensus : A "Goldilocks" NFP (not too hot, not too cold) is expected, supporting a 25bp Fed rate cut this month and possibly another by year-end.
Catalysts : Recent softer labour data and dovish Fed commentary have fueled bets on a more accommodative policy stance.
EUR/USD Conditional Scenarios
Key Levels: Support at 1.1524, 1.1580, 1.1600, 1.1625; Resistance at 1.1700, 1.1735, 1.1760, 1.1830
Scenarios :
Strong NFP : Sell 1.1650–1.1670, targets 1.1600/1.1580/1.1524, stop 1.1700
Goldilocks NFP : Range trade 1.1625–1.1700, buy/sell at edges, stops 1.1580/1.1720
Weak NFP : Buy 1.1630–1.1650, targets 1.1735/1.1760/1.1830, stop 1.1600
Risk : 1–2% per trade, always use stops, watch for ECB-driven reversals
This content is not directed to residents of the EU or UK. Any opinions, news, research, analyses, prices or other information contained on this website is provided as general market commentary and does not constitute investment advice. ThinkMarkets will not accept liability for any loss or damage including, without limitation, to any loss of profit which may arise directly or indirectly from use of or reliance on such information.

EURUSD Strengthens in Upward Channel: Next Target at 1.19850?Hello everyone, Ken here!
Looking at the current market, it's clear that EURUSD is moving within a strong upward channel. This trend is not only clear but solid, with the next target around 1.19850, a crucial level at the upper boundary of the channel. This gives us confidence that the bullish trend will continue in the near future, though we still need to watch out for some factors.
While the main trend is leaning towards the buyers, we know the market never moves in a straight line without adjustments. A short-term pullback could happen, and this would present a great opportunity for us to enter, especially if strong bullish candlestick patterns, like engulfing candles, appear to confirm continued buying strength. If the price breaks above recent highs, it will further reinforce the bullish momentum, pushing EURUSD toward the next target.
However, as we know, nothing is certain. If the price breaks below the lower boundary of the channel, we’ll need to reassess the bullish outlook, as this could signal a potential change in the trend.
Remember, what we share here is just our personal opinion—not financial advice. Always double-check your setups and manage your risk carefully before making any trading decisions.

CHF_JPY BULLISH BREAKOUT|LONG|
✅CHF_JPY is going up
Now and the pair made a bullish
Breakout of the key horizontal
Level of 186.000 and the breakout
Is confirmed so we are bullish
Biased and we will be expecting
A further bullish move up
LONG🚀
✅Like and subscribe to never miss a new idea!✅

AUDSGD: H1 DTL BreakI've been alerted by my trend-following signal. Here are the key observations across the two timeframes I've been monitoring.
Daily Timeframe:
Price is above EMA20 > indicating an uptrend
EMA20 above EMA60 > indicating an uptrend
H1 Timeframe:
Price crosses above DTL > indicates upside potential and confluence with daily trend
Price is also crossing above EMA20 > indicates upside momentum should be picking up

DRIFT — No More Drifting, Breakout ImminentDRIFT has been trading sideways in a 226-day range, capped by resistance at $0.75. The POC of this entire range sits at $0.6, and price is currently trading above it at $0.62.
Volume spikes within the range show solid participation, and the structure is starting to resemble a Head & Shoulders formation with a neckline at $0.75 that needs to break.
Bullish Confluence (Support Zone)
Trading above:
21 Daily EMA ($0.593) / SMA ($0.592)
21 Weekly EMA ($0.577) / SMA ($0.549)
200 Daily EMA ($0.5828) / SMA ($0.5483)
Monthly Open → $0.5888
0.618 Fib retracement of current move → $0.5987 (long trigger)
Clear invalidation: below weekly 21 SMA ($0.549) / daily 200 SMA ($0.5483)
Resistance Confluence (Target Zone $1.3–$1.38)
nPOC of the end 2024 / early 2025 trading range → $1.3
0.786 Fib retracement → $1.2935
0.382 Fib retracement of entire downtrend → $1.3056
0.618 Fib retracement of smaller wave → $1.3677
Yearly Open → $1.3664
500M Market Cap → $1.38
📌 This creates a resistance cluster between $1.3–$1.38, an ideal take-profit zone and potential short opportunity.
🟢 Long Setup Idea
Entry: $0.62–$0.60 (ladder in near confluence with Fib + support levels)
Stop: Below $0.55 (weekly 21 SMA/ daily 200 SMA invalidation)
Targets:
TP1: $1
TP2: $1.3
Potential Gain: +115%
Quick Take
If $0.75 breaks, DRIFT could move quickly toward $1.3–$1.38, a zone stacked with resistance and confluences, the perfect place to secure profits/look for a short setup.
Key Levels
Support: $0.62–$0.60 (Fib + POC + EMAs)
Resistance: $0.75 neckline, then $1.3–$1.38 (confluence cluster)
🔍 Indicators used
LuxAlgo — Liquidity Sentiment Profile (Auto-Anchored)
DriftLine — Pivot Open Zones → For identifying key yearly/monthly/weekly/daily opens that act as major S/R reference points
Multi Timeframe 8x MA Support Resistance Zones → to identify support and resistance zones such as the weekly 21 EMA/SMA.
Fair Value Trend Model → Calculates a regression-based fair value curve
➡️ Available for free. You can find it on my profile under “Scripts” and apply it directly to your charts for extra confluence when planning your trades.
_________________________________
💬 If you found this helpful, drop a like and comment!

EURGBP – Battleground of Supply and Demand!EURGBP has been trading between clear supply and demand zones ⚖️, respecting both ends of the range.
After rejecting the 0.8750 supply zone, price turned lower, showing that sellers remain in control. Currently, EURGBP is hovering around the 0.8620 – 0.8640 demand zone, where buyers previously stepped in.
This area forms an important decision point 🔑:
- If demand holds, we could see a bounce back toward mid-range levels.
- If broken, a continuation lower would confirm supply’s dominance 📉.
Patience here is key ⏳ — waiting for confirmation at these zones can help filter out false moves and set up a cleaner trade.
⚠️ Disclaimer: This is not financial advice. Always do your own research and manage risk properly.
📚 Always follow your trading plan regarding entry, risk management, and trade management.
Good luck!
All Strategies Are Good; If Managed Properly!
~Richard Nasr

President Trump Speaks, Israel Strikes—What’s Gold Gonna Do?Hey Guys,
It’s been a while since I dropped a gold chart. Got a ton of requests—so here’s a fresh swing setup for you.
Fundamentally, President Trump recently said “Trump says his patience with Putin is running out.” That kind of statement adds fuel to gold’s upside. Plus, Israel’s attacks in the Middle East are also pushing gold higher.
Right now, gold’s in a resting phase. But I’m expecting a move toward $3700 either this week or next.
Technically, I’m seeing a clean bull flag pattern.
I always work with both fundamentals and technicals. That’s why my swing target is $3700.
Every like you send is my biggest motivation to keep sharing these setups. Big thanks to everyone backing me.

DXY Bearish Breakout! Sell!
Hello,Traders!
DXY is trading in a
Downtrend and the
Index made a bearish
Breakout of the key
Horizontal level of 97.200
So we are bearish biased
And we think that a
Further price decline is
Likely to happen
Sell!
Comment and subscribe to help us grow!
Check out other forecasts below too!
Disclosure: I am part of Trade Nation's Influencer program and receive a monthly fee for using their TradingView charts in my analysis.

Nike 1W - Just buy it?Nike is showing signs of a reversal after a prolonged downtrend, holding the key buy zone at 69.52, which aligns with the 0.618 Fibo retracement. The breakout of the descending channel adds weight to a structural shift, with the first target seen around 97.63, where the 1.618 Fibo extension and a major resistance zone converge. A successful breakout above this level would open the path toward 125.73, coinciding with the MA200 and a significant volume cluster. While the MA50 still hovers under price, suggesting caution in the short term, the overall structure points toward a bullish scenario.
Fundamentally , Nike remains solid, supported by recovering consumer demand and cost optimization, while its strong brand and institutional interest create a backdrop for sustained growth.
The tactical outlook favors a bullish continuation as long as price holds above the 69.5 zone, with upside targets at 97.6 and 125.7.
If buyers manage to maintain momentum, the market might just rewrite Nike’s slogan: “Just buy it.”

EUR/USD: Gradual Rise, Is a Breakout Near?Hey everyone, Ken here!
Looking at the EUR/USD chart today, I see a pretty clear signal. The price isn’t rushing upwards; instead, it’s moving slowly, indicating that the buyers are gradually taking control, but there hasn't been a strong breakout yet.
For me, there’s no reason to rush into a trade just yet. I’m going to wait for a clearer signal, like a strong candle confirming a break of the resistance around 1.1800. If that happens, my target will be around 1.2XX, as the current market trend seems favorable for that.
However, one thing to keep in mind is if the price closes below the lower boundary of the channel, the bullish structure would be broken, and a short-term decline could follow.
What do you think about this setup? Share your thoughts in the comments below!

USDJPY BreakoutPrice has been consolidating since early August and has formed a clear 4-hour horizontal channel.
This week's news may cause a USDJPY breakout:
Tuesday, 16th September, US Retail Sales
Wednesday, 17th September, 🚨 FOMC, Fed Interest Rate Decision, Fed Press Conference 🚨
Friday, 19th September, Inflation for Japan, BOJ Interest Rate Decision

USDCHF: Trend ContinuationGoing to make a trend continuation play on the USDCHF pair. I think there's a few levels to look at on both the daily and hourly levels.
Daily Timeframe:
Price crossed the daily HTL at the beginning of September
Price pulled back three days level but still held below it
H1 Timeframe:
This is the second ATL that price is crossing; based on the first ATL cross, movement is clean
Price did not exit from the EMA20/60 band so should reduce side

Gold Holds Steady, $3,700 in FocusOANDA:XAUUSD The price is still holding firm around $3,637/oz after the U.S. inflation report came in softer than expected. Despite a slight pullback, bullish momentum remains strong, and the falling wedge pattern is signaling a potential breakout.
From my personal perspective, the $3,700 level will be the key decision point. If it is broken with strong momentum, gold could extend its rally toward $3,725/oz or even higher. However, upcoming U.S. economic data such as PPI and jobless claims should be closely monitored as they may directly influence short-term volatility.
This is my outlook shared with the trading community. What do you think? Let’s discuss in the comments!

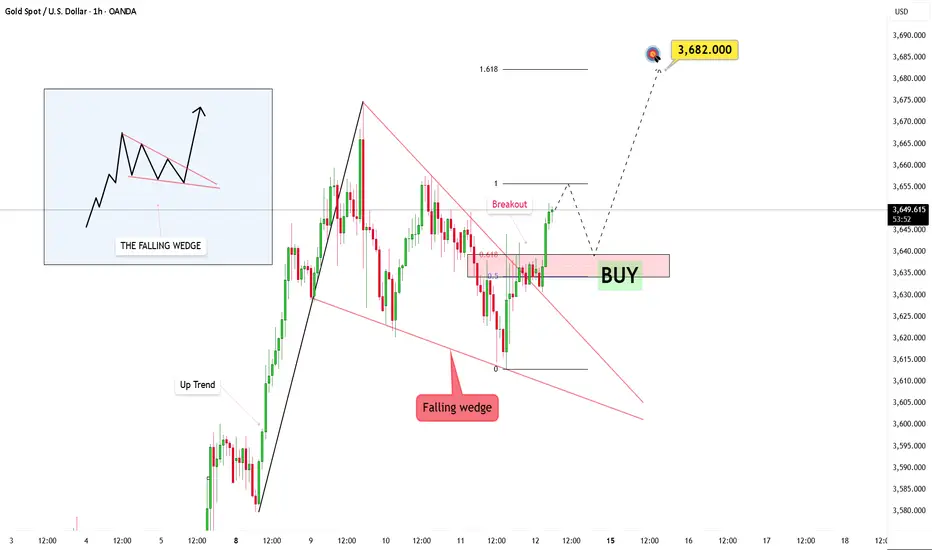
Gold Analysis: Falling Wedge Breakout and Bullish ForecastOANDA:XAUUSD The market is clearly forming a falling wedge, and recent price action suggests a potential shift is on the horizon. Price has begun breaking through this downward structure, which could be the early signs of a strong bullish move.
I’m waiting for the price to retrace back to the broken trendline. This will act as a confirmation, filtering out any false moves, while a retest of the structure will solidify the validity of the breakout. From here, my target is 3682.
The key now is to watch the pullback. If the market returns to the trendline with rising volume, it will add weight to the bullish case.
This trendline breakout is more than just a signal – it’s a story in the making. It represents a shift, and with the right volume, structure, and timing, this could be the start of a larger bullish phase.
DOGUSDT: Potential Reversal at Key Level in Rising ChannelHey everyone, Ken here!
Right now, I'm closely watching DOGUSDT and it seems like it might be going through a correction phase as the price tests the lower boundary of the rising channel. This is a key level, and if the price bounces from here, I believe it could continue towards the next target around 0.3200.
However, if the price breaks below this support, the bullish outlook would weaken, and we could see further declines. That’s why I always pay close attention to price action and trading volume to identify solid buying opportunities.
Risk management is essential in trading, so I always make sure to carefully confirm setups and trade with caution. What do you think about the current situation? Feel free to share your thoughts in the comments!

CHFJPY: Trend ContinuationAfter a pullback throughout August, it seems like this pair is gaining its momentum back. Here are my observations over on different timeframes.
Daily Timeframe:
EMA20 is above EMA60, which signals there's an overall uptrend
Price also pulled back and stayed above the DTL, indicating that this breakout is successful
H1 Timeframe:
Price crosses above the DTL, which is another indication that trend confluence is resuming
EMA20 being above EMA60 and diverging is giving indications that momentum is likely picking up

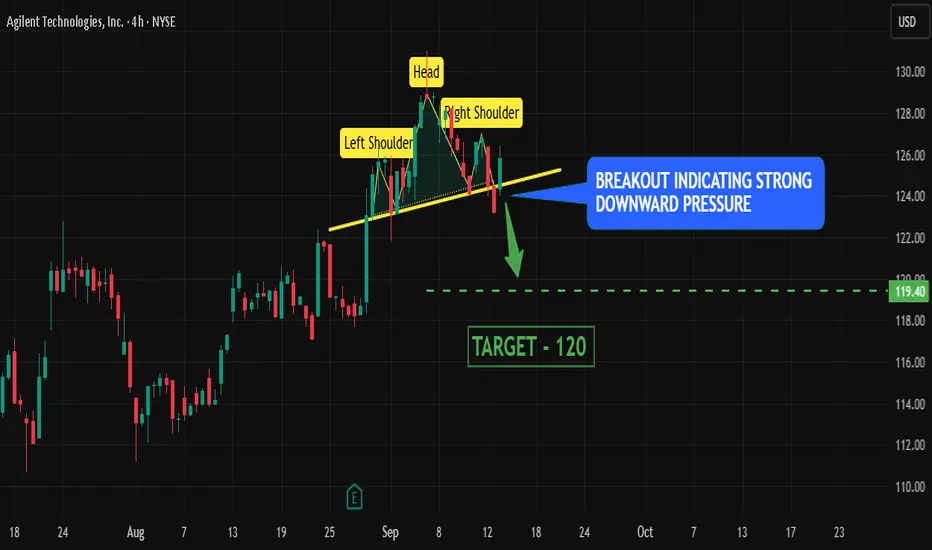
Head & Shoulder breakout in Agilent stock pointing Bearish move
HEAD AND SHOULDER BREAKOUT -
price broke out of head and shoulder pattern with a strong confirmation indicating strong downward pressure for the stock.
Definition -
(i) Left Shoulder → price rise, then fall
(ii) Head → higher rise, then fall
(iii)Right Shoulder → lower rise, then fall again
EVENING STAR CANDLESTICK -
1 large green candlestick followed by 1 doji followed by 1 large red candlestick is called evening star which indicates downward pressure for the stock
TARGET -
120 level