Tesla Breakout? For the majority of the calendar year TESLA has been in a range between $220 - $365 with a clear midpoint of $295.
From March to the beginning of May TESLA bounced between range low and the midpoint until finally breaking through into the upper half of the range where it has stayed ever since. However, there is a clear diagonal resistance level that is preventing higher highs.
So will TESLA breakout, or will it lose the midpoint? Structurally it is clear that the bulls have a set level they are happy to buy at (Midpoint) but the bears are getting more aggressive with their selling, hence the lower highs. This compression inevitably leads to an impulse move but the direction is not so clear.
Bullish scenario: A clean breakout with volume that makes a new higher high, signaling a shift in structure. A pullback and retest of the breakout would be an ideal opportunity to go long and aim for that range high before expecting resistance.
Bearish scenario: The lower highs keep printing until the midpoint is lost and price accepts below it, that would then signify to me the new trading range is between Range Low and Midpoint.
The fakeout scenario is a risk but with price so close to the midpoint already it follows the same invalidation criteria as the bullish scenario, the midpoint is vital to both sides.
Breakout

EURUSD Short: Rejection from Channel TopHello, traders! The price auction for EURUSD has been operating within a well-defined ascending channel. This bullish structure has been confirmed by multiple pivot points, with buyers defending the ascending demand line and sellers consistently emerging at the upper supply zone near the 1.1720 level. This has established a clear rotational pattern between the channel's boundaries.
Currently, the auction is at a critical inflection point, once again testing the upper boundary of this channel. The price has rallied to meet the ascending supply line, which forms a strong confluence of resistance with the horizontal 1.1720 - 1.1740 supply area. This is the same zone where previous rallies have failed, making it a key battleground.
The primary scenario anticipates a rejection from this resistance confluence, continuing the established pattern of rotation. The expectation is that sellers will defend the supply zone, initiate a new downward move, and break the current support level. The take-profit for this rotational play is therefore set at 1.1655 points, targeting a key intermediate liquidity area. Manage your risk!

Bitcoin will reach resistance line of channel and then dropHello traders, I want share with you my opinion about Bitcoin. The current market structure for Bitcoin is defined by a well-established upward channel that was formed after the price broke out of a prior triangle consolidation. This bullish pattern has been guiding the price action of BTC higher through a clear sequence of higher highs and higher lows between its dynamic support and resistance lines. The market has just completed another full upward rotation within this structure and is now positioned at a critical inflection point. Currently, the price is directly testing the upper boundary of the channel, which forms a powerful confluence of resistance with the horizontal 113500 - 114000 seller zone. This area has historically been a strong barrier where price has reversed on previous occasions. The primary working hypothesis is a short, rotational scenario, based on the expectation that sellers will once again defend this significant resistance confluence. A confirmed rejection from this seller zone would validate the integrity of the upward channel and likely initiate a new corrective swing to the downside, which would first need to break the current support level at 113500. Therefore, the TP is logically placed at 112400 points, a target that aligns perfectly with the ascending support line of the channel. Please share this idea with your friends and click Boost 🚀

TESLA BULLISH BREAKOUT|LONG|
✅TESLA is going up
Now and the stocks is trying to
Made a bullish breakout
Of the key horizontal
Level of 367.50$ and IF breakout
Is confirmed we will be expecting
A further bullish move up
LONG🚀
✅Like and subscribe to never miss a new idea!✅

AIRE - reAlpha Tech Corp - $1.51 PT / RetestNASDAQ:AIRE took flight this morning, jumping from $0.55 to $1.51 in the Pre-Market after announcing an upgrade to its Internal AI Loan Officer Assistant yesterday. We're looking for consolidation to the 3 targets identified with a Continuation Breakout to retest $1.51.

GCTK - GlucoTrack, Inc - $15.87NASDAQ:GCTK broke out to $14.49 after announcing that Sixth Borough Capital commits to $20M Purchase of CO's Common Stock. Based on current projections and if we find support around the $12.87, we could see GCTK retest the $15.87 Price Levels. If we don't get support arround that $12.87 Price Level, this could also consolidate back to the $8.30's for a better/secondary opportunity for entry.

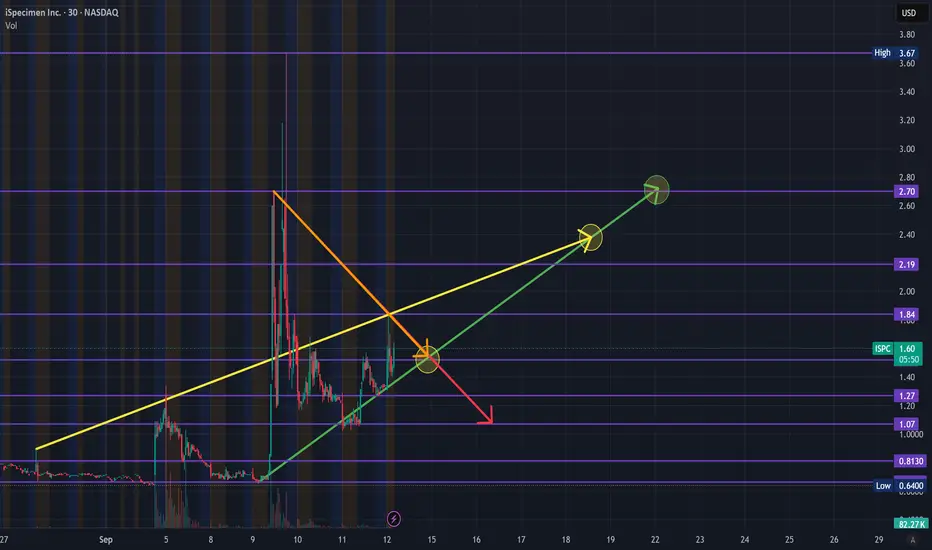
$ISPC - iSpecmen - $2.71 PTNASDAQ:ISPC broke out to $3.67 after announcing it advanced its $200 Million Solana-Based Digital Asset Strategy which it has since consolidated from and is starting to show confirmation of Descending Wedge to retest he $1.84 and $2.19 Resistance which we expect $1.84 Support and Bounce at best.
PROK - ProKidney Corp - $4.87We've been keeping an eye on PROK since July an glad to see it showing signs of another potential breakout trade. Currently at $3.21 going into the Pre-Market but we're looking for a potential $2.50-$2.60 entry if she consolidates from this move before pushing forward. Our Price is that $4.23 - $4.87 while she continues to trade in this lower descending wedge before finding the right compression to break and bounce out.
The company hit a $7.13 High in July ($13.77 in August '23) and we expect to se it gradually work to retest that going into 2026. But for now, going into October, we're looking at that $2.50 to $4.87 Trade for a 90-100% Swing. This comes after the company should achieve funding into 2Q 2027 based on Cash, Cash Equivalents and Marketable Securities.

$INHD - Inno Holdings - $10.23 PTNASDAQ:INHD hit our $15.71 Price Target in our previous trade, and has since consolidated back to the $5.50's where we're seeing another potential entry after finding support on that lower level of support we've been elevating from so far since Aug. 22, 2025 or so. Whether it's a hard breakout once we surpass that angled resistance down to the $6.60's where we believe we will see a Continuation Bounce/Break back to retest the $10.23's and tap that higher level of resistance that sits between $10.23-$10.94 Price Range.
The consolidation comes after the company announced a 7.2 Million Direct Offering. #MyMIWallet

EURJPY: Uptrend ContinuationSeveral observations over on the daily and H1 timeframes.
Daily Timeframe:
EMA20 remains above EMA60, which indicates uptrend from a technical standpoint.
Price is also crossing above HTL so that's no longer holding as resistance.
H1 Timeframe:
Price crosses above ATL, pulls back, and holds above breakout level.
The demand zone is subjective but price's pull-back did remain above this zone.

NZD_JPY MOVE UP AHEAD|LONG|
✅NZD_JPY broke the key
Structure level of 87.760 while
Trading in an local uptrend
Which makes me bullish biased
And I think that after the retest
Of the broken level is complete
A rebound and bullish
Continuation will follow
LONG🚀
✅Like and subscribe to never miss a new idea!✅

US100 Strong Bullish Bias! Buy!
Hello,Traders!
US100 keep trading in
A strong uptrend and
The index is now trying
To breakout the key
Horizontal level of 23,940
So IF the breakout is
Confirmed we will be
Expecting a further
Bullish move up
Buy!
Comment and subscribe to help us grow!
Check out other forecasts below too!
Disclosure: I am part of Trade Nation's Influencer program and receive a monthly fee for using their TradingView charts in my analysis.

BITCOIN Growth Ahead! Buy!
Hello,Traders!
BITCOIN is going up now
And the coin made a bullish
Breakout of the key horizontal
Level of 113k$ so we are
Bullish biased and we will
Be expecting a further
Bullish move up
Buy!
Comment and subscribe to help us grow!
Check out other forecasts below too!
Disclosure: I am part of Trade Nation's Influencer program and receive a monthly fee for using their TradingView charts in my analysis.

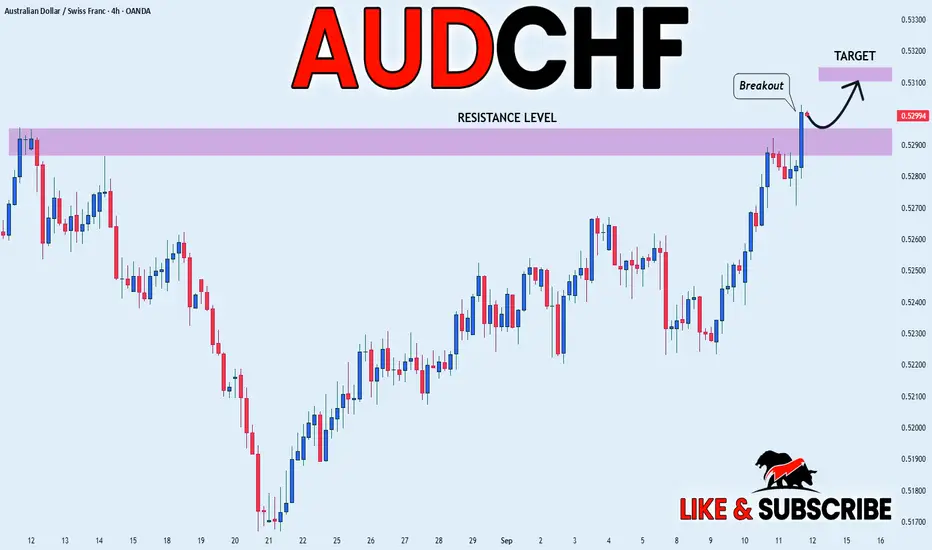
AUD_CHF BULLISH BREAKOUT|LONG|
✅AUD_CHF is going up currently
And the pair broke the key structure level of 0.5290
Which is now a support, and after the pullback
And the retest, I think the price will go up
LONG🚀
✅Like and subscribe to never miss a new idea!✅
GBP-AUD Bearish Breakout! Sell!
Hello,Traders!
GBP-AUD is trading in a
Downtrend and the pair
Made a bearish breakout
Of the key horizontal
Level of 2.0449 so we are
Bearish biased now and
We will be expecting a
Bearish continuation
Sell!
Comment and subscribe to help us grow!
Check out other forecasts below too!
Disclosure: I am part of Trade Nation's Influencer program and receive a monthly fee for using their TradingView charts in my analysis.

EURUSD: Price Exit from Triangle and Start FallHello everyone, here is my breakdown of the current Euro setup.
Market Analysis
From a broader perspective, EURUSD has been in a prolonged consolidation phase, forming a large symmetrical triangle. The price has been coiling between the major Support zone around the 1.1580 level and the key Resistance Zone up to the 1.1755 area, indicating a long period of market balance.
Currently, the price is at a critical decision point, trading at the apex of this triangle. It is directly challenging the descending resistance line, and the contracting volatility suggests a powerful, decisive move is on the horizon for the market.
My Scenario & Strategy
My scenario is built around the idea of a potential 'bull trap' or a failed breakout. While the price may initially break the triangle's resistance line, I believe the major Resistance Zone between the 1.1735 and 1.1755 area will hold firm, as it has done in the past.
I'm looking for the price to push above the trendline and into the Resistance Zone, which would likely trap optimistic buyers. The key signal would be a swift and forceful rejection from this area, pushing the price back down below the breakout point and eventually below the triangle's ascending support line. The primary target for this move is 1.1640, an objective below the current consolidation.
That's the setup I'm tracking. Thank you for your attention, and always manage your risk.

RCAT - Red Cat Holdings - $12.81 PTNASDAQ:RCAT has been consolidating from it's $12.81 since reaching that price level back in July '25. It's been having issues breaking above the $10.12 Price Level of Resistance, but if it does and finds support, we could see this running back to retest the $12.81.
This comes after Red Cat Drones are added to the NATO Catalog. With the recent upticks in concerns in the Middle East, as well as Europe, that could be a catalyst to continue pushing RCAT further up.

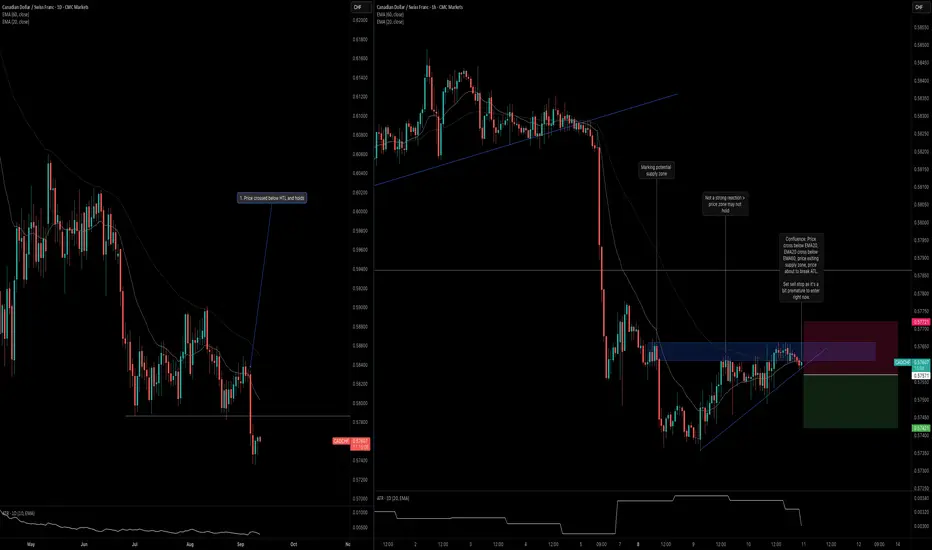
CADCHF: Trend Continues Below Daily LevelCADCHF is beginning to show confluence, which gives me an opportunity to frame my entry opportunity. Here are the key observations across the daily and H1 timeframes.
Daily Timeframe:
Price made a strong break below the HTL and is holding below it.
Although two bullish bar formed, they did not engulf the previous bearish bar, which is a good indication that buying strengh just isn't there.
H1 Timeframe:
There's quite a bit of confluence on the H1 timeframe with the first being price entering and exiting the potential supply zone.
In addition, price is about to cross below the ATL, which is another sign that the counter-trend move is ending.
Finally, there's confluence with the moving averages where EMA20 is crossing below EMA60; price is also beginning to cross below EMA20.
AUD_JPY BULLISH BREAKOUT|LONG|
✅AUD_JPY is going up
Now and the pair made a bullish
Breakout of the key horizontal
Level of 97.400 and the breakout
Is confirmed so we are bullish
Biased and we will be expecting
A further bullish move up
LONG🚀
✅Like and subscribe to never miss a new idea!✅

GBP-CAD Will Keep Growing! Buy!
Hello,Traders!
GBP-CAD is trading in an
Uptrend and the pair broke
The key horizontal level
Of 1.8723 so we are
Bullish biased and we
Will be expecting a
Further bullish move up
Buy!
Comment and subscribe to help us grow!
Check out other forecasts below too!
Disclosure: I am part of Trade Nation's Influencer program and receive a monthly fee for using their TradingView charts in my analysis.

EURUSD Short: Price Reverse and Start FallHello, traders! The price auction for EURUSD has been operating within a well-defined ascending channel for several weeks. This bullish structure has been confirmed by multiple pivot points, with buyers defending the ascending demand line and sellers consistently emerging at the upper supply zone near the 1.1715 level. This has established a clear rotational pattern between the channel's boundaries.
Currently, the auction is at a critical inflection point, once again testing the upper boundary of this channel. The price has rallied to meet the ascending supply line, which forms a strong confluence of resistance with the horizontal 1.1715 - 1.1740 supply area. This is the same zone where previous rallies have failed, making it a key battleground.
The primary scenario anticipates a rejection from this resistance confluence, continuing the established pattern of rotation. The expectation is that sellers will defend the supply zone and initiate a new downward move back towards the channel's support. A failure to break out higher would confirm a short-term correction is underway. The take-profit for this rotational play is therefore set at 1.1605 points, targeting the ascending demand line of the channel. Manage your risk!

ASST - Asset Entities - $15.65ASSET had a decent breakout to $19.79 this morning in Today's Pre-Market Session after announcing a merger with Strive to create a Bitcoin Treasury Play. With the Stock's Short Interest in visibility by the market, it's currently up 70% after the Market Open.
We're targeting a $9.77 entry along that lower level support trend that we're tracking to retest the $15.65 again.

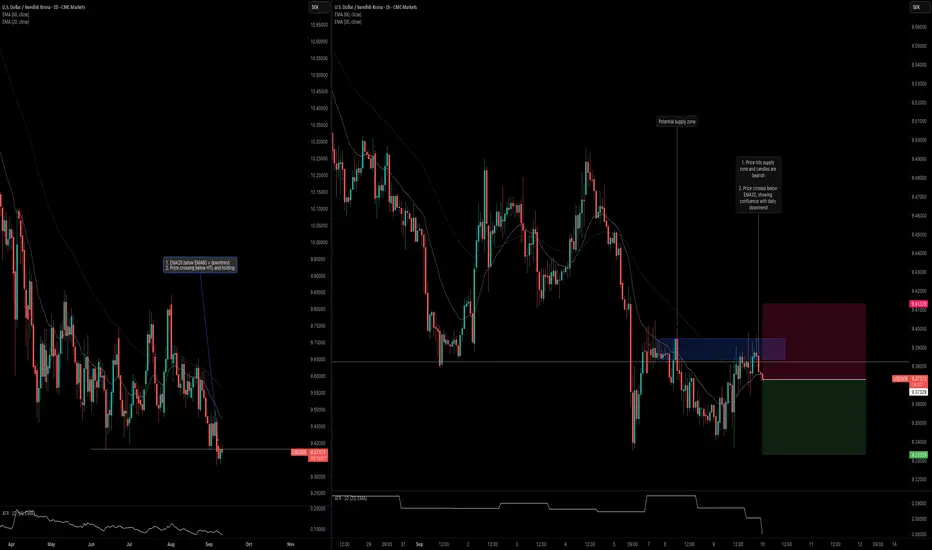
USDSEK: Trend ContinuationUSDSEK is one of the latest pairs to break below a key daily level. Here's my analysis on both the daily and intraday timeframes.
Daily Timeframe:
EMA20 is below EMA60, which indicates that this is a downtrend.
Price crossed below the horizontal trend line (HTL) and then a bullish bar formed that remain below the HTL.
H1 Timeframe:
Price entered a supply zone, and seemed to hold below it.
Price also crossed back below the EMA20, signaling confluence with the overall daily downtrend.