AUD/USD, Are Bull Set for a Breakout ?This analysis dates from the 3rd of May, this is in no way financial advice and should be taken into account in an objective way. Make your own opinion about it, don't take it for granted.
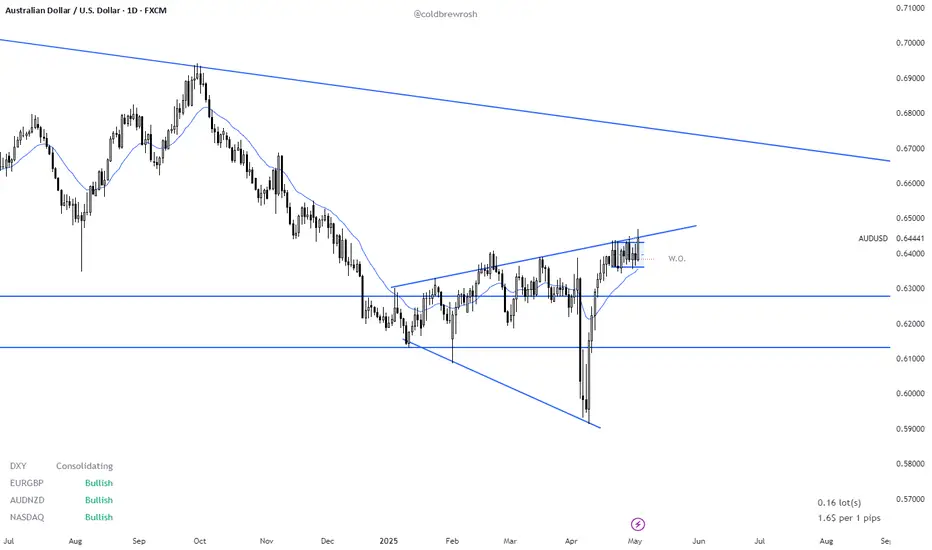
- AUD/USD is trading around the 0.64000 area on the daily chart, it has been consolidating around that area since April 21st following a 7 consecutive bull rally. Where it is heading to next still needs to be determined. Nevertheless, there is a clear Expanding Triangle dating since the start of 2025. (see image attached),(13th January, 03rd of Feb, 09th of April for the lower bar and 27 January, 20th Feb, 17th March, 23rd of April for the upside channel).
- This expanding triangle is similar to the one identified on NZD/USD which had an upside breakout and is now consolidating around the 0.59200.
- Whether there is an upcoming BO on Aussie Dollar is still TBT, but odds slightly favor the bulls following the strong rally in the first half of April. Nevertheless, it has been trading in a trading range since April 21st and there are no confirmed breakout yet. Needs to be closely watched in the coming days!! If bulls manage to get consecutive strong bull bars, this could set the stage for an measured move up for at a minimum a test of the 0.66000 area (downside channel from Feb 2021 to Nov 2024 on the Monthly).
- The Bear reversal case is harder to argue for, as they only managed to get one strong bear bar (04th April), with no follow through selling, The market has been trading for longer on the upper bracket of the extending triangle which means the market participant agree more on higher prices. Stay tuned for further updates !! Peace.
Breakout
GOLD WILL GO DOWN|SHORT|
✅GOLD is going down now
After a breakout a retest
A and a pullback from the
Key horizontal level
Of 3280$ so we are bearish
Biased and we will be expecting
A further bearish move down
SHORT🔥
✅Like and subscribe to never miss a new idea!✅
Disclosure: I am part of Trade Nation's Influencer program and receive a monthly fee for using their TradingView charts in my analysis.

NZD-JPY Swing Bullish Breakout! Buy!
Hello,Traders!
NZD-JPY is trading in an
Uptrend and the pair made
A bullish breakout of the
Falling resistance and the
Breakout is confirmed so
We are bullish biased and
We will be expecting a
Further bullish continuation
Buy!
Comment and subscribe to help us grow!
Check out other forecasts below too!
Disclosure: I am part of Trade Nation's Influencer program and receive a monthly fee for using their TradingView charts in my analysis.

GBP_AUD BEARISH BREAKOUT|SHORT|
✅GBP_AUD made a bearish
Breakout so we are bearish
Biased and we will be expecting
A local pullback and then a
Further bearish move down
SHORT🔥
✅Like and subscribe to never miss a new idea!✅
Disclosure: I am part of Trade Nation's Influencer program and receive a monthly fee for using their TradingView charts in my analysis.

EUR-CAD Will Keep Falling! Sell!
Hello,Traders!
EUR-CAD is going down
Now and the pair broke
The rising support line
Made a retest and is going
Down again now so we are
Bearish biased and we will
Be expecting a further
Bearish move down
Sell!
Comment and subscribe to help us grow!
Check out other forecasts below too!
Disclosure: I am part of Trade Nation's Influencer program and receive a monthly fee for using their TradingView charts in my analysis.

Bitcoin may rebound from seller zone and start to declineHello traders, I want share with you my opinion about Bitcoin. In the past, the price had been consolidating within a broad range, repeatedly rejecting support and resistance zones. The buyer zone between 79100 - 80300 provided a strong base, and from there, BTC began to grow, forming a bullish structure that led into an upward wedge. This growth accelerated once the price broke through the support area and continued upward until it approached the resistance level at 95500, which also overlaps with the seller zone. As the price moved inside the wedge, the bullish impulses weakened. Buyers lost strength near the resistance line of the wedge, and recent price action suggests that sellers are stepping in at the top. We’ve now seen multiple failed attempts to break higher, and the price is consolidating under resistance, forming pressure to the downside. This entire consolidation near the wedge resistance, especially inside a confirmed seller zone, indicates a likely reversal. The current structure shows signs of exhaustion, and if the support line of the wedge breaks, that would trigger a significant correction. Given this context, I expect BTC can make a bearish move toward TP1 at 91500 points. Please share this idea with your friends and click Boost 🚀

Equity Research Report – NEWGEN SOFTWARE TECHNOLOGIES Short-Term View: A strong breakout above key resistance at ₹1,100 with volume surge indicates bullish momentum. Price reclaimed the 50 EMA after consolidation. RSI at 60.87 supports strength; next resistance lies near ₹1,193.90.
Long-Term View: Structurally strong after correction. Sustaining above ₹1,020 (50 EMA) may attract fresh buying. Long-term targets can stretch to ₹1,300+ if earnings and demand trends remain favorable.
Conclusion: Bullish momentum likely to continue both short and long term. Watch for volume confirmation and hold above ₹1,100.
For Education Purpose only

KASPA Structure Analysis – Downtrend BreakoutAfter retesting the $0.05 demand zone (previous resistance dating back to August 2023), BITGET:KASUSDT reclaimed the 50-day EMA (yellow) and tested the 200-day EMA (orange), before a brief pullback with the 50-day EMA acting as support.
Key Levels
• $0.050-$0.060: Main demand zone
• $0.083: Current support, reinforced by 50-day EMA
• $0.105: Current resistance, reinforced by 200-day EMA
• ~$0.120: HVN and potential resistance
• $0.155-$0.160: HVN, previous S/R and potential resistance
• $0.180-$0.200: Main supply zone
Here's a weekly chart with volume profiles for more context:
Considerations
• The breakout from the recent downtrend, and the break above the 50-day EMA followed by a retest as support, is a good sign for the bulls.
• If the 200-day EMA is successfully reclaimed, it could offer a good shot at retesting the main supply zone in the $0.180-$0.200 area.
• Conversely, a sustained break back below the 50-day EMA could lead to another test of the $0.050-$0.060 main demand zone.
Neutral outlook until a break above 200-day EMA or below 50-day EMA.

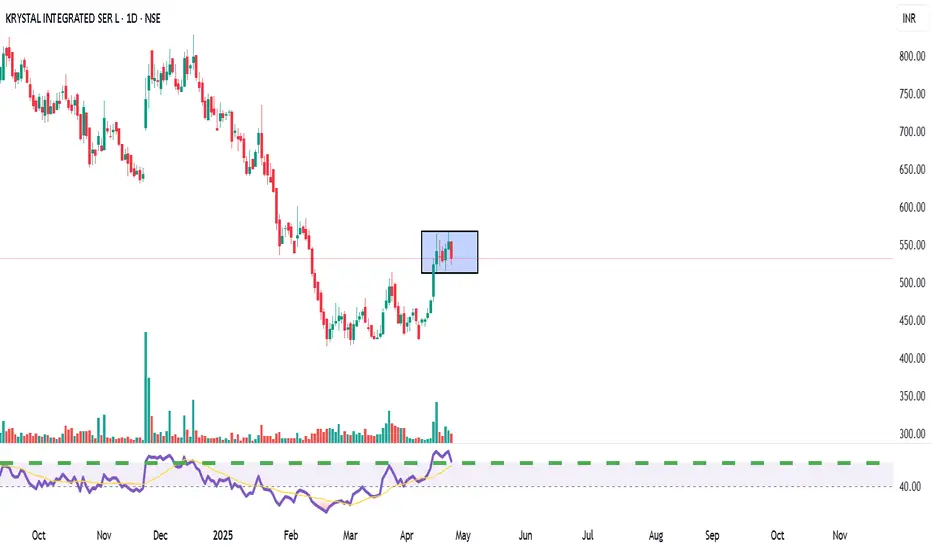
KRYSTAL Integrated Services LtdTechnical View: KRYSTAL is consolidating between ₹520–₹550 after a rally from March lows. A breakout above ₹560 could target ₹600+, while a dip below ₹500 may weaken momentum. RSI shows moderate bullishness.
Fundamental View: FY24 revenue grew ~44% YoY to ₹981 Cr; net profit rose ~26% to ₹48 Cr. ROE ~18%, ROCE ~20%. Recently secured a ₹349 Cr 3-year contract from Tamil Nadu Medical Services.
Action Plan:
Short-term: Buy above ₹560, target ₹600.
Long-term: Attractive valuation; accumulate on dips ₹450–₹500 zone.
EUR_CAD BEARISH BREAKOUT|SHORT|
✅EUR_CAD made a bearish
Breakout of the support
Cluster of the rising and
Horizontal support lines
Around 1.5672 and the
Breakout is confirmed so
We are bearish biased and
We will be expecting a
Further bearish move down
SHORT🔥
✅Like and subscribe to never miss a new idea!✅
Disclosure: I am part of Trade Nation's Influencer program and receive a monthly fee for using their TradingView charts in my analysis.

MEME/USDT: BREAKOUT ALERT!!🚀 MEME Breakout Alert – 40%+ Potential Incoming?! 👀🔥
Hey Traders! If you're all about high-conviction plays and real alpha, smash that 👍 and tap Follow for more setups that actually deliver! 💹💯
🚀 AMEX:MEME / USDT Long Setup – Breakout Watch! 🚀
AMEX:MEME is squeezing inside a symmetrical triangle on the 1H chart and is now testing breakout levels! Get ready for a potential explosive move! 📈⚡
📊 Trade Setup:
✅ Entry: CMP and add more in dip
✅ Targets:
• Target 1 → $0.00260
• Target 2 → $0.00290
• Target 3 → $0.00302+
🛡 Stop Loss (SL): $0.00207 (below triangle support)
📌 Why this setup?
Tight consolidation near apex
Strong EMA support
Previous breakout gave ~40% move!
⚠️ Risk management is key! Wait for confirmation, and always stick to your SL.
💬 Share your thoughts below — bullish or cautious on MEME? Let’s discuss! 👇👇

BTC REBOUND? 〉$140,000 NEXTAs illustrated, I'm visualizing what the next impulsive wave could look like.
Price has broken out of a major daily trend line.
It makes sense for the week to have started trading lower to find it's low and potentially bounce with strength sometime this coming up week and into the next.
The next pivot area is between the $82,000 - $80,000 range based on previous week's lows and daily low levels.
An interesting buy opportunity is forming and the potential entry is illustrated as the "pivot area" marked in yellow.
Then we have a major pivot range near the $100,000 psychological price.
.
This could be a price where some short term traders get out "in case it's just a pull back before a collapse" type of decision.
We can't ignore how much price consolidated between 100,000 and 96,000; and so that is the next stepping stone for BTC before breaking to ATH's of at least $120,000.
My personal target is set at the 161.8% extension level as illustrated.
--
GOOD LUCK!
Persa

EUR-CAD Bearish Breakout! Sell!
Hello,Traders!
EUR-CAD made a bearish
Breakout of the key horizontal
Level of 1.5700 and the
Breakout is confirmed
So we are bearish biased
And we will be expecting
A further bearish move down
Sell!
Comment and subscribe to help us grow!
Check out other forecasts below too!
Disclosure: I am part of Trade Nation's Influencer program and receive a monthly fee for using their TradingView charts in my analysis.

USD-CAD Will Keep Falling! Sell!
Hello,Traders!
USD-CAD is trading in a
Downtrend and the pair made
A retest of the horizontal
Resistance of 1.3868 from where
We are already seeing a bearish
Move down so we will be
Expecting a further
Bearish move down
Sell!
Comment and subscribe to help us grow!
Check out other forecasts below too!
Disclosure: I am part of Trade Nation's Influencer program and receive a monthly fee for using their TradingView charts in my analysis.

Euro may drop to 1.1200 points, exiting from pennant patternHello traders, I want share with you my opinion about Euro. Earlier, the price was growing steadily inside an upward pennant, following a strong breakout from the buyer zone. This impulse pushed the market higher toward the current support level at 1.1300, where the price found a temporary stabilization. Afterward, EUR moved into a range phase, trading sideways between local highs and lows. Despite several attempts to break higher, the market repeatedly showed weakness near the upper boundary, resulting in multiple turnarounds. Each bounce up was followed by lower highs, forming the descending resistance line of the pennant, while buyers defended the support area. Currently, the market is squeezed between the resistance and support lines, forming a classic compression pattern. Price action reveals increasing pressure on the support, and recent rebounds are becoming weaker, a clear sign of buyers losing momentum. In my view, the overall market situation has shifted from a strong bullish impulse toward a potential downside correction. So, given the breakdown structure forming and the price testing the lower side of the pennant multiple times, I expect a bearish breakout soon. My current TP1 is the 1.1200 points level. Please share this idea with your friends and click Boost 🚀

XRP Potential Falling Wedge / Bull PennantBINANCE:XRPUSDT is consolidating within a structure that could be interpreted as either a Falling Wedge or a Pennant — both typically bullish in the current context.
Dual Scenario Setup
• Falling Wedge – A classic bullish continuation structure. Breakout target: ~$4.00.*
• Bull Pennant – A high-conviction continuation pattern. Breakout target: ~$5.30.*
* Both targets are measured from the presumed breakout point and are only valid if price breaks out in the near term.
Key Technical Levels
• Resistance: ~$2.40 – The descending trendline capping price since January.
• Support: ~$1.60 – Confluence of support support trendline + 0.618 Fib retracement of the rally + 1-Year EMA.
• Supply Zone: ~$3.40
• A break below ~$1.60 would invalidate both patterns and shift bias to bearish.
Volume Note: Gradual decline during consolidation supports both wedge and pennant interpretations. A spike in volume post-breakout would confirm strength.
Until a confirmed breakout above ~$2.40 resistance, this remains in a No-Trade Zone for me — but one worth watching closely.
