Breakout Trading: How Low Win-Rate Systems Beat the Market█ Breakout Trading: How Low Win-Rate Systems Beat the Market
Most traders misunderstand breakout strategies. They expect high win-rates, smooth equity curves, and clean continuation.
But real breakout systems operate differently:
Low win-rate
Many small losses
Occasional massive winners
And long periods of nothing
A breakout strategy is not about predicting direction. It is about exploiting asymmetry, volatility expansion, and structural price imbalances. It is not about being right often; it is about being paid well when you are right.
█ What a Breakout Really Is
A breakout occurs when the price finally moves out of a range or breaks through a key level. It is not magic, and it is not random. It is mechanics, liquidity, and pressure.
Inside a range or right at a major level:
Liquidity builds on both sides
Stops accumulate above resistance and below support
Traders wait for confirmation
Algorithms sit idle during volatility contraction
When price pushes through a key level, it triggers a chain reaction:
stop orders → breakout entries → momentum algos → forced exits. This cascade is what creates the explosive leg everyone tries to catch.
In simple terms , a breakout happens when the price moves outside a well-defined support or resistance zone with strong momentum. This surge often marks the beginning of a new trend, a volatility expansion, or a major shift in market sentiment.
Breakouts appear in every asset class: stocks, futures, crypto, forex, and commodities, and on every timeframe from minutes to weeks. They are popular because when they succeed, they can deliver large, rapid moves and outsized profits.
But here is the part most traders ignore:
Most breakouts do not follow through. False breaks are common, and markets have become more efficient over time. Only breakouts with the right conditions, such as momentum, liquidity imbalance, and volatility expansion, have a high probability of running.
█ The Truth Most Traders Don’t Want to Hear
Most breakouts fail. Even strong breakout systems may only win 20 to 40 percent of the time.
Why does this happen?
Many breakout levels are weak
Liquidity is thin around obvious highs and lows
Algorithms hunt stop clusters before the real move
Price often snaps back into the range before expanding
But here is the part that actually matters:
Breakouts do not need a high win rate.
They need high asymmetry.
Small, controlled losses.
Occasional large, runaway winners.
This is the core structure behind every profitable breakout strategy.
⚪ Win-Rate and Risk/Reward: What Traders Should Actually Expect
The simple overview above is backed by decades of quantitative research. Breakout systems consistently show low win-rates but high R-multiple payoffs, and this is not an opinion. It is a measurable statistical pattern across markets and timeframes.
1. Low Win-Rate Is Normal and Expected
Across studies, breakout strategies typically win between 20 and 40 percent of the time.
Research by Bulkowski, academic momentum studies, and intraday ORB tests all show the same thing:
Breakouts frequently fail
Modern markets generate more false breaks than in the past
Algorithms exploit obvious levels and stop clusters
Short-term price action is dominated by mean reversion
A low hit rate is not a flaw. It is the natural behavior of breakout mechanics.
2. The Edge Comes From Asymmetric Payoff Distribution
A breakout strategy becomes profitable not by winning often, but by winning big relative to the risk taken.
Historical performance shows:
Losers: usually −1R
Winners: often +3R, +5R, +10R and beyond
When a system captures even a few of these extended moves, it more than pays for the many small stop-outs.
3. Breakout Systems Exploit Fat Tails and Volatility Expansions
Financial returns are not normal. They are fat-tailed. Breakouts are designed to capture these rare, outsized price moves.
The return distribution typically looks like:
Many small losses from failed breaks
A few large wins during volatility expansion
Long flat periods during range-bound conditions
Occasional massive trends that define the entire year
This right-skewed distribution is well-documented in momentum and trend-following research.
4. Academic and Quant Research Confirms the Pattern
Multiple studies validate the same expectations:
Zarattini, Barbon & Aziz (2024): ORB strategy on “stocks in play” produced over 1,600 percent return with modest win-rates
Moskowitz, Ooi & Pedersen: Trend-following (a breakout variant) shows positive expectancy across a century of data
Bulkowski: Breakout failure rates increase over time, confirming the need for filters and asymmetry
CTA/Managed Futures: Long-term breakout systems show strong convexity; a few big winners generate the majority of returns
The conclusion is clear:
Breakout strategies work when they harness asymmetry, not prediction.
█ Example: Breakout System 1
Win-rate: 20.28%
Breakout System Gain: +274%
Buy & Hold Gain: +96%
Explanation of the chart:
Flat periods → range markets
Dips → false breaks and stop-outs
Explosive steps upward → successful breakouts that trend hard
This step-like equity curve is the fingerprint of all trend-and-breakout systems.
█ Example: Breakout System 2
This system shows the same profile:
Many trades fail, but losses stay small
Occasionally a breakout runs far enough to cover dozens of losses
The equity curve’s “zig-zag then spike” pattern is normal behavior
The system wins big because the winners are massive R-multiples, not because it’s right often
This is the signature of low win-rate, high reward asymmetry.
█ The Real Mechanics Behind a Successful Breakout
A real breakout is powered by multiple forces hitting at once:
New longs entering / new shorts entering (initiative flow)
Stops being triggered (forced participation)
Short covering or long liquidation (fuel)
Algos joining the momentum (acceleration)
Volatility expansion is making moves larger
⚪ Read more about what makes prices move up and down:
█ What Makes Breakout Strategies Hard for Humans
Breakout trading is psychologically painful because:
You lose often
You sit through boring periods
Most trades look like “nothing happens”
Only a few trades create 80–90% of the long-term profits
To succeed, you need:
Patience
Small, consistent risk
The discipline to let winners run
The acceptance that many trades will fail
Breakout success = emotional resilience + asymmetry, not prediction.
█ The Takeaway
Breakout strategies are simple in theory and brutal in practice:
Low win-rate
High reward
Long quiet periods
Occasional massive expansions
Step-like equity curves
Outperformance through asymmetry
In the end:
You don’t trade breakouts to be right often — you trade breakouts to get paid big when the market finally moves.
-----------------
Disclaimer
The content provided in my scripts, indicators, ideas, algorithms, and systems is for educational and informational purposes only. It does not constitute financial advice, investment recommendations, or a solicitation to buy or sell any financial instruments. I will not accept liability for any loss or damage, including without limitation any loss of profit, which may arise directly or indirectly from the use of or reliance on such information.
All investments involve risk, and the past performance of a security, industry, sector, market, financial product, trading strategy, backtest, or individual's trading does not guarantee future results or returns. Investors are fully responsible for any investment decisions they make. Such decisions should be based solely on an evaluation of their financial circumstances, investment objectives, risk tolerance, and liquidity needs.
Breakoutstrategy
How I Caught 2R on USDJPY → and What’s NextIn the past few months, no pair has been as profitable as USDJPY.
If you followed my analysis from two days ago, you’re probably sitting on around a 2R profit right now.
Now, let’s talk about what’s next.
On the 15-minute timeframe, USDJPY has formed a clean range — and a breakout from this zone could trigger the next big move.
Setup and Entry Plan:
We can place a buy stop above the 155.002 resistance, though I personally prefer to wait for a breakout candle confirmation before entering.
At the moment, the structure doesn’t offer an ideal stop-loss placement.
If the price continues to range until just before the New York session, we’ll likely get a much tighter and more efficient stop.
Otherwise, the stop-loss can go below 154.604, or if you want to be safer, below 154.478.
Exit Plan:
The 155.874 zone is a solid first target for taking profit.
I recommend partial profits, since this trade aligns with both HWC and MWC structures — meaning continuation probability remains high.
However, if price fakes out below 155.002, it’s better to close the previous position (from two days ago), as we might be facing a short-term correction.
Goal:
The goal here is to capture the continuation of the HWC and the beginning of an MWC uptrend on the daily timeframe.
That’s why using partial profits helps you stay in sync with the trend while locking in higher R/R ratios safely.

1 Little-Known USDJPY Long Trigger That Actually WorksLadies and gentlemen, USDJPY finally broke its daily downtrend upwards. Momentum has completely shifted to uptrend.
Setup and Entry : After breaking the resistance at 154.363 and moving above the 1H shadow—meaning above 154.503—I expect growth to levels 155.874 and continuing to 156.821 for USDJPY.
I strongly recommend placing a stop buy in such conditions above the shadow I mentioned, because it shows that buyers have broken this level, and with the liquidity gathered from sellers, we can have strong upward growth with high momentum.
Exit Plan : If after breaking 154.363 it turns out to be a fakeout and we head back down without going above the shadow at 154.503, our scenario gets canceled, and we'll need to wait for a proper break candle or look at bearish scenarios. For stop loss, if we start the growth from here, a logical stop would be below the 154.060 levels, or if you want to play it safer, below the previous low at 153.871.
Goal : The aim of this position is to capture the continuation of the HWC and the start of the uptrend in MWC (daily), so it's better to use partial profits for early exits to stay aligned with the trend and secure higher R/R ratios.

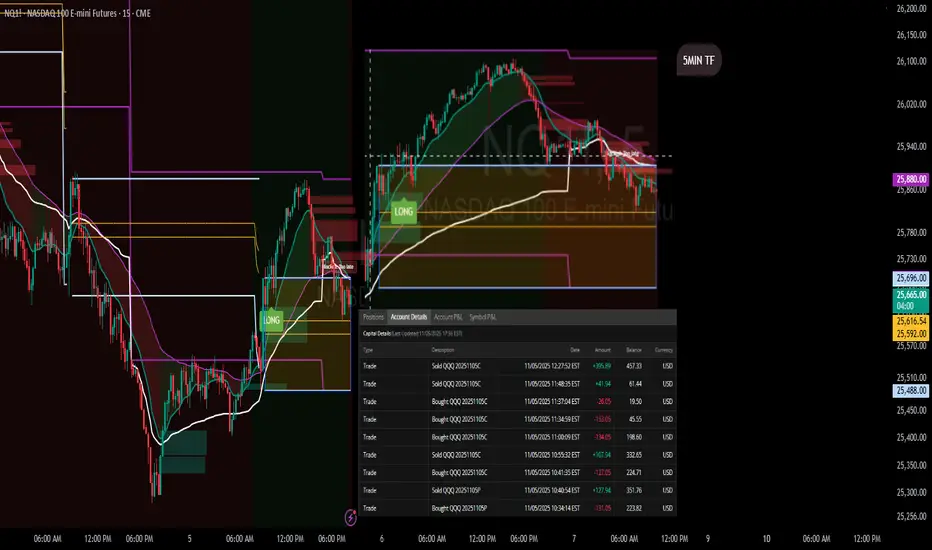
ORB Pro Signal Recap – Nov 5, 2025 | “Respect the Levels”Ticker: QQQ / NQ1! (5-min + 15-min TF)
Strategy: ORB Pro + Trendline Breakdown + Previous Day High Rejection
Focus: Signal confirmation & reaction zones
🧭 Market Context
The morning started strong, with buyers pushing off the open toward the previous day’s high (PDH) and ORB extension zone.
As price tapped the upper band, the ORB Pro system generated a clean long confirmation, aligned with the higher timeframe momentum.
But the rally quickly stalled at the PDH — a textbook reaction zone where the structure shifted.
From there, trendline breakdowns on both 5-min and 15-min charts confirmed exhaustion, and the system correctly prevented new long entries once momentum failed.
💹 Trade Breakdown
Initial Long: Taken on ORB Pro signal confirmation near the intraday retest (strong follow-through into PDH).
Profit-Take Zone: Price rejected sharply at the PDH and VWAP cluster — partials locked.
No Chasing: After the rejection, ORB Pro flagged “Blocked / Too Late,” keeping risk managed while trend flattened.
Result: Finished the day green with multiple small wins across calls — +$89.68 net on the $623C and +$15.89 on $626C.
📊 Performance Summary
Symbol Side Contracts Net Result
QQQ $623C Long 2 +$89.68
QQQ $626C Long 1 +$15.89
QQQ $622P Short hedge 1 –$3.11
Total P/L + $102.46 (Realized)
📈 Chart Recap
Price pushed through the early range with momentum but stopped exactly at the previous day’s ORB high and Fib confluence.
That rejection aligned perfectly with the HTF resistance zone on both 5-min and 15-min TFs.
The chart shows two green “LONG” entries and a clean signal fade once volume dropped —
a prime example of respecting structure over bias.
💡 Key Takeaways
PDH = Reaction Zone: Don’t ignore prior highs — they mark algorithmic defense zones.
Trust the Filters: ORB Pro prevented chasing the failed continuation after PDH rejection.
Structure First: The trendline breakdown confirmed what price was already telling us.
🧘♂️ Reflection
“The system signaled the move early, and I followed structure. PDH rejection confirmed the top, and discipline locked the profit. The goal wasn’t to predict — it was to react with control.”
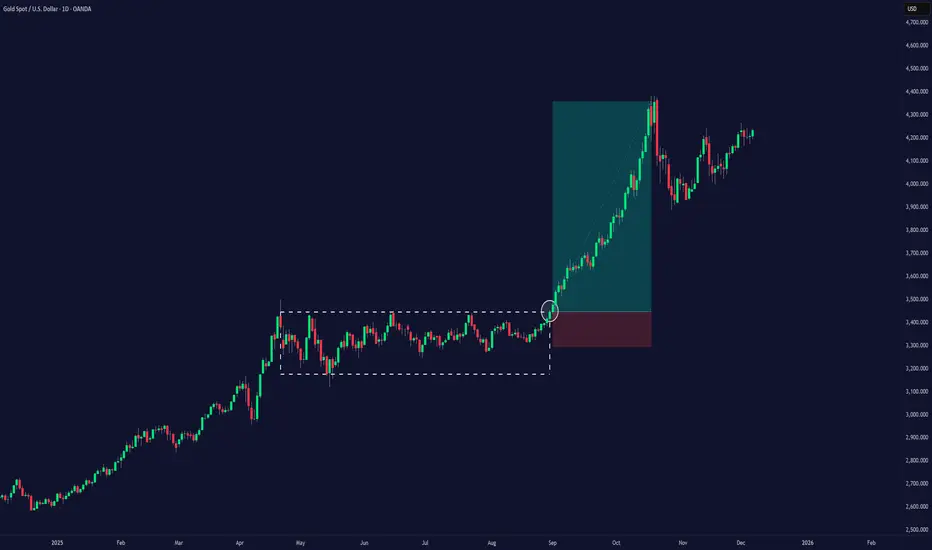
XAUUSD – Bull Pressure Builds After Breakout | Prediction SundayGold (XAUUSD) continues its bullish climb across all major timeframes after cleanly breaking out of a short-term descending channel. The higher timeframes now show strong consolidation above structure, suggesting potential continuation.
4H Analysis:
Breakout Retest Completed:
Price broke out of the short-term descending channel, retested structure cleanly around 3,524.91, and is now respecting an ascending channel.
Current Consolidation:
Gold is consolidating under the 3,600 resistance zone, holding strong above support at 3,578.50, forming a bullish flag-like structure.
1H Structure:
Support at 3,578.50 has been tested multiple times with rejection wicks, showing buyer strength.
If price breaks and closes above 3,600, continuation into 3,650 and beyond is likely.
A break below 3,524.91 would shift focus back to the 3,500 level and invalidate the short-term bullish setup.
🗺 Daily Context:
Price is trading within a well-respected ascending channel. The macro trend remains bullish as long as structure above 3,500 holds.
Trading Plan:
Bias: Bullish
Buy Zone: Retests near 3,578–3,580
Target: 3,600 → 3,625+
Invalidation: Break below 3,524.91
"Structure tells the story. Let the market reveal its hand, then strike."

BTCUSD MMC Analysis - Breakout Confirmation + Reversal + TargetWelcome back to another deep-dive analysis powered by MMC (Mirror Market Concepts), where precision meets market psychology. In today’s BTCUSD setup, we’re observing a textbook confluence of structural breakouts, demand rejections, and liquidity zone engagements. Let’s break it down step by step.
📊 1. Market Context & Background
The market recently showed a prolonged bearish trendline structure, with lower highs compressing price into a wedge. The prior days have been consolidative, hinting at an accumulation phase. This forms the foundation for reversal setups we often identify in MMC-style analysis — where liquidity, not just structure, determines the next move.
🔍 2. Demand Zone Dominance – 2x Tap Confirmation
At the bottom of the chart, BTC created a strong 2x Demand Zone (117,250–118,000 area), a region where buyers aggressively stepped in. This zone had already been tested once, and the second tap confirmed demand strength — a key MMC signal.
This dual-tap created a spring effect, launching price upward and rejecting all downside liquidity grabs. It also showed clear absorption of sell-side volume.
📈 3. QFL Behavior + Break of Structure
We see a QFL (Quick Flip Liquidity) reaction just after price bounced from demand — this is a behavior unique to MMC models. Here, price flipped structure rapidly after breaking a local high near 118,500, suggesting aggressive buyer entry.
This QFL event served as the first warning for a major trend shift.
Right after that, we got a major BOS (Break of Structure) above 119,250, further confirming the bullish transition.
🪜 4. Trendline Breakout – Second Confirmation
The descending trendline — connecting several swing highs — was breached with strong bullish momentum. Importantly, this was the second confirmation breakout, not just a fakeout spike.
The breakout candle closed strongly above the trendline and above the SR channel zone (gray area), confirming trend reversal intent.
This aligns with MMC's multi-stage breakout logic, where price gives one trap, pulls back, and then breaks cleanly with intent.
🛡 5. Channel SR Interchange Zone (Support-Resistance Flip)
The gray horizontal SR Channel played a crucial role. Initially acting as resistance, it became support once the breakout was confirmed.
This interchange behavior — a principle where support turns into resistance or vice versa — is critical in MMC. Price flipping this zone and holding above is a strong continuation signal.
🧠 6. Targeting & Forward Outlook
Price is now approaching the Mini Reversal Zone (119,750–120,250). This is a low-timeframe liquidity zone where short-term traders may take profits or where institutional orders may reverse temporarily.
Here are two potential scenarios:
Bullish Continuation: If price pulls back slightly and holds the channel SR as support, we may see a continued leg upward, breaking above 120,250.
Temporary Rejection: A sharp reaction from the Mini Reversal Zone could lead to a retracement into the Central Zone (~118,800), where buyers might reload.
📌 Key MMC Takeaways:
✅ 2x Demand Zone reaction confirmed bullish interest.
✅ QFL + BOS + Trendline Break = High-conviction reversal signal.
✅ SR Flip adds MMC-style structural layering.
✅ Price is now navigating final supply zones before expansion.
👑 Join the Candle King Community
If you find value in these advanced MMC analyses, join the Candle King server — a professional community focused on refining trading journeys through advanced market theory like Mirror Market Concepts, QFL, and real-time price logic.
📢 We don’t just trade levels — we trade behavior.

VIPIND on the Move | Breakout with Rising Volumes VIP Industries (VIPIND) is showing strong momentum, backed by high volumes and a decisive breakout on the charts. The stock is gaining strength and looks promising for short-term upside. Keep this on your watchlist for potential trading opportunities.

EURUSD Structural Analysis | Curve Breakout to Key Reversal Zone🔍 Structure Analysis:
The EURUSD pair has been exhibiting classic smart money behavior following a reaccumulation phase beneath a curved resistance structure. This curve acted as a dynamic liquidity ceiling, engineered to trap breakout traders during early sessions and encourage early shorts — only to be invalidated later by institutional momentum.
What we now see is a clean structural breakout, a shift in market sentiment, and a precision drive toward premium liquidity zones, where we expect reactions from institutional orders or profit-taking.
📐 Technical Breakdown:
🔹 1. Curved Resistance Breakout (Trend Manipulation Layer)
The curve represents a multi-touch descending resistance line that was gradually compressing price.
Multiple rejections created a false sense of bearish continuation, but in reality, smart money was accumulating positions under the curve.
The final breakout was impulsive and occurred on elevated volume, breaking both the curve and a short-term bearish structure.
🔹 2. Bullish Market Structure Confirmation
Higher highs and higher lows are now clearly established.
After the curve break, the price pulled back slightly, respecting the new trendline support — a sign of retest behavior and continuation.
The previous internal structure break was confirmed after a key swing high was violated, flipping the order flow to bullish.
🔹 3. SR Interchange + QFL Demand Zone
The 1.11800–1.12200 zone held firm during the retracement, previously acting as a strong resistance and now a support flip.
This zone coincides with a QFL-style accumulation base — a concept based on sudden dips into support where big orders are filled before sharp reversals.
Wick rejections and candle closes show strong interest by buyers.
🔹 4. Trendline & Structure Alignment
A clean ascending trendline is acting as dynamic support.
Each touch on the trendline has been followed by bullish expansion — another indication of institutional order flow support.
This trendline also aligns with internal FVGs (Fair Value Gaps), offering more confluence.
🔹 5. Liquidity Magnet: Next Major Zone
The next key area is marked around 1.15500–1.15750, which is a previous structural high, order block, and likely liquidity pool for pending sell-side orders.
This area is expected to act as a magnet, pulling price toward it before a potential reversal or redistribution phase begins.
📊 Trade Management Plan:
Parameter Details
Bias Bullish (Short-Term to Mid-Term)
Entry Zones Retest of trendline or minor FVGs
TP1 1.14500 (interim supply)
TP2 (Main) 1.15500–1.15750 (major liquidity zone)
SL Below 1.11800 (invalidates bullish idea)
RR Target 1:2.5 to 1:3 depending on entry precision
🧠 Concepts Applied:
Smart Money Concepts (SMC)
Break of Structure (BOS) & Change of Character (CHOCH)
Curve Manipulation / Compression
SR Flip (Support-Resistance Interchange)
QFL (Quasimodo Failure Level)
Trendline + FVG Confluence
Liquidity Pool Targeting
Volume Expansion Breakout Confirmation
🛎️ Watchlist Notes & Trade Expectations:
Expect short-term pullbacks into the 1.13000–1.13200 zone for liquidity re-tests.
Watch for reaction or sweep near 1.15500 — this is where short-term sellers may enter, and institutions may offload.
If price holds above the trendline and consolidates near the high, a continuation leg to even higher targets (1.16500) is possible — depending on macro conditions.
✅ Conclusion:
This EURUSD setup is a high-probability opportunity shaped by smart money behavior and deep structural context. The combination of the curve breakout, trendline strength, and liquidity targeting provides a clear roadmap for execution and management.
Use this analysis as a framework — always confirm with price action and risk management aligned with your personal strategy.

EUR/USD – Symmetrical Triangle Breakout & Bullish Continuation🔍 Overview
The EUR/USD pair has presented a classic and high-probability trading setup based on a symmetrical triangle formation, which recently experienced a bullish breakout. This pattern has formed after a period of compression and consolidation, creating a coiled spring scenario. Technical traders often watch for such breakouts as they signal the resumption of momentum with clear entry, stop-loss, and target zones.
This chart combines pattern recognition, key price action levels, psychological curve mapping, and structured trade planning. Let’s dive deeper into each component.
🧱 1. Chart Structure and Pattern Analysis
🔷 Symmetrical Triangle Formation
A symmetrical triangle is a continuation pattern formed when price action contracts between two converging trendlines.
This represents market indecision — both buyers and sellers are cautious, gradually narrowing the price range.
In this setup, the triangle has been forming since May 11, 2025, with a visible tightening of price action.
The chart shows well-respected upper and lower trendlines, confirmed with multiple touches on both sides.
🔼 Breakout Confirmation
A breakout occurred from the triangle's upper boundary around May 19, with a strong bullish candle closing above the structure.
Breakouts from symmetrical triangles often lead to sharp movements due to built-up pressure during the consolidation phase.
The volume typically expands at breakout zones (although volume is not displayed, price behavior implies it).
🔁 Retesting Area
Price may revisit the broken trendline (previous resistance → now support) for a retest before continuing higher.
This "retesting area" provides an ideal entry for those who missed the initial breakout.
Retests validate the breakout and confirm buyer strength.
🧱 2. Key Levels and Market Dynamics
🔻 Minor Resistance Zone (~1.13700–1.14100)
This zone has previously acted as a supply area where sellers pushed price down multiple times.
Price may hesitate or range within this area before breaking higher.
If bulls maintain control, breaking through this resistance zone will add confirmation to the bullish momentum.
📈 Target Projection: 1.14662
The target is derived by measuring the height of the triangle and projecting it from the breakout point.
It also aligns with a previous horizontal resistance level and psychological round number area.
This zone could act as a medium-term profit-taking level for swing traders.
🧠 3. Black Mind Curve – Market Psychology in Play
The "Black Mind Curve" is a representation of anticipated market sentiment and price flow.
It reflects a wave-like journey post-breakout — early breakout, pullback, bullish continuation, minor consolidation, and final push toward the target.
Such curves are used to forecast crowd behavior patterns, capturing how traders typically react post-breakout:
📌 Initial breakout ➜ Profit taking ➜ Retest ➜ Re-entry ➜ Final impulsive move.
🧮 4. Trading Strategy & Execution Plan
✅ Trade Setup
Entry:
Breakout Entry (already active)
OR Retest Entry near the triangle’s upper boundary for conservative traders.
Stop-Loss (SL) :
Placed just below the triangle’s lower boundary at 1.11726.
This level invalidates the breakout and prevents deeper drawdowns.
Take-Profit (TP):
Final target at 1.14662, offering excellent risk-to-reward potential.
📊 Risk-to-Reward Ratio:
Depending on the entry (breakout or retest), the RR can range from 1:2.5 to 1:3.5, which is ideal for swing or short-term position traders.
📚 5. Educational Insight
This pattern illustrates the importance of:
Price compression zones (triangles and wedges) as precursors to momentum trades.
Confirmation via breakout candles before entering high-conviction setups.
Patience during retests, which allow re-entries with defined risk and improved pricing.
Blending technical structure with psychological forecasting to stay aligned with market sentiment.
🔚 Conclusion
EUR/USD is showing a technically sound and psychologically supportive setup for bullish continuation. The symmetrical triangle has broken with strength, and price is heading toward key resistance with momentum.
If you're already long — consider holding until the target is hit or trailing stops to protect profits. If you're not in yet — watch for a retest to join the move with precision.
🔔 Always remember to manage risk effectively. No setup is guaranteed, but trading based on structure, confluence, and price behavior improves your edge

EUR/GBP Collapses Bearish Breakout SetupThis chart shows a short trade setup based on the price action and trendline analysis of the EUR/GBP pair on the 2-hour timeframe. The price was moving within an ascending channel, defined by two parallel white trendlines. The ascending channel suggests a temporary bullish trend where the price consistently made higher highs and higher lows.
At the top of the channel, the price experienced resistance, which led to a breakdown below the lower trendline. This breakdown signals a potential reversal of the bullish trend and marks the start of bearish momentum. The break of the lower trendline is the key signal for the short entry.
The breakdown also aligns with a shift in market sentiment, as the price failed to maintain its position within the channel. The sell-off that followed confirmed the validity of the breakout. The price is now trending downward toward a lower level, which could act as a support area.
The key levels to watch include the recent breakout point, which could act as resistance if the price attempts a pullback, and the lower support level near 0.82856. This support level aligns with a previous price range and serves as the potential target for the short position.
The descending movement following the channel break suggests strong selling pressure. To confirm the continuation of the bearish trend, the price should not re-enter the ascending channel. A retest of the lower trendline could provide further confirmation of the breakdown, while a failure to hold below it could invalidate the bearish bias. This setup reflects a clear trend reversal strategy focusing on trading the breakout of an ascending pattern.

GBP/CAD ANALYSISWe're currently analyzing the 30M timeframe of GBPCAD, where the market price is forming a range. The key question is: which direction will the price break?
1: If the price breaks upwards, we'll enter a buy trade, targeting 1.77880.
2:If it breaks downwards, we’ll look to execute a sell trade, with targets at 1.76510 and 1.76260.
Candle confirmation is essential, and we'll only execute the trade once we have that confirmation in hand.
Always use stoploss for your trade.
Always use proper money management and proper R:R ratio.
#GBPCAD 30M Technical Analyze Expected Move.

NVDA Breakout Setup: Long Above $125.17, Short Below $123!Hey traders, Mindbloome Trader here! In this video, we’re zooming in on NVDA from the 4-hour to 30-minute charts. It’s simple—if we break above $125.17, I’m going long. But if we drop below $123, I’m ready to short. Watch the levels and trade what you see, not what you think!

Looking for an obvious breakout on CVS! 🔉Sound on!🔉
Thank you as always for watching my videos. I hope that you learned something very educational! Please feel free to like, share, and comment on this post. Remember only risk what you are willing to lose. Trading is very risky but it can change your life!

SMC / ICT MODULEIn this analysis we are focusing on (4H) time frame for XAUUSD. Here we are using SMC / ICT concept strategy with combination of price action as we know bearish momentum is strong and also price break the breaker OB. Now we are looking at the support zone for buying opportunity. In this analyze we have two conditions if price come to the support are and reject it then after confirmation we will open buy position but if price break our support area then we will wait and after retracement we will open sell trade and the target is set at 2330. According to the SMC/ICT strategy when price sweep all the sell side liquidity then price will further move in the direction of the trend , but here price moves downside without taking any pullback or inducement. I'm looking for buy today let's see what happens and how price will act after entering into the support area.
let's delve deeper into these levels and potential outcomes.
This is just my analysis or prediction.
# GOLD (4H) Technical Analyze Expected Move.

SUPPLY AND DEMAND MODULE Here I'm focusing on 1H time frame for gold. today I'm looking for buy opportunity at the breaker block by using the breakout and rejection strategy. Bullish momentum is also very strong and also we are watching the divergence. Without any confirmation we could not place our trade. Let's delve deeper into these level and potential outcomes.
Always put stoploss for your trade.

SMC / BREAKOUT STRATEGYIn this analysis we are focusing on (M30) time frame for XAUUSD. Here I'm looking for buy because price create resistance and also price break the resistance toward upside so after breakout our resistance becomes support. so we will wait for confirmation. Let's delve deeper into these levels and potential out comes.
#XAUUSD Technical Analysis Expected Move.

Waiting for a breakout to the upside for UBER!🔉Sound on!🔉
Thank you as always for watching my videos. I hope that you learned something very educational! Please feel free to like, share, and comment on this post. Remember only risk what you are willing to lose. Trading is very risky but it can change your life!

BTC FOR SCALPERS AND DAY TRADERS **5300 POINTS **Entry price ,stoploss and Target already marked in the chart itself FYI.
Guys pls like, share and follow my ideas .
Thank You All

Learn THE BEST Breakout Trading Strategy
Hey traders,
Breakout trading is one of the most popular trading strategies.
Being quite simple in theory, it remains quite complex and complicated in practice.
In this post, we will discuss 7 steps every breakout trader must follow.
💬And just in brief about a breakout trading itself:
this method aims to spot a key level (it might be horizontal support/resistance or a trend line) and then to trade its occasional breakout, assuming that it will trigger an impulsive move.
1️⃣No surprise, the first task of a breakout trader is the identification of key levels. Preferably, these levels should be spotted on weekly/daily time frames.
Here on US100, I executed structure analysis and identified key levels.
2️⃣Once key levels are spotted, a breakout trader should patiently wait for the test of one of those. His goal is to wait for a breakout.
In that step, many traders fail. The problem is that in order to confirm the breakout, one should have strict & reliable rules to follow. The rules that describe a confirmed breakout.
*I apply the following rule: the breakout of a level will be considered to be confirmed once the candle closes above/below the structure on the highest time frame where the structure is recognizable.
In the picture above, we see a confirmed key level breakout.
3️⃣Once the breakout is confirmed, the next step is to wait for a retest of a broken level. Why retest? Simply because a retest gives a better risk to reward ratio for the trade. And even though there is no guarantee that the price will retest the broken level and because of that some trading opportunities will be missed, in the long run, retest trading produces higher gains.
Following our example, the price has retested the broken level.
4️⃣Opening a trade on a retest, one should know the exact target levels. The levels where the profits will be taken. Again, newbies traders make a lot of mistakes on that step. Remember that your targets must be realistic, they must be based on closest strong structure levels, not on your desired returns.
5️⃣Also, a breakout trader should set a stop loss. And again, a stop-loss level must be safe, it must be set at least below/above a previous minor structure to protect you from stop-hunting.
Stop-loss reflects the point where the trader becomes wrong in his predictions and where the trading setup becomes invalid.
In our example, the safest stop loss will be below a local low. Take profit - next key resistance.
6️⃣Once the trading position is opened and stop-loss & take-profit are set, one should patiently wait. There is no guarantee that the price will start falling/growing sharply after the breakout. The market may start coiling for quite a long period of time before it starts acting.
Breakout trader must be patient, not allowing his emotions to intervene.
Returning to our example, after some time, the market easily reached the TP level and went much higher.
7️⃣Lastly, one should remember that his exit points are stop-loss/take-profit levels. Stop-loss adjustment in case of a position drawdown, preliminary profit-taking, and target extension are your worst enemies. Be disciplined, don't be greedy, and keep your emotions in check.
Here is the example of a breakout trade that I took following the strategy:
I spotted a confirmed breakout of a key resistance. The price formed a high momentum bullish candle and closed above the structure.
Long position was opened on a retest.
Target was based on the closest horizontal resistance.
Stop loss was placed below the closest horizontal support.
The market quickly reached the target.
Of course, this 7-steps trading plan is not sufficient enough for profitable breakout trading. There are so many nuances on each step of the plan to consider.
However, let this plan be your initial guideline: learn & follow that and with time, keep elaborating its rules until you become a consistently profitable trader.
Are you a breakout trader?
Let me know, traders, what do you want to learn in the next educational post?

KOPRAN - A SWING AS WELL AS POSITIONAL TRADEHELLO FRIENDS,
Here I am sharing my view on KOPRAN LTD (NSE) which is showing bullish bias on the chart.
The stock was in downtrend since December 2021 following the downtrend as Lower Highs and Lower Lows pattern but now the stock has broken this pattern and started doing Higher Highs and Higher Lows which depicts the change or trend to uptrend from downtrend.
It has given breakout of downward sloping Trendline in Weekly time frame.
All the supporting indicators as showing bullish bias on the chart of which snapshots are given below.
Weekly trendline breakout with good intensity of volume
In Daily Time Frame, Stock has given the breakout of FLAG and POLE Chart Pattern in which we calculate first target as same as the size of pole.
Price at the time of breakout is Challenging Upper Bollinger Band
Directional Movement Index is also showing strong Bullish Bias
Price is Trading above 50DEMA, 100DEMA and 200DEMA
MACD in Daily Time Frame - Positive Crossover
MACD in Weekly Time Frame - Positive Uptick
RSI in Daily Time Frame - Positive uptick and above 60 - a bullish sign
Conclusion-
overall stock is bullish on chart, one can enter this stock as swing or positional trade following strict Stop Loss.
Disclaimer-
I am not SEBI registered analyst.
My studies are for educational purpose.
I am not responsible for any kinds of your profits and losses.
please consult your financial advisor before investing your money.

gold after resultit is possible to catch this crazy moves guys lets trade easy it is all about knowing the right information look my other posts how it is easy to predict the market and enter early with out even waiting the breakout

universal cables breakout soon stocksUniversal cables a good rectangle pattern formation going .Breakout above 370 will give good move...

How to trade Breakout/Breakdown from consolidation pattern?1) What is a consolidation?
Consolidation means when the price of a stock or security moves sideways within a range.
In this pattern the price makes the same highs and/or same lows. The highs form a resistance level, and lows form a support level. The longer the consolidation is, the stronger the breakout/breakdown will be.
When the price is moving within the range you can not really predict if it will go up or down, you always have to wait for the breakout/down to enter the trade. Once the channel is broken it usually leads to a stronger up/downtrend.
Breakout
We are talking about Breakout pattern when the price that has been moving within the range of the consolidation pattern breaks above the previous resistance line. At this momentum,
when we have a confirmation candle, there is a high probability that it can be a start of a new uptrend, and we can enter the trade.
Breakdown
In case of a Breakdown, the price is moving downwards, and not only hit but breaks out of the support level. We need a confirmation candle to ensure that there is a high probability that bearish momentum will trigger the start of a new downtrend and it is a good time to enter short.
2) What are the valid consolidation patterns?
Consolidation pattern does not mean in every case that the price must make the same highs and the same lows at the same time. For a Breakout pattern from the consolidation we want to see a strong, flat top resistance line that is tested three times or more. The price can either make the same lows or higher lows.
On the other hand, when we are talking about a Breakdown from the consolidation, we are always looking for a strong support line that is tested at least three times before. In this case,
the consolidation pattern can be either making same highs or lower highs.
3) How to identify a Breakout/Breakdown momentum and which indicators to use?
We only want to enter the trade on a breakout/breakdown with a high probability of succeeding and for that we always want to see a confirmation candle after the price breaks above or below the range to avoid false breakouts. For a Breakout, the candle must be bullish and open and close above the resistance level and it must be near the 20EMA.
In case of a Breakdown the bearish candle body must open and close below the support line and the breakout candle must be near or touching the 20EMA.
Indicators (examples)
Force Index (13) measures the strength of the volume. When the Force Index is above the zero line, that tells you that the market is bullish. If the price goes under the line, the price is bearish. So, when we want to go long, make sure that the Force Index is above the signal line and it’s rising. When we want to sell, then the Force Index should be under the signal line and falling.
or
MACD (12,26,9) When the MACD line is above the signal line, it means that the momentum is bullish (good if you want to go long) if it goes under the signal line, means the market is bearish (great time to enter short).
