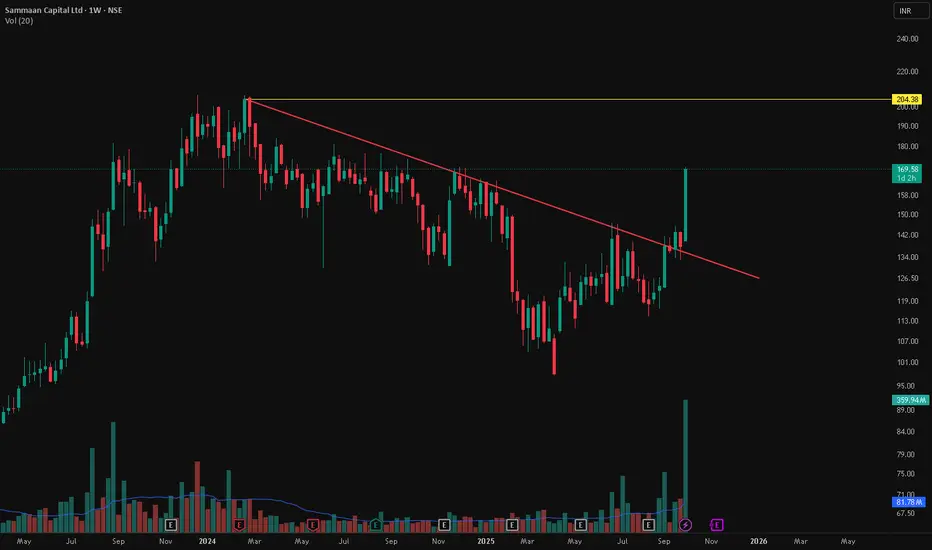
Sammaan Capital Ltd - Weekly Breakout📊 Sammaan Capital Ltd – Major Trendline Breakout with Volume Spike 🚀
📅 Chart Date: October 2, 2025 | Timeframe: Weekly
📍 CMP: ₹169.58 (+23.04%)
📈 Symbol: NSE:SAMMAANCAP
🔍 Technical Analysis
📉 Multi-Month Downtrend Broken
Stock has been consolidating under a falling trendline since late 2023.
This week, price gave a clean breakout above the trendline with a strong bullish candle.
💥 Volume Confirmation
Current Weekly Volume: 359.94M vs Avg 81.78M 🔥
Indicates strong institutional participation.
🟡 Key Resistance
Next major hurdle is ₹204.38 (previous swing high).
Sustained closing above this zone can open doors for higher levels.
📌 Key Levels
Immediate Support (Breakout Retest): ₹142–₹150
Resistance Zone: ₹204.38
Potential Next Targets: ₹220 / ₹250
Stop loss for Swing Trades: ₹135
Breakouttrading
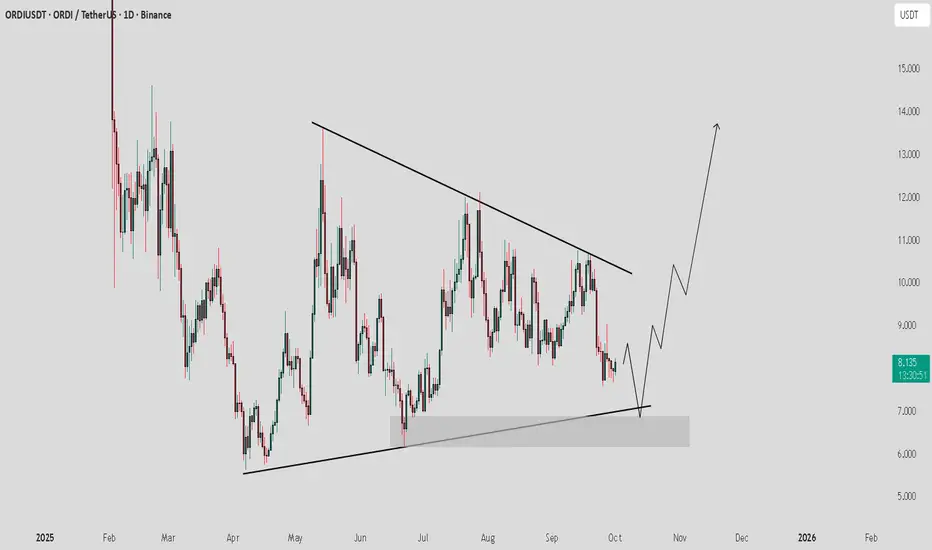
ORDI / USDT : Looking for a price to bounce back from supportORDI is moving towards support for a possible retest. If it holds and we see a bounce, a strong move can follow with breakout targets at $12–$15. The key level to watch is this support – as long as it holds, the setup remains valid. A breakdown below will invalidate the setup.
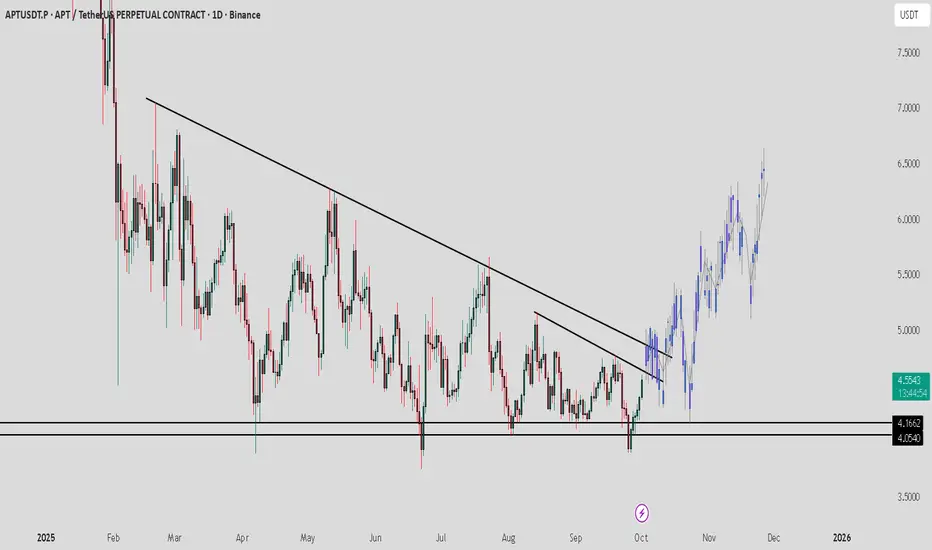
APT / USDT : Showing strong momentum for a strong rallyAPT/USDT Analysis
APT is building strong momentum and preparing for a potential breakout. Once it clears this level, we can expect a bullish rally towards $6 – $7 in the near term.
Always wait for confirmation before entering and manage risk wisely.
Bearish Reversal On Trendline BreakPrice is currently respecting an ascending trendline while approaching a resistance zone around 3872. If we see a confirmed breakout below the ascending trendline, it would indicate a potential reversal.
Short Entry Plan:
Trigger: Break and close below the trendline support
Confirmation: Strong bearish candle or retest rejection of broken trendline
Target: Drop towards the demand zone around 3840–3845, where previous bullish structure originated
Key Zones:
Resistance: 3868–3872
Demand Zone (Target): 3840–3845
A clean break could provide a high-probability short setup with favorable risk-to-reward. Always wait for confirmation and manage risk accordingly.

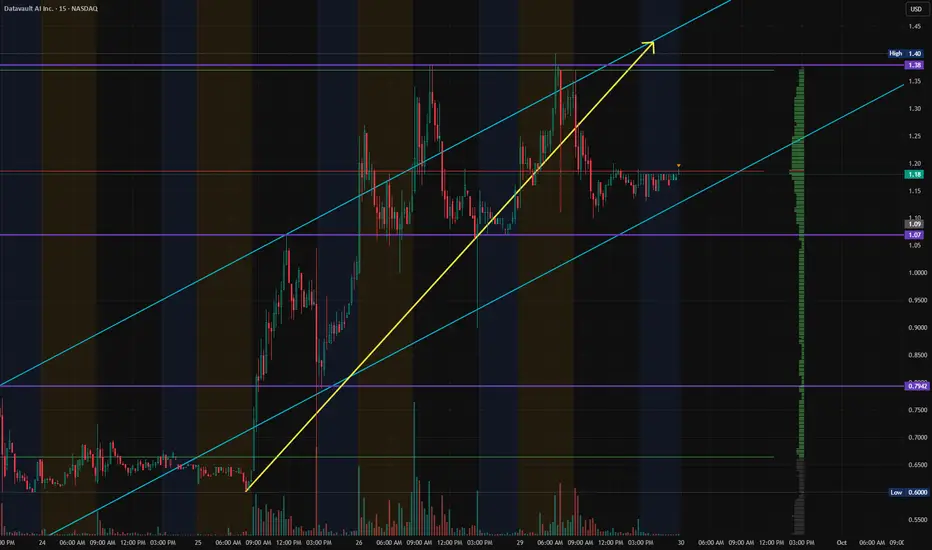
$DVLT - Datavault AI - $1.40 Retest?NASDAQ:DVLT (Datavault) has been consistently retesting the $1.40, consolidating back to the $1.10-$1.15 range of support, before loading up again after announcing NYSE:IBM multi-million commitment.
Break and hold support above the $1.38, and we could see this easily retest $1.74 and breakout further. Needs to hold that $1.38 first and foremost. Otherwise, consolidation.
Great news though, so we'll see!
Buy Sundaram Finance Holdings Ltd. Buy ₹634
target of ₹720
stoploss at ₹570
based on current technical setup and breakout from consolidation zone.

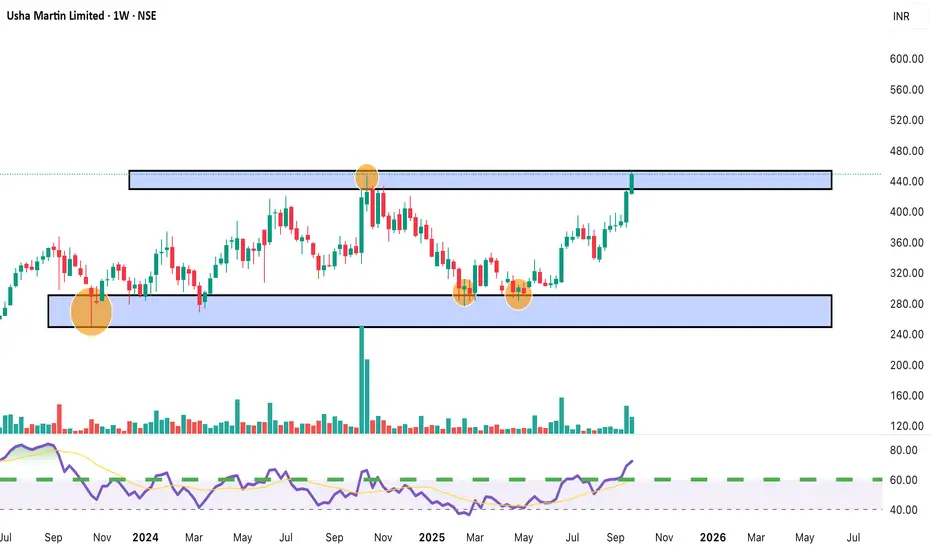
Usha Martin Ltd. (Weekly)✅ Buy above: ₹455 (weekly close above resistance zone)
🎯 Target: ₹490 / ₹520
🛑 Stoploss: ₹425
⚡ Key Level: Price testing multi-year resistance with RSI > 70.
Anant Raj Ltd. (Weekly)✅ Buy above: ₹685 (sustained breakout with volume)
🎯 Target: ₹729 / ₹800
🛑 Stoploss: ₹645
⚡ Key Level: Near 0.618 Fibonacci retracement + volume buildup.

Amazing breakout on WEEKLY Timeframe - SBINCheckout an amazing breakout happened in the stock in Weekly timeframe, macroscopically seen in Daily timeframe. Having a great favor that the stock might be bullish expecting a staggering returns of minimum 25% TGT. IMPORTANT BREAKOUT LEVELS ARE ALWAYS RESPECTED!
NOTE for learners: Place the breakout levels as per the chart shared and track it yourself to get amazed!!
#No complicated chart patterns
#No big big indicators
#No Excel sheet or number magics
TRADE IDEA: WAIT FOR THE STOCK TO BREAKOUT IN WEEKLY TIMEFRAME ABOVE THIS LEVEL.
Checkout an amazing breakout happened in the stock in Weekly timeframe.
Breakouts happening in longer timeframe is way more powerful than the breakouts seen in Daily timeframe. You can blindly invest once the weekly candle closes above the breakout line and stay invested forever. Also these stocks breakouts are lifelong predictions, it means technically these breakouts happen giving more returns in the longer runs. Hence, even when the scrip makes a loss of 10% / 20% / 30% / 50%, the stock will regain and turn around. Once they again enter the same breakout level, they will flyyyyyyyyyyyy like a ROCKET if held in the portfolio in the longer run.
Time makes money, GREEDY & EGO will not make money.
Also, magically these breakouts tend to prove that the companies turn around and fundamentally becoming strong. Also the magic happens when more diversification is done in various sectors under various scripts with equal money invested in each N500 scripts.
The real deal is when to purchase and where to purchase the stock. That is where Breakout study comes into play.
LET'S PUMP IN SOME MONEY AND REVOLUTIONIZE THE NATION'S ECONOMY!

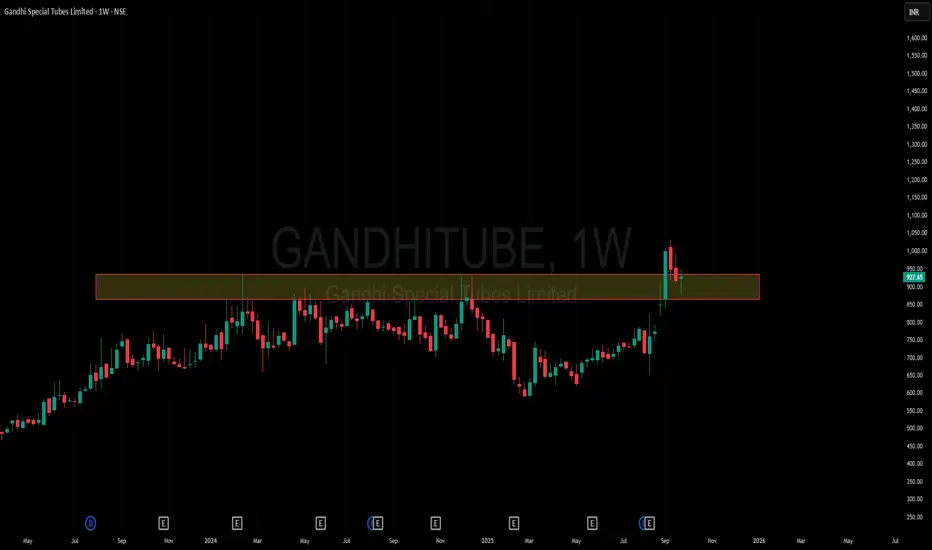
Amazing breakout on WEEKLY Timeframe - GANDHITUBECheckout an amazing breakout happened in the stock in Weekly timeframe, macroscopically seen in Daily timeframe. Having a great favor that the stock might be bullish expecting a staggering returns of minimum 25% TGT. IMPORTANT BREAKOUT LEVELS ARE ALWAYS RESPECTED!
NOTE for learners: Place the breakout levels as per the chart shared and track it yourself to get amazed!!
#No complicated chart patterns
#No big big indicators
#No Excel sheet or number magics
TRADE IDEA: WAIT FOR THE STOCK TO BREAKOUT IN WEEKLY TIMEFRAME ABOVE THIS LEVEL.
Checkout an amazing breakout happened in the stock in Weekly timeframe.
Breakouts happening in longer timeframe is way more powerful than the breakouts seen in Daily timeframe. You can blindly invest once the weekly candle closes above the breakout line and stay invested forever. Also these stocks breakouts are lifelong predictions, it means technically these breakouts happen giving more returns in the longer runs. Hence, even when the scrip makes a loss of 10% / 20% / 30% / 50%, the stock will regain and turn around. Once they again enter the same breakout level, they will flyyyyyyyyyyyy like a ROCKET if held in the portfolio in the longer run.
Time makes money, GREEDY & EGO will not make money.
Also, magically these breakouts tend to prove that the companies turn around and fundamentally becoming strong. Also the magic happens when more diversification is done in various sectors under various scripts with equal money invested in each N500 scripts.
The real deal is when to purchase and where to purchase the stock. That is where Breakout study comes into play.
LET'S PUMP IN SOME MONEY AND REVOLUTIONIZE THE NATION'S ECONOMY!
Amazing breakout on WEEKLY Timeframe - CHEMCONCheckout an amazing breakout happened in the stock in Weekly timeframe, macroscopically seen in Daily timeframe. Having a great favor that the stock might be bullish expecting a staggering returns of minimum 25% TGT. IMPORTANT BREAKOUT LEVELS ARE ALWAYS RESPECTED!
NOTE for learners: Place the breakout levels as per the chart shared and track it yourself to get amazed!!
#No complicated chart patterns
#No big big indicators
#No Excel sheet or number magics
TRADE IDEA: WAIT FOR THE STOCK TO BREAKOUT IN WEEKLY TIMEFRAME ABOVE THIS LEVEL.
Checkout an amazing breakout happened in the stock in Weekly timeframe.
Breakouts happening in longer timeframe is way more powerful than the breakouts seen in Daily timeframe. You can blindly invest once the weekly candle closes above the breakout line and stay invested forever. Also these stocks breakouts are lifelong predictions, it means technically these breakouts happen giving more returns in the longer runs. Hence, even when the scrip makes a loss of 10% / 20% / 30% / 50%, the stock will regain and turn around. Once they again enter the same breakout level, they will flyyyyyyyyyyyy like a ROCKET if held in the portfolio in the longer run.
Time makes money, GREEDY & EGO will not make money.
Also, magically these breakouts tend to prove that the companies turn around and fundamentally becoming strong. Also the magic happens when more diversification is done in various sectors under various scripts with equal money invested in each N500 scripts.
The real deal is when to purchase and where to purchase the stock. That is where Breakout study comes into play.
LET'S PUMP IN SOME MONEY AND REVOLUTIONIZE THE NATION'S ECONOMY!

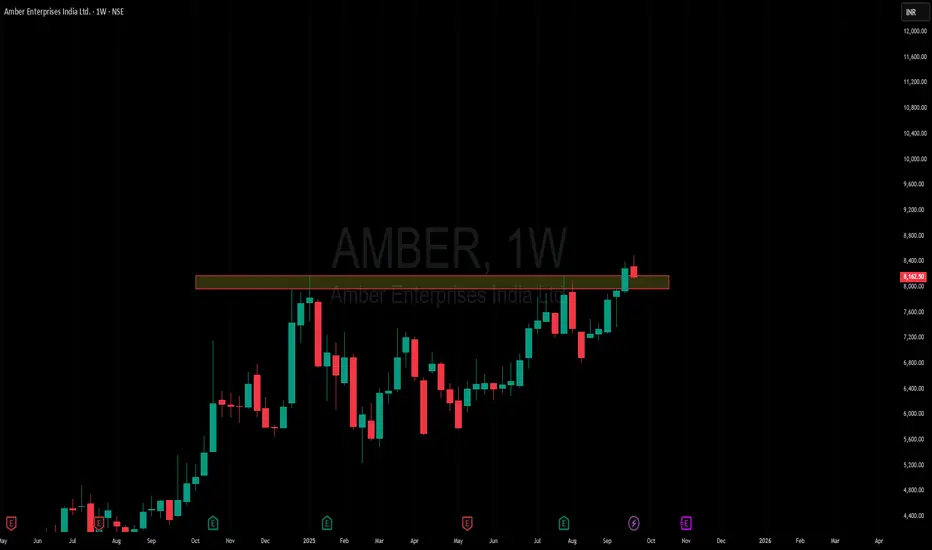
Amazing breakout on WEEKLY Timeframe - AMBERCheckout an amazing breakout happened in the stock in Weekly timeframe, macroscopically seen in Daily timeframe. Having a great favor that the stock might be bullish expecting a staggering returns of minimum 25% TGT. IMPORTANT BREAKOUT LEVELS ARE ALWAYS RESPECTED!
NOTE for learners: Place the breakout levels as per the chart shared and track it yourself to get amazed!!
#No complicated chart patterns
#No big big indicators
#No Excel sheet or number magics
TRADE IDEA: WAIT FOR THE STOCK TO BREAKOUT IN WEEKLY TIMEFRAME ABOVE THIS LEVEL.
Checkout an amazing breakout happened in the stock in Weekly timeframe.
Breakouts happening in longer timeframe is way more powerful than the breakouts seen in Daily timeframe. You can blindly invest once the weekly candle closes above the breakout line and stay invested forever. Also these stocks breakouts are lifelong predictions, it means technically these breakouts happen giving more returns in the longer runs. Hence, even when the scrip makes a loss of 10% / 20% / 30% / 50%, the stock will regain and turn around. Once they again enter the same breakout level, they will flyyyyyyyyyyyy like a ROCKET if held in the portfolio in the longer run.
Time makes money, GREEDY & EGO will not make money.
Also, magically these breakouts tend to prove that the companies turn around and fundamentally becoming strong. Also the magic happens when more diversification is done in various sectors under various scripts with equal money invested in each N500 scripts.
The real deal is when to purchase and where to purchase the stock. That is where Breakout study comes into play.
LET'S PUMP IN SOME MONEY AND REVOLUTIONIZE THE NATION'S ECONOMY!
sportking technical breakout gain 30% sportking technical breakout gain 125 is major support and tgt is 30% gain at cmp price , cmp price is 132.65, please check

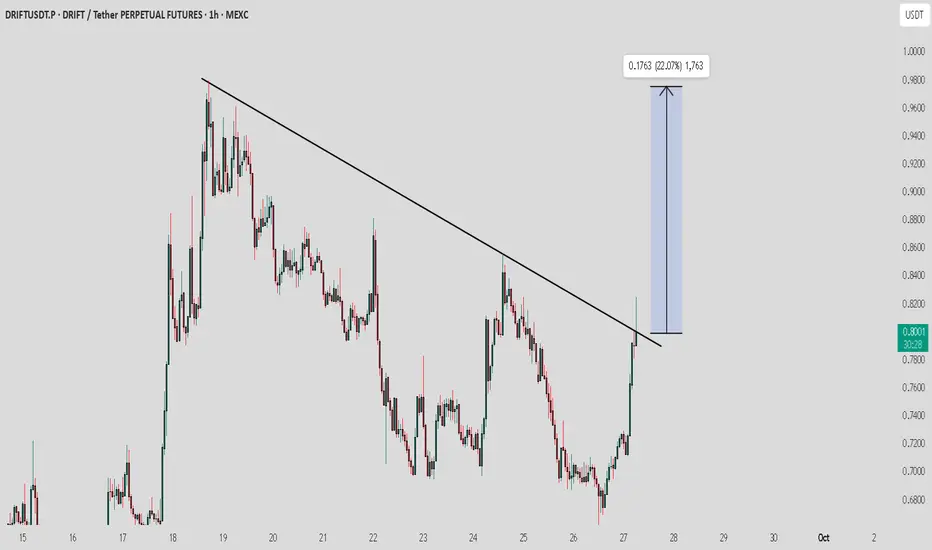
DRIFT / USDT : Trying to breakout with potentialDRIFT / USDT is breaking out from trend line resistance with strong potential. If momentum holds, we could see a sharp short-term rally of 20–30%.
Always manage risk properly and wait for confirmation of the bullish move.
Is this a platinum breakout?Using a weekly chart of a platinum ETF.
Breaking out above it's triangle pattern. Needs confirmation though or retrace in the next coming months

GUTS - Fractyl Health - $1.38 Breakout - $2.55 PTNASDAQ:GUTS broke above a $1, hitting $1.38 before consolidating. NASDAQ:GUTS is currently breaking a long-term downward channel it's been trading in since Apr 2024. We need to see support above $1.14 to push past the $1.37 - $1.47 Resistance Levels, looking for a $2.55 PT / Retest based on the comany stated: Trial Results Support Revita as First Therapy for Post-GLP-1 Weight Maintenance; Shares Rise Pre-Bell

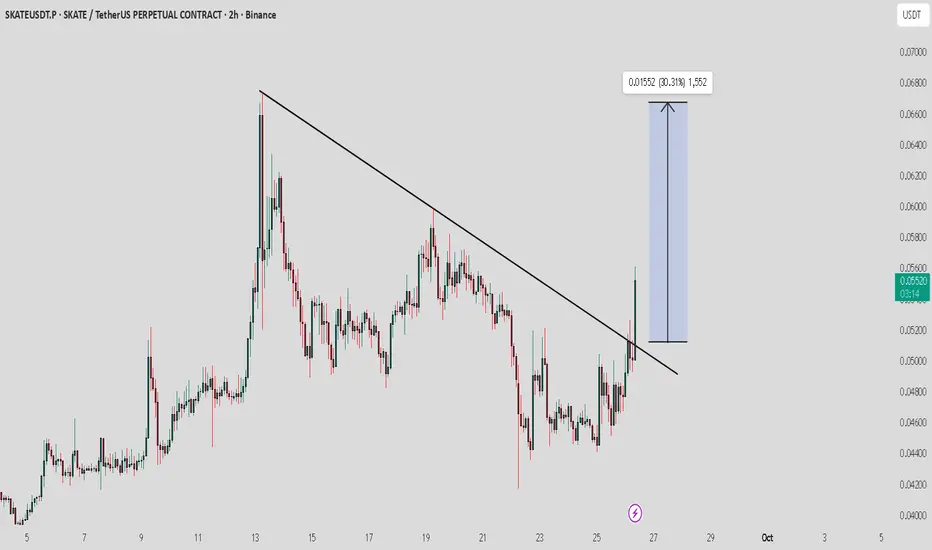
SKATE / USDT : Breaking out with strong potentialSKATE is breaking out from trend line resistance with strong potential. If momentum holds, we could see a sharp short-term rally of 20–30%.
Always manage risk properly and wait for confirmation of the bullish move.
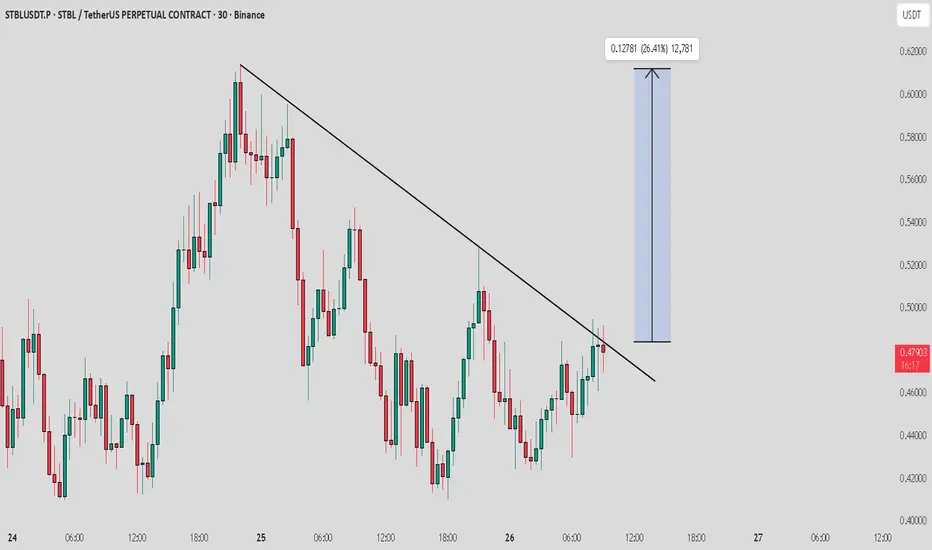
STBL / USDT : Short term rally expected if breakout doneSTBL / USDT is attempting to break out from trend line resistance. Keep it on your watchlist—if the breakout confirms, we can expect a strong short-term rally.
Always wait for confirmation before entering and manage risk properly.
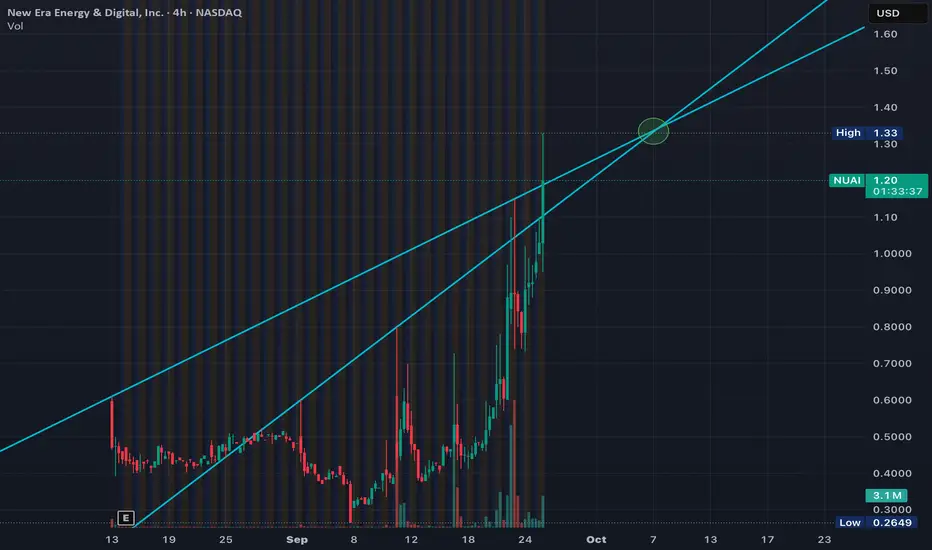
$NUAI - New Era Energy - $1.33 Breakout PointNASDAQ:NUAI broke $1 this morning, hitting $1.33 before slightly consolidating after Market Open. Looking for a continuation into a $1.33 retest and breakout after the company announced that its advancing its development of its Texas Data Center Venture for 1 Gigawatt Power Capacity.
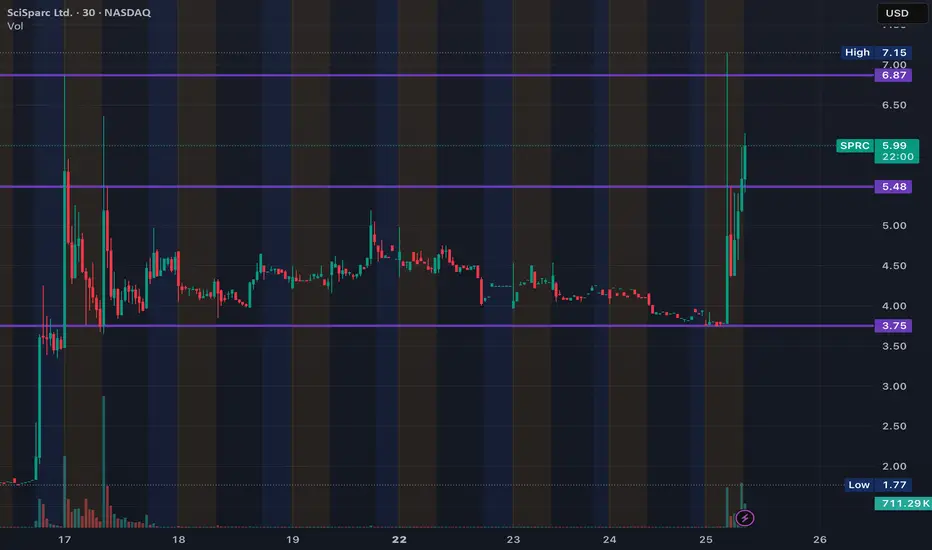
$SPRC - SciSparc - $5.47 Breakout - $10.45 RetestNASDAQ:SPRC bounced off the $3.75 support and hit $7.15, retesting the $6.87 levels of resistance. Looking to find support on the $5.47 levels to continue breaking that $6.87 and pus to retest the $10.45s after announcing plans to launch a quantum computer ting 3D protein modeling initiative.
$EVAX - Evasion - $5.52 Resistance? $8.92 Retest?NASDAQ:EVAX broke out this morning $5.52 and is showing signs of potentially consolidating after announcing licensing for its EVX-83 Vaccine Candidate to Merck for $7.5 Million Cash Payment, up to $592 Million in Milestones and Royalties on Sales.
If we could get past that $5.52 Level of Resistance and blow through $6, we would be targeting an $8.92 Retest and consolidation at that point.

US100 M30 – Sideway at the Top - Short OpportunityThe CAPITALCOM:US100 index has experienced a strong upward move on the 30-minute chart, pushing price to a new high around the 24,800 – 24,850 zone. However, recently, price has been moving sideways within a narrow range, forming a consolidation phase near this key resistance area. This sideways action signals a potential short-term correction or trend reversal.
📉Technical Analysis:
Current Sideways Zone: Price is consolidating between approximately 24,800 and 24,850, repeatedly testing this resistance but failing to break through decisively.
Key Support Level: The 24,650 – 24,700 zone is acting as critical support, holding price during this consolidation.
Support Break Signal: A close below the 24,650 – 24,700 support range would confirm the start of a downtrend and signal a likely bearish move.
📊 Trading Plan
Sell on Support Break: If price closes below the 24,650 – 24,700 support zone, consider entering a short position targeting the next strong support area near 24,400 – 24,350 .
Sell on Retest of Sideways Zone:
After breaking support, if price pulls back to retest the sideways zone (24,800 – 24,850) and shows bearish rejection signals (e.g., pin bar, bearish engulfing), this provides a good opportunity to enter or add to short positions.
⚠️Risk Management:
Stop-loss: Place above the sideways resistance area, around 24,860 – 24,870 , to avoid false breakouts.
Take profit: Consider partial profit-taking near 24,650 – 24,700 and final targets around 24,400 – 24,350.
Wait for Confirmation: Avoid entering trades without clear support breaks or bearish rejection signals to minimize risk.
Please like and comment below to support our traders. Your reactions will motivate us to do more analysis in the future 🙏✨

$JZXN - Jiuzi Holdings - $4 PTNASDAQ:JZXN jumped from $0.78 to $3.13 going into today's trading session. Looking for support at the $2.53 to push and hold above the $3 Price Levels to push on to our $4 PT.
This comes after announcing a new Chief Financial Officer and beginning a $1B Investment Strategy into Crypto
