BRETT/USDT — Approaching the Break Point: Breakout or BreakdownBRETT/USDT is approaching one of its most critical zones of the entire downtrend structure. After months of sustained bearish pressure under a persistent descending trendline, the market is now forming a large falling-wedge compression, a pattern that often precedes strong trend reversals when a breakout is confirmed.
The chart shows a clear dynamic:
Price continues to respect the descending resistance, while the lows begin stabilizing around a gradually flattening support zone. As these two structures narrow, the market is essentially coiling, building pressure before releasing its next major directional move.
The key level to watch is 0.02120.
This isn’t just another resistance—it's the decision point that separates a continuation of the downtrend from the first true structural shift toward bullish territory.
A confirmed daily close above 0.02120, ideally supported by a volume expansion, would mark the first legitimate breakout from the multi-month wedge. If this happens, BRETT opens a wide path toward a series of upside targets:
0.02550 → 0.03050 → 0.03850 → 0.04800 → 0.05600.
Each of these levels represents both structural and psychological checkpoints where momentum tends to accelerate once the wedge breaks.
However, as long as price remains below 0.02120, bears still have control. A strong rejection at this level could trigger renewed sell pressure, dragging price back toward the mid-support zone at 0.013–0.014, or even a retest of the major low around 0.01101 if sentiment weakens.
BRETT is now in its compression phase, often the calm before a significant move. Conservative traders will wait for a confirmed breakout, while aggressive price-action traders may already be watching for early signals in volume and candle structure.
In short:
The market is quiet—
not because it's dead, but because it's preparing for a major decision.
And that decision will be dictated by the battle around 0.02120.
---
Bullish Scenario
If 0.02120 breaks with confirmation:
Trend shifts from bearish → neutral → bullish.
Targets unlock sequentially: 0.0255 → 0.0305 → 0.0385 → 0.0480 → 0.0560.
Expect momentum acceleration as the wedge breakout gains participation.
Validation: strong daily candle close + higher-than-average 7-day volume.
---
Bearish Scenario
If 0.02120 rejects strongly:
Market falls back into distribution.
Downside targets: 0.014 → 0.011.
A breakdown below 0.011 may create new cycle lows and extend the bearish trend.
#BRETT #BRETTUSDT #CryptoAnalysis #BreakoutWatch #FallingWedge #PriceAction #TrendReversal #KeyLevels #CryptoOutlook #MarketStructure
Brettusdc

BRETT/USDT — Is This the End of the Long Downtrend?The 3D chart of BRETT/USDT is currently sitting at a critical juncture — right where a major horizontal support zone meets a long-term descending trendline.
This setup reflects the classic “moment of truth” in technical analysis — a key crossroads between a potential trend reversal or a continuation of bearish momentum.
At the time of analysis, the price is around 0.02639 USDT, positioned inside the strong demand zone at 0.022–0.0265, which has historically acted as a major accumulation area. The long wick down to 0.01101 indicates a possible liquidity sweep — a typical signal that weak hands have been flushed out, often followed by a relief rally or reversal phase.
However, the descending trendline continues to act as a strong dynamic resistance, compressing every attempt of upward momentum. As long as this trendline holds, sellers remain in control — but the persistence of this support zone suggests the potential for a major reversal base.
---
Pattern & Structure Overview
Main Pattern: Descending Triangle — lower highs compressing against a flat support line. While this pattern traditionally leans bearish, a failed breakdown from it can trigger a strong bullish reversal.
Liquidity Sweep (0.011): A deep wick likely cleared stop-loss clusters, meaning liquidity below support may already be exhausted.
Descending Trendline: Acts as the psychological “barrier” — a clean breakout above it could trigger a short squeeze.
Momentum: Seller pressure is slowing down near the support area; watch for increasing volume as a sign of accumulation.
---
Bullish Scenario (Reversal Potential)
If buyers continue to defend the 0.022–0.0265 zone, the market could be forming a structural bottom.
A bullish confirmation would require:
1. A clear break and 3D close above the descending trendline (around 0.03866).
2. A visible increase in trading volume, signaling strong buying participation.
3. Formation of a higher low above 0.026, confirming a shift in market structure.
Bullish Targets:
0.03866 → first breakout target
0.06305 → medium-term resistance
0.07784 → confirmation of full reversal
0.15278+ → potential expansion target if bullish momentum extends
---
Bearish Scenario (Breakdown Continuation)
If the price fails to hold above 0.022, especially with a confirmed 3D or weekly close below it:
Expect a continuation of the current distribution phase.
The market could retest the liquidity area near 0.011, or even form new lows if sell volume spikes.
Bearish Targets:
0.017–0.013 → potential short-term reaction zone.
Below 0.011 → opens the door for a deeper capitulation phase.
---
Conclusion
BRETT is currently standing on its final line of defense.
The 0.022–0.0265 zone is not just a regular support — it’s the stronghold for bulls and a potential entry point for smart money accumulation.
A breakout above the trendline could mark the beginning of a major trend reversal, while a breakdown below support could confirm a new leg down.
Given the current structure, BRETT is one of the most technically interesting assets to watch in the upcoming quarter — both for swing traders and long-term players.
---
#BRETT #CryptoAnalysis #MarketReversal #TrendlineBreak #CryptoTrading #SupportZone #BreakoutSetup #Downtrend #TechnicalAnalysis #SwingTrade #SmartMoney #LiquiditySweep

BRETT/USDT — Triangle: Market Compression Before a Big Breakout?🔎 Pattern Analysis
BRETT/USDT is currently trading inside a contracting triangle (descending resistance + flat/rising support). This pattern shows:
Lower Highs: sellers consistently pressing the price lower.
Higher Lows / Flat Support: buyers holding the floor strongly.
The market is in a “pressure cooker” phase — volatility is shrinking, and once price escapes, the move is usually explosive.
Technically, a symmetrical triangle is neutral, but since the prior trend was bearish, probabilities lean slightly bearish unless a breakout to the upside is confirmed with strong volume.
---
📈 Bullish Scenario
If price breaks upward:
1. Trigger: 2D candle close above 0.05617 with strong volume.
2. Healthy Retest: price pulls back to confirm support and then bounces.
3. Upside Targets:
TP1: 0.06472 (+44%)
TP2: 0.07961 (+77%)
TP3: 0.09073 (+102%)
TP4: 0.11532 (+156%)
TP5 (measured move / extension): 0.130–0.150 (strong momentum case).
4. Psychology: breakout means buyers take control, and if BTC/ETH are stable or bullish, momentum could accelerate.
---
📉 Bearish Scenario
If price breaks downward:
1. Trigger: 2D candle close below 0.038–0.040 with strong volume.
2. Failed Retest: price retests support turned resistance and rejects.
3. Downside Targets:
TP1: 0.03400
TP2: 0.03000
TP3: 0.02340 (major low, nearly −48% downside).
4. Psychology: breakdown signals capitulation — sellers dominate while buyers step aside.
---
🎯 Measured Move
Applying the height of the triangle gives a projected target:
Upside breakout: 0.11 – 0.13
Downside breakdown: 0.023 – 0.025
---
⚖️ Risk & Money Management
Confirmation is key: wait for a 2D close + volume, not just intraday wicks.
Stop Loss:
For longs → below triangle support / under 0.039.
For shorts → above triangle resistance / above 0.056.
Risk/Reward: aim for at least 1:2 before entering.
Position sizing: risk only 1–2% of total capital per trade.
---
🚨 Key Catalysts to Watch
1. Bitcoin & Ethereum trend: if BTC dumps, alts usually follow.
2. Liquidity/volume: thin order books risk false breakouts.
3. News/events: project updates, listings, or partnerships can be catalysts.
4. Macro market: US equities, Fed policy, and the Dollar Index (DXY) often influence crypto capital flows.
---
📝 Summary
BRETT/USDT is compressing inside a 2D contracting triangle, and volatility is set to expand.
Bullish trigger: 2D close >0.05617 + volume → targets 0.0647 / 0.0796 / 0.0907 / 0.115–0.13.
Bearish trigger: 2D close <0.038–0.040 → targets 0.034 → 0.030 → 0.0234.
Golden rule: wait for confirmation (2D close + strong volume) to avoid false breaks.
This setup provides a clear trading map with defined upside/downside levels, offering opportunities in both directions.
---
#BRETT #BRETTUSDT #Crypto #Altcoin #TechnicalAnalysis #TrianglePattern #Breakout #SupportResistance #CryptoTrading
BRETTUSDT – Symmetrical Triangle Breakout!BRETTUSDT has been consolidating within a symmetrical triangle for several months, showing strong compression between ascending support and descending resistance. Recently, price action has started to break above the resistance trendline, signaling a possible bullish continuation. With moving averages turning supportive and volume profile showing a low-resistance zone above, this breakout could trigger a strong move higher.
Key Points:
- Pattern: Symmetrical triangle consolidation since April.
- Support: Strong base around 0.045 USDT (stop-loss zone).
- Resistance Breakout: Price breaking above 0.058 level.
- Volume Profile: Thin liquidity gap above, could accelerate upside.
- Target Zone: 100%-200% move in midterm
- Moving Averages: Price reclaiming 50 & 100 EMA, confirming bullish momentum.
Cheers
Hexa
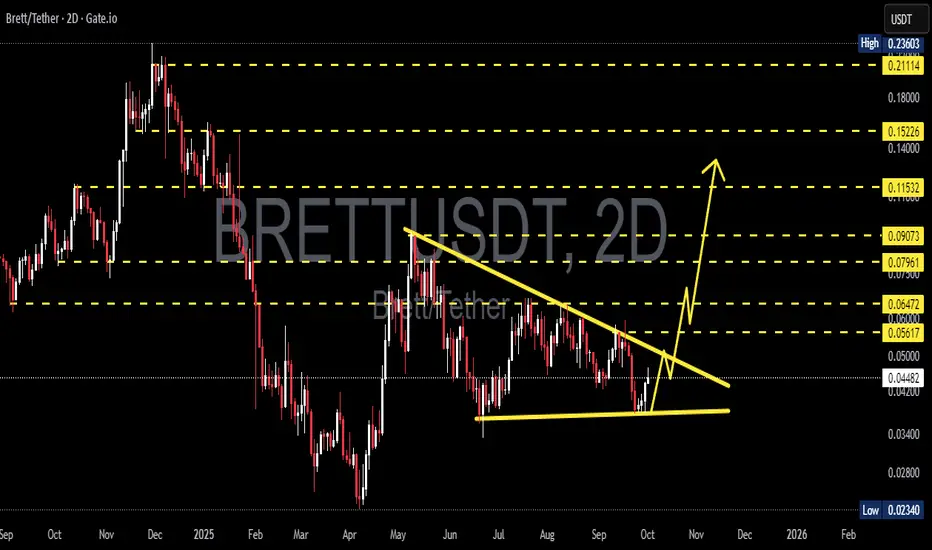
BRETT/USDT — End of Consolidation, Beginning of a Big Move?BRETT/USDT is currently forming a symmetrical triangle pattern on the Daily timeframe (1D). This structure is shaped by lower highs (selling pressure) and higher lows (buying pressure), which are now converging near the apex zone (0.049–0.064). As price approaches the tip of the triangle, volatility often expands sharply, leading to a major directional breakout.
---
🔹 Pattern & Key Levels
Pattern: Symmetrical Triangle (neutral — can break either way).
Strong Support: 0.045 – 0.049
Key Resistance: 0.064
Major Horizontal Levels:
0.091 → mid resistance
0.115 → strong resistance
0.152 → psychological zone
0.211 – 0.236 → previous highs
Lower Supports: 0.037 / 0.031 / 0.026 / 0.023
---
🚀 Bullish Scenario
1. Breakout confirmation if daily close happens above 0.064 with strong volume.
2. A successful retest of 0.064 as support will further strengthen the bullish setup.
3. Upside targets:
TP1 = 0.091
TP2 = 0.115
TP3 = 0.152
Measured move projection (long-term potential) = ~0.277
4. Stop-loss idea: below 0.049 or under the lower trendline.
---
🔻 Bearish Scenario
1. Breakdown confirmation if daily close happens below 0.045.
2. Failed retest of 0.045–0.049 as resistance would confirm further downside.
3. Downside targets:
TP1 = 0.037
TP2 = 0.031
TP3 = 0.026
Final strong support = 0.0234
4. Stop-loss idea: above 0.058–0.064 (upper trendline zone).
---
⚖️ Conclusion
BRETT/USDT is approaching a critical decision zone. The symmetrical triangle shows market compression — pressure is building up for a powerful breakout.
A bullish breakout above 0.064 could fuel a rally toward 0.091 – 0.152 and potentially higher.
A bearish breakdown below 0.045 may trigger a correction toward 0.026 – 0.023.
Best strategy: Wait for breakout confirmation with daily close + volume, apply strict stop-losses, and take profits step by step at key levels.
#BRETTUSDT #BRETT #AltcoinAnalysis #CryptoBreakout #TechnicalAnalysis #SymmetricalTriangle #ChartPattern #CryptoTA #SupportResistance

BRETT/USDT Poised for Explosive Breakout from SymmetricalThe crypto market is heating up again, and BRETT/USDT is showing one of the most promising technical setups right now. The pair is approaching a critical breakout point from a well-defined Symmetrical Triangle, signaling that a major move may be imminent.
🧠 Technical Pattern: Symmetrical Triangle – Price Compression at Its Peak
Since February 2025, BRETT/USDT has been consolidating inside a Symmetrical Triangle – a classic neutral pattern that often precedes explosive moves.
Key Characteristics:
Lower highs & higher lows: A sign of price compression and indecision
Trendline convergence: A breakout or breakdown is imminent
Decreasing volume: A textbook pre-breakout condition
Currently, the price is trading around $0.05595, right near the triangle’s resistance line – putting it at a make-or-break moment.
✅ Bullish Scenario – Breakout and Rally
If the price breaks out above the triangle resistance with strong volume and a daily candle close, we could witness a rapid rally toward multiple key resistance levels:
📈 Bullish Targets:
1. $0.06652 – Initial breakout confirmation
2. $0.09045 – Minor horizontal resistance
3. $0.11496 – Mid-term resistance level
4. $0.15515 – Historical supply zone
5. $0.21254 – $0.23603 – Full pattern target and previous local high
🚀 From the current price, this breakout could deliver over +300% upside if momentum holds.
Indicators like RSI, MACD, and Volume Spike confirmation can act as supporting evidence for entry.
❌ Bearish Scenario – Breakdown and Continuation
On the flip side, failure to break out and a drop below the lower support trendline could signal a bearish continuation of the previous downtrend.
📉 Bearish Targets:
$0.04000 – Minor support level
$0.02340 – Cycle low & strong horizontal support
🔻 Such a breakdown would invalidate the bullish setup and may lead to prolonged consolidation or further downside.
🧩 Summary & Market Insight
BRETT/USDT is at a highly pivotal technical level. The symmetrical triangle pattern suggests that a major breakout or breakdown is imminent, and the reward-to-risk ratio is very attractive for both swing traders and position traders.
📌 Trading Strategy Suggestions:
Bullish: Enter on confirmed breakout above triangle with volume; stop-loss below previous support.
Bearish: Watch for breakdown with volume; consider short targets or wait for new support to form.
Always apply proper risk management and consider using trailing stops in case of strong continuation.
#BRETTUSDT #CryptoBreakout #AltcoinAnalysis #SymmetricalTriangle #CryptoTechnicalAnalysis #Altcoins #BreakoutSetup #CryptoTraders #CryptoMarketUpdate

$BRETT Breakout Watch Descending channel breakout on $BRETT!
The price is now retesting and holding above the trendline with EMA support. The bullish structure is in play! 📈
🎯 Targets:
• TP1: $0.0912
• TP2: $0.1078
• TP3: $0.1291
🛑 SL: $0.0634
📌 Entry: Around $0.0738–$0.076 zone

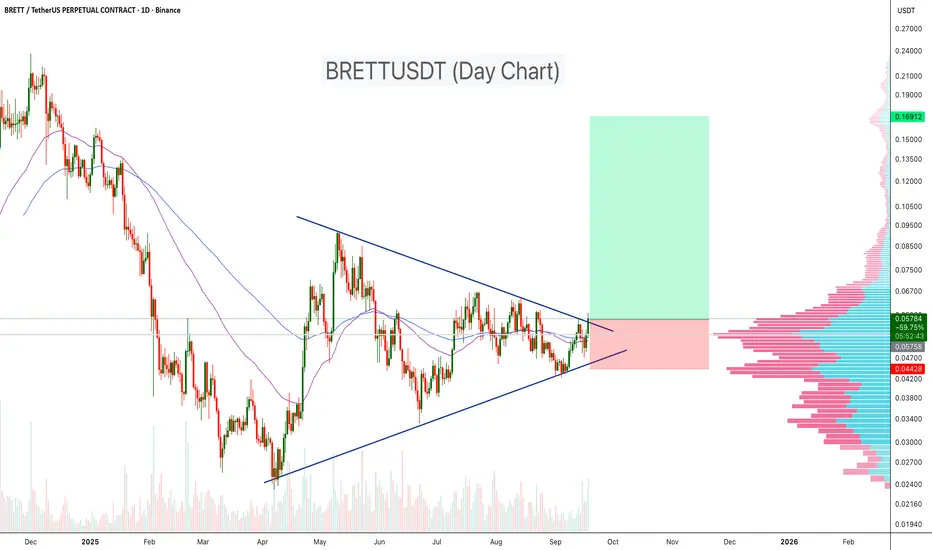
Brett (BRETT/USDT) TECHNICAL ANALYSIS + PRICE PREDICTIONTechnical Analysis by Blaž Fabjan
Price Movement:
The asset shows a clear downtrend, followed by a short period of consolidation, and it is now breaking through a resistance level.
There is a marked bullish pattern, indicated by the breakout from a flag/pennant formation (shown by the blue upward line). This is often a continuation pattern signaling that the prior trend may resume after the consolidation.
Resistance Level:
There is a horizontal resistance line that has been marked. The price seems to be challenging this resistance after breaking out of a small downward consolidation channel (the flag pattern).
Indicators:
VMC Cipher B Divergences: This indicator shows a bullish divergence (green dots). The blue wave in the oscillator indicates increasing bullish momentum, which supports the potential for an upward move.
RSI (14): The RSI stands at around 52.62, showing neutral to slightly bullish conditions. This leaves room for a potential upward move without being in overbought territory.
Stochastic RSI (14,3): The Stoch RSI is currently at 62.37, showing that there might be a slight pullback in the short term, but overall, it is still in a favorable range for buying as it is not overbought.
Trading Plan:
Entry:
Based on the breakout above the resistance line and the upward momentum, the chart marks a "good buy option" point right after the breakout of the downward consolidation channel.
An entry around the current price of 0.0880 USDT would align with this technical signal, as it is near the breakout zone.
Stop Loss:
A safe stop loss could be placed just below the recent consolidation low at around 0.0700 USDT. This level would invalidate the bullish setup if the price were to fall below it.
Take Profit:
The target for this move could be aligned with the previous swing highs. The chart suggests a potential move toward the 0.1000 USDT level, which could be a conservative take-profit point based on the prior trend.
If momentum continues strongly, the next possible target could be at 0.1100 USDT.
Risk/Reward Ratio:
Entry at 0.0880 USDT, stop loss at 0.0700 USDT, and take profit at 0.1000 USDT gives a risk/reward ratio of approximately 1:2, which is a reasonable trade setup.
Conclusion:
This chart suggests a potential short-term bullish opportunity for BRETT/USDT, particularly if the breakout is sustained. Based on the current indicators, a pullback could be expected, but the overall trend points towards upward momentum, making it a good buying opportunity if proper risk management is applied.

MEME - BRETT Cyclic value low BRETT as far as meme coins as been dubbed the new PEPE ,. Doing an analysis on BRETT the Fundamentals show there has been alot of hype and buzz around brett and a whole plethora of supporting coins of cars dogs and fish of bretts are all popping up on base increasing by ridiculous valuations overnight, Hype drives speculation and in terms of meme coins the Value, purly based on speculation requires the FOMO and HYPE to drive its valuation to increase
If we focus on Trends
we are following a main channel in a sine wave pattern and we have defined a clear 12345 super major wave
