ETH — Price Slice. Capital Sector. 1652.34 BPC 16© Bolzen | The Architect | BPC Framework
Bolzen Market Institute
🏷 ETH — Price Slice. Capital Sector.
Publication date on TradingView: 13.02.2026
🏷 1652.34 — at the time of publication, the price had not been reached.
🏷 BPC — The Bolzen Price Covenant — Strength Index: 16
The energy block reflects the intentions of capital. The direction of capital flow is determined dynamically. The key mechanism of liquidations lies in the tendency of price to gravitate toward areas where real participants of the system are concentrated — regardless of whether they are in longs or shorts.
Such zones represent areas of asymmetric advantage: when the price approaches them, some participants are forced to close positions at a loss, others lock in profits, and a third group (institutional players) uses this flow to enter in the direction of the next concentration zone.
Institutional players generate energy blocks through miners. Subsequently, these energy blocks form the range of capital movement across various timeframes for exchange speculators. However, the ultimate goal in ensuring liquidity is to reach the energy block mark.
The results are presented in the dashboard for the international arena. It is necessary to manually determine, without third-party software, the direction of the impact node and the concentration of real system participants. This is achieved through high cognitive and intellectual effort — without templates and solely through pure chart analysis.
Three-dimensional analytics is intellectual property. The methodology is closed and does not require evaluation from the standpoint of the old world. We offer the ability to think but do not provide trading recommendations and are not educators.
We thank you and regard TradingView as an impartial platform for demonstrating the transition into a new analytical reality.
Quantum structure of obligations and capital movement in price formation within energy blocks.
🏷 Vertical chart — Energy Grid Dashboard.
🏷 Static tape No. 1: The price is published according to the production order of the energy block.
🏷 The energy block price is already ordered — not by time but by the priority of block execution. It is important not to confuse: block priorities dynamically reorganize in response to hidden energetic impulses, while the execution order of prices fixes their manifestation in the market. Each price in the dynamic tape is linked to energy production measurement indicators, unavailable to the general public. Those who see the structure before its manifestation do not follow the price — they anticipate it.
EΞ2Φ8Ψ45Θ·ζ⁻¹·106Λ732·Ω²
📎 Screenshot:
🏷 When trading from levels, use liquidation zones from BPC 10 and higher.
🏷 Bolzen Liquidity Map — ETH (numerical equivalent of the map):
Updated versions of the Bolzen Liquidity Map — ETH are in restricted access.
The permanent Energy Grid Dashboard for ETH and BTC is publicly available and intended for international institutional review.
Dear international community,
I thank the TradingView moderation for their neutrality and support of analytical work on a global scale, as well as everyone who follows my research. This platform serves as a space to demonstrate the contribution to analytical development.
Attention and time are your key resources. ATH — is emotion; timeframes — are your best allies. Thank you.
— The Architect
BPC — The Bolzen Price Covenant
Btc!

BTC Structure Update — No ChangeStructure remains under pressure.
On the daily BTCUSD chart, price continues to trade below the 20 / 50 EMA stack, with the 50 EMA sloping downward and acting as dynamic resistance. Recent candles are attempting a minor rebound, but no structural reclaim has occurred.
What remains unchanged:
• Lower highs remain intact
• Price is still below key moving averages
• RSI remains suppressed in the lower range
• ROC is negative despite short-term stabilization
This is digestion — not reversal.
Counter-trend bounces are normal following impulsive downside movement. What matters is whether price can reclaim and sustain above the 50 EMA with momentum confirmation.
Until that occurs, structure remains defensive.
No regime shift.
No bias shift.
Just continued pressure with minor counter-trend movement.
Structure > Emotion.

Bitcoin shorts playing out as expected...Protect the gainsLower highs and lower lows remain intact. The recent bounce formed a bear flag into supply and got rejected, confirming sellers are still in control short term.
Price is below key moving averages and heavy volume sits overhead, acting as resistance.
Unless structure is reclaimed and price pushes back above prior value, rallies look corrective.
For now, downside pressure remains until proven otherwise.

ETH — Price Slice. Capital Sector. 1663.24 BPC 8.1© Bolzen | The Architect | BPC Framework
Bolzen Market Institute
🏷 ETH — Price Slice. Capital Sector.
Publication date on TradingView: 12.02.2026
🏷 1663.24 — at the time of publication, the price had not been reached.
🏷 BPC — The Bolzen Price Covenant — Strength Index: 8.1
The energy block reflects the intentions of capital. The direction of capital flow is determined dynamically. The key mechanism of liquidations lies in the tendency of price to gravitate toward areas where real participants of the system are concentrated — regardless of whether they are in longs or shorts.
Such zones represent areas of asymmetric advantage: when the price approaches them, some participants are forced to close positions at a loss, others lock in profits, and a third group (institutional players) uses this flow to enter in the direction of the next concentration zone.
Institutional players generate energy blocks through miners. Subsequently, these energy blocks form the range of capital movement across various timeframes for exchange speculators. However, the ultimate goal in ensuring liquidity is to reach the energy block mark.
The results are presented in the dashboard for the international arena. It is necessary to manually determine, without third-party software, the direction of the impact node and the concentration of real system participants. This is achieved through high cognitive and intellectual effort — without templates and solely through pure chart analysis.
Three-dimensional analytics is intellectual property. The methodology is closed and does not require evaluation from the standpoint of the old world. We offer the ability to think but do not provide trading recommendations and are not educators.
We thank you and regard TradingView as an impartial platform for demonstrating the transition into a new analytical reality.
Quantum structure of obligations and capital movement in price formation within energy blocks.
🏷 Vertical chart — Energy Grid Dashboard.
🏷 Static tape No. 1: The price is published according to the production order of the energy block.
🏷 The energy block price is already ordered — not by time but by the priority of block execution. It is important not to confuse: block priorities dynamically reorganize in response to hidden energetic impulses, while the execution order of prices fixes their manifestation in the market. Each price in the dynamic tape is linked to energy production measurement indicators, unavailable to the general public. Those who see the structure before its manifestation do not follow the price — they anticipate it.
EΞ2Φ8Ψ45Θ·ζ⁻¹·106Λ732·Ω²
📎 Screenshot:
🏷 When trading from levels, use liquidation zones from BPC 10 and higher.
🏷 Bolzen Liquidity Map — ETH (numerical equivalent of the map):
Updated versions of the Bolzen Liquidity Map — ETH are in restricted access.
The permanent Energy Grid Dashboard for ETH and BTC is publicly available and intended for international institutional review.
Dear international community,
I thank the TradingView moderation for their neutrality and support of analytical work on a global scale, as well as everyone who follows my research. This platform serves as a space to demonstrate the contribution to analytical development.
Attention and time are your key resources. ATH — is emotion; timeframes — are your best allies. Thank you.
— The Architect
BPC — The Bolzen Price Covenant

ETH — Price Slice. Capital Sector. 1667.41 BPC 12© Bolzen | The Architect | BPC Framework
Bolzen Market Institute
🏷 ETH — Price Slice. Capital Sector.
Publication date on TradingView: 12.02.2026
🏷 1667.41 — at the time of publication, the price had not been reached.
🏷 BPC — The Bolzen Price Covenant — Strength Index: 12
The energy block reflects the intentions of capital. The direction of capital flow is determined dynamically. The key mechanism of liquidations lies in the tendency of price to gravitate toward areas where real participants of the system are concentrated — regardless of whether they are in longs or shorts.
Such zones represent areas of asymmetric advantage: when the price approaches them, some participants are forced to close positions at a loss, others lock in profits, and a third group (institutional players) uses this flow to enter in the direction of the next concentration zone.
Institutional players generate energy blocks through miners. Subsequently, these energy blocks form the range of capital movement across various timeframes for exchange speculators. However, the ultimate goal in ensuring liquidity is to reach the energy block mark.
The results are presented in the dashboard for the international arena. It is necessary to manually determine, without third-party software, the direction of the impact node and the concentration of real system participants. This is achieved through high cognitive and intellectual effort — without templates and solely through pure chart analysis.
Three-dimensional analytics is intellectual property. The methodology is closed and does not require evaluation from the standpoint of the old world. We offer the ability to think but do not provide trading recommendations and are not educators.
We thank you and regard TradingView as an impartial platform for demonstrating the transition into a new analytical reality.
Quantum structure of obligations and capital movement in price formation within energy blocks.
🏷 Vertical chart — Energy Grid Dashboard.
🏷 Static tape No. 1: The price is published according to the production order of the energy block.
🏷 The energy block price is already ordered — not by time but by the priority of block execution. It is important not to confuse: block priorities dynamically reorganize in response to hidden energetic impulses, while the execution order of prices fixes their manifestation in the market. Each price in the dynamic tape is linked to energy production measurement indicators, unavailable to the general public. Those who see the structure before its manifestation do not follow the price — they anticipate it.
EΞ2Φ8Ψ45Θ·ζ⁻¹·106Λ732·Ω²
📎 Screenshot:
🏷 When trading from levels, use liquidation zones from BPC 10 and higher.
🏷 Bolzen Liquidity Map — ETH (numerical equivalent of the map):
Updated versions of the Bolzen Liquidity Map — ETH are in restricted access.
The permanent Energy Grid Dashboard for ETH and BTC is publicly available and intended for international institutional review.
Dear international community,
I thank the TradingView moderation for their neutrality and support of analytical work on a global scale, as well as everyone who follows my research. This platform serves as a space to demonstrate the contribution to analytical development.
Attention and time are your key resources. ATH — is emotion; timeframes — are your best allies. Thank you.
— The Architect
BPC — The Bolzen Price Covenant

ETH — Price Slice. Capital Sector. 1676.35 BPC 15© Bolzen | The Architect | BPC Framework
Bolzen Market Institute
🏷 ETH — Price Slice. Capital Sector.
Publication date on TradingView: 12.02.2026
🏷 1676.35 — at the time of publication, the price had not been reached.
🏷 BPC — The Bolzen Price Covenant — Strength Index: 15
The energy block reflects the intentions of capital. The direction of capital flow is determined dynamically. The key mechanism of liquidations lies in the tendency of price to gravitate toward areas where real participants of the system are concentrated — regardless of whether they are in longs or shorts.
Such zones represent areas of asymmetric advantage: when the price approaches them, some participants are forced to close positions at a loss, others lock in profits, and a third group (institutional players) uses this flow to enter in the direction of the next concentration zone.
Institutional players generate energy blocks through miners. Subsequently, these energy blocks form the range of capital movement across various timeframes for exchange speculators. However, the ultimate goal in ensuring liquidity is to reach the energy block mark.
The results are presented in the dashboard for the international arena. It is necessary to manually determine, without third-party software, the direction of the impact node and the concentration of real system participants. This is achieved through high cognitive and intellectual effort — without templates and solely through pure chart analysis.
Three-dimensional analytics is intellectual property. The methodology is closed and does not require evaluation from the standpoint of the old world. We offer the ability to think but do not provide trading recommendations and are not educators.
We thank you and regard TradingView as an impartial platform for demonstrating the transition into a new analytical reality.
Quantum structure of obligations and capital movement in price formation within energy blocks.
🏷 Vertical chart — Energy Grid Dashboard.
🏷 Static tape No. 1: The price is published according to the production order of the energy block.
🏷 The energy block price is already ordered — not by time but by the priority of block execution. It is important not to confuse: block priorities dynamically reorganize in response to hidden energetic impulses, while the execution order of prices fixes their manifestation in the market. Each price in the dynamic tape is linked to energy production measurement indicators, unavailable to the general public. Those who see the structure before its manifestation do not follow the price — they anticipate it.
EΞ2Φ8Ψ45Θ·ζ⁻¹·106Λ732·Ω²
📎 Screenshot:
🏷 When trading from levels, use liquidation zones from BPC 10 and higher.
🏷 Bolzen Liquidity Map — ETH (numerical equivalent of the map):
Updated versions of the Bolzen Liquidity Map — ETH are in restricted access.
The permanent Energy Grid Dashboard for ETH and BTC is publicly available and intended for international institutional review.
Dear international community,
I thank the TradingView moderation for their neutrality and support of analytical work on a global scale, as well as everyone who follows my research. This platform serves as a space to demonstrate the contribution to analytical development.
Attention and time are your key resources. ATH — is emotion; timeframes — are your best allies. Thank you.
— The Architect
BPC — The Bolzen Price Covenant

ETH — Price Slice. Capital Sector. 1678.40 BPC 26© Bolzen | The Architect | BPC Framework
Bolzen Market Institute
🏷 ETH — Price Slice. Capital Sector.
Publication date on TradingView: 12.02.2026
🏷 1678.40 — at the time of publication, the price had not been reached.
🏷 BPC — The Bolzen Price Covenant — Strength Index: 26
The energy block reflects the intentions of capital. The direction of capital flow is determined dynamically. The key mechanism of liquidations lies in the tendency of price to gravitate toward areas where real participants of the system are concentrated — regardless of whether they are in longs or shorts.
Such zones represent areas of asymmetric advantage: when the price approaches them, some participants are forced to close positions at a loss, others lock in profits, and a third group (institutional players) uses this flow to enter in the direction of the next concentration zone.
Institutional players generate energy blocks through miners. Subsequently, these energy blocks form the range of capital movement across various timeframes for exchange speculators. However, the ultimate goal in ensuring liquidity is to reach the energy block mark.
The results are presented in the dashboard for the international arena. It is necessary to manually determine, without third-party software, the direction of the impact node and the concentration of real system participants. This is achieved through high cognitive and intellectual effort — without templates and solely through pure chart analysis.
Three-dimensional analytics is intellectual property. The methodology is closed and does not require evaluation from the standpoint of the old world. We offer the ability to think but do not provide trading recommendations and are not educators.
We thank you and regard TradingView as an impartial platform for demonstrating the transition into a new analytical reality.
Quantum structure of obligations and capital movement in price formation within energy blocks.
🏷 Vertical chart — Energy Grid Dashboard.
🏷 Static tape No. 1: The price is published according to the production order of the energy block.
🏷 The energy block price is already ordered — not by time but by the priority of block execution. It is important not to confuse: block priorities dynamically reorganize in response to hidden energetic impulses, while the execution order of prices fixes their manifestation in the market. Each price in the dynamic tape is linked to energy production measurement indicators, unavailable to the general public. Those who see the structure before its manifestation do not follow the price — they anticipate it.
EΞ2Φ8Ψ45Θ·ζ⁻¹·106Λ732·Ω²
📎 Screenshot:
🏷 When trading from levels, use liquidation zones from BPC 10 and higher.
🏷 Bolzen Liquidity Map — ETH (numerical equivalent of the map):
Updated versions of the Bolzen Liquidity Map — ETH are in restricted access.
The permanent Energy Grid Dashboard for ETH and BTC is publicly available and intended for international institutional review.
Dear international community,
I thank the TradingView moderation for their neutrality and support of analytical work on a global scale, as well as everyone who follows my research. This platform serves as a space to demonstrate the contribution to analytical development.
Attention and time are your key resources. ATH — is emotion; timeframes — are your best allies. Thank you.
— The Architect
BPC — The Bolzen Price Covenant

ETH — Price Slice. Capital Sector. 1692.43 BPC 6.6© Bolzen | The Architect | BPC Framework
Bolzen Market Institute
🏷 ETH — Price Slice. Capital Sector.
Publication date on TradingView: 12.02.2026
🏷 1692.43 — at the time of publication, the price had not been reached.
🏷 BPC — The Bolzen Price Covenant — Strength Index: 6.6
The energy block reflects the intentions of capital. The direction of capital flow is determined dynamically. The key mechanism of liquidations lies in the tendency of price to gravitate toward areas where real participants of the system are concentrated — regardless of whether they are in longs or shorts.
Such zones represent areas of asymmetric advantage: when the price approaches them, some participants are forced to close positions at a loss, others lock in profits, and a third group (institutional players) uses this flow to enter in the direction of the next concentration zone.
Institutional players generate energy blocks through miners. Subsequently, these energy blocks form the range of capital movement across various timeframes for exchange speculators. However, the ultimate goal in ensuring liquidity is to reach the energy block mark.
The results are presented in the dashboard for the international arena. It is necessary to manually determine, without third-party software, the direction of the impact node and the concentration of real system participants. This is achieved through high cognitive and intellectual effort — without templates and solely through pure chart analysis.
Three-dimensional analytics is intellectual property. The methodology is closed and does not require evaluation from the standpoint of the old world. We offer the ability to think but do not provide trading recommendations and are not educators.
We thank you and regard TradingView as an impartial platform for demonstrating the transition into a new analytical reality.
Quantum structure of obligations and capital movement in price formation within energy blocks.
🏷 Vertical chart — Energy Grid Dashboard.
🏷 Static tape No. 1: The price is published according to the production order of the energy block.
🏷 The energy block price is already ordered — not by time but by the priority of block execution. It is important not to confuse: block priorities dynamically reorganize in response to hidden energetic impulses, while the execution order of prices fixes their manifestation in the market. Each price in the dynamic tape is linked to energy production measurement indicators, unavailable to the general public. Those who see the structure before its manifestation do not follow the price — they anticipate it.
EΞ2Φ8Ψ45Θ·ζ⁻¹·106Λ732·Ω²
📎 Screenshot:
🏷 When trading from levels, use liquidation zones from BPC 10 and higher.
🏷 Bolzen Liquidity Map — ETH (numerical equivalent of the map):
Updated versions of the Bolzen Liquidity Map — ETH are in restricted access.
The permanent Energy Grid Dashboard for ETH and BTC is publicly available and intended for international institutional review.
Dear international community,
I thank the TradingView moderation for their neutrality and support of analytical work on a global scale, as well as everyone who follows my research. This platform serves as a space to demonstrate the contribution to analytical development.
Attention and time are your key resources. ATH — is emotion; timeframes — are your best allies. Thank you.
— The Architect
BPC — The Bolzen Price Covenant

BTC/USDT Intraday Strategy – Feb 12, 2026Market Sentiment: Pre-CPI caution. BTC is oscillating within a defined range (66k–70k). Derivatives-heavy environment (OI $44.9B) makes the "Liquidity Grab" (SFP) the highest probability setup before tomorrow's macro volatility.
🗝️ Key Levels of Interest
Upper Liquidity (Short Zone): 69,500 – 70,500 USD (Previous 1H Highs)
Lower Liquidity (Long Zone): 65,500 – 66,000 USD (Previous 1H Lows)
🏹 Execution Logic: The 1H SFP Setup
Since we are targeting 1H liquidity, the 1-Hour candle close is our primary filter to avoid "catching falling knives."
🔵 Idea 1: Range Long (Support Liquidity Grab)
Price Action: BTC trades into the 65.5k–66.0k zone, dipping below a significant recent 1H Low.
1H SFP Confirmation: The 1H candle must close back above that low. This confirms the "fakeout."
Entry Trigger:
Primary: If the 1H candle itself is a clear Pinbar (long lower wick), enter on the close.
LTF Precision: After the 1H candle closes as an SFP, look for a Pinbar on the 15M (moderate risk) or 5M (aggressive/higher risk) to refine the entry price.
Stop-Loss: Hard stop below the lowest point of the SFP wick.
Targets: TP1: 67,500 (Mid) | TP2: 69,500 (Range High).
🔴 Idea 2: Range Short (Resistance Liquidity Grab)
Price Action: BTC rallies into 69.5k–70.5k, pushing above a significant recent 1H High.
1H SFP Confirmation: The 1H candle must close back below that high.
Entry Trigger:
Primary: If the 1H candle closes as a Bearish Pinbar (long upper wick), enter on the close.
LTF Precision: Once the 1H SFP is confirmed, wait for a 15M or 5M Bearish Pinbar rejection to enter.
Stop-Loss: Hard stop above the highest point of the SFP wick.
Targets: TP1: 67,800 (Mid) | TP2: 66,000 (Range Low).
⚠️ Critical Rules for Today
The "Wait" Rule: If the 1H candle closes outside the range (e.g., a full body close below 65.5k), the SFP is invalidated. Do not attempt a mean-reversion trade; the market is likely trending.
Risk Management: Because we are using the 1H candle for confirmation, the wick might be large. Adjust your position size to ensure the dollar-risk remains consistent even with a wider stop-loss.
CPI Deadline: Tomorrow (Feb 13) at 08:30 ET is the "kill switch." All intraday positions should be closed or moved to break-even well before the data release.
💡 Summary Verdict
We are hunting for trapped traders at the range extremes. By waiting for the 1H close, we significantly increase the probability that the sweep was successful.

XAUUSD Trendline Breakdown – Bearish Continuation pattern....
Gold (XAUUSD) on the 1H timeframe shows a clear rejection from the upper resistance zone, followed by a strong bearish impulsive candle that breaks below the rising trendline and the Ichimoku cloud support. This breakdown signals a shift in short-term momentum from bullish to bearish. Price is now trading below key dynamic support, increasing the probability of further downside continuation. The chart highlights two downside objectives, with the first target near the previous support zone and the second target at a deeper liquidity/support area, suggesting sellers remain in control unless price reclaims the broken trendline.

XAUUSD Rejects Supply Zone, Bearish Pullback Toward 4880
Gold (XAUUSD) on the 1H timeframe shows a strong bullish recovery from the Feb 6 low, respecting an ascending trendline. Price rallied into a marked supply/resistance zone near the 5080–5100 area, where buying momentum weakened and rejection formed. After failing to sustain above this zone, price has started to roll over, suggesting a corrective move. The marked downside target sits around the 4,880 support area, aligning with prior structure and a likely demand zone. Overall bias turns short-term bearish while below the supply zone, with the uptrend vulnerable to a deeper pullback.

bitcoin (1h)As you can see, the price is moving inside a descending channel, and it is also forming a descending wedge. If the wedge breaks to the downside, the price could drop toward the $65k area, where it may find support and potentially start rising again.
However, if the channel is broken to the upside, the price could rally above $70k

RENDER – Major Support Zone Swing SetupRENDER has entered a major support zone, where buyers are beginning to show signs of strength. We are currently laddering into a long swing position within this area, aiming to build exposure gradually rather than committing full size at once. This zone has previously acted as demand and could provide a foundation for a potential upside move.
⚒ Strategy Setup:
Entry (Ladder In): $1.20 – $1.40
Take Profit Targets:
TP1: $1.60 – $1.85
TP2: $2.20 – $2.70
Stop Loss: Below $1.12
The focus is on structured risk management, with clearly defined invalidation below support. If price holds and momentum builds, the upside targets align with key resistance levels, offering a favorable risk-to-reward swing setup.

M: poised for a move? key levels and targets for todayM. Who’s bored of chasing BTC wicks and wants a clean alt setup instead? Lately liquidity has been rotating back into second-tier perps according to market desks, and M is sitting right on a fat 4H value area around 1.40 - that’s usually where smart money quietly reloads, not where it panic exits.
On the 4H chart price keeps hugging this orange HVN zone while RSI chills near 45 after cooling off from overbought. I’m leaning long from here: buyers defended this area after the last liquidation spike and every dip into 1.38-1.40 gets absorbed. First real supply is stacked above at 1.47-1.50, then 1.55+ if momentum kicks in.
My base plan: look for a reclaim of 1.45 with strong 4H candle bodies and I’ll ride it toward 1.50 and possibly 1.55 ✅. If we lose the orange block with a clean 4H close under 1.37, I expect a slide into the green demand near 1.30 where I’d rather wait for a fresh bounce. I might be wrong, but for now the chart still looks more like quiet accumulation than distribution.

AVAX - LONG - SQUEEZE LOADINGCRYPTOCAP:AVAX
When you zoom out, the structure is simple.
When you zoom in, the order flow tells the real story.
Coin-margined OI has been bleeding.
Coin-margined CVD has been trending down.
That tells us native collateral traders have been reducing exposure or getting flushed. That side of the market is not aggressively bidding.
Meanwhile:
Stablecoin-margined OI has been rising aggressively.
Stablecoin CVD has been making lower lows alongside price.
Fresh leverage entered. Mostly shorts.
So structurally, we had pressure building on the downside.
But then something changed.
Yesterday we saw continuous short buildup.
CVD kept pushing lower.
Yet price stopped responding.
Instead of breaking down, price started grinding up.
That is absorption.
Aggressive sellers are hitting bids.
But someone is calmly sitting there, passively absorbing everything.
Now layer in spot.
Spot CVD is trending up hard.
Real demand is stepping in.
This is not perp games anymore. This is inventory transfer.
Then we look at structure.
Price retraced to the 0.5 Fib of the previous impulse.
From a symmetry perspective, 0.5 rotations often resolve toward the 2.0 extension.
The 2.0 extension sits around 11.4
The 1.618 extension sits near 11.5
Clustered target zone.
If price keeps grinding higher slowly while:
• OI does not collapse
• Shorts keep building
• Spot keeps buying
Then we are looking at fuel, not weakness.
The longer price compresses above the 0.5, the more trapped shorts accumulate below.
Once liquidity builds and passive bids stack under the new structure, the squeeze can be violent.
This does not look like distribution.
It looks like preparation.
CRYPTOCAP:AVAX
- ThetaNomad

BTC/USDT – 2H Chart Update. BTC/USDT – 2H Chart Update
BTC is compressing between a descending resistance trendline and rising short-term support, forming a tightening wedge structure around 67K.
Price holding above 66K local support
Descending trendline near 68.5K–69K acting as a pressure zone
Ichimoku cloud thinning → momentum slowdown, breakout setup forming.
Support: 66,000–65,500
Major Macro Support: 60,000–58,500
Resistance: 69,000
Breakout Confirmation: 70,000+
If BTC breaks above 69–70K with strength, upside momentum can extend toward 73K–75K liquidity zone.
Failure to hold 66K may trigger another sweep toward 64K before any recovery.
⚠️ Wait for breakout confirmation

$SOL 1W Update: In the middle of the range here Solana looks like it wants to produce a relief bounce, but zooming out on the weekly, it’s still trading in the middle of a large multi-month range, which limits immediate upside expectations. After the aggressive breakdown through 125.5, momentum has clearly shifted bearish, yet the pace of the selloff is beginning to stretch as price presses into the 80 region, an area that previously acted as a reaction zone. This is typically where short-term exhaustion can develop, especially after a clean channel breakdown like we’ve seen.
That said, structurally SOL is not at macro support yet. The true higher-timeframe demand sits closer to 44, meaning any bounce from here is likely corrective unless price can reclaim 125.5 and build acceptance back inside the prior range. In other words, the market may be due for relief, potentially back toward 95–110, but within the context of a broader corrective phase. Until SOL starts printing higher highs and reclaiming lost range support, rallies are more likely to be sold into rather than the start of a fresh expansion leg.

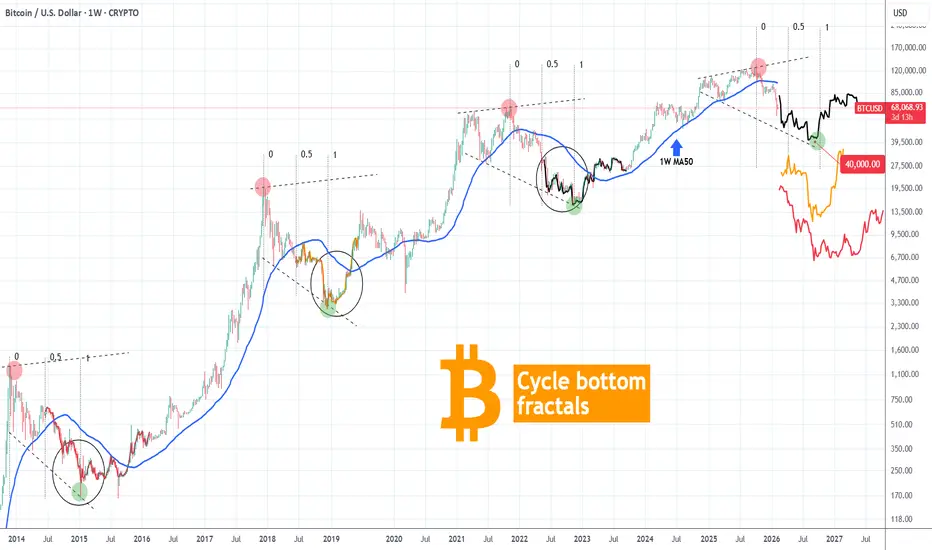
BITCOIN Cycle bottom fractals map the rest of 2026 towards $40k.Bitcoin (BTCUSD) continues to be under heavy pressure despite having the 1W MA200 holding the crash last week. Having long lost its 1W MA50 (blue trend-line), which confirmed the Bear Cycle, we are now approaching its 2nd Phase, which is the bottoming process.
This doesn't mean that the bottom is here but more like that the market is entering a Phase where it will gradually attempt to lead us to the bottom of the 4-year Cycle, which based on it should be around September - October 2026.
Having a look at the past three Bear Cycles and drawing their Phase 2 fractals after the 0.5 Fibonacci level, that led to their bottom, we can see that the structure is quite familiar. Not identical, but similar. All principles are the same and there is a high correlation with the 2022 Bear Cycle in particular.
Even though we haven't yet technically reached the middle (0.5 Fib) of this Bear Cycle, according to that fractal, BTC should start making a series of Lower Lows gradually, that can potentially lead to as low as $40000. That could be the Bear Cycle bottom.
So do you think that's a strong probability for the remainder of 2026? Feel free to let us know in the comments section below!
---
** Please LIKE 👍, FOLLOW ✅, SHARE 🙌 and COMMENT ✍ if you enjoy this idea! Also share your ideas and charts in the comments section below! This is best way to keep it relevant, support us, keep the content here free and allow the idea to reach as many people as possible. **
---
💸💸💸💸💸💸
👇 👇 👇 👇 👇 👇
BTCUSD H1 Analysis – Channel Break Incoming?BTC is currently trading inside a well-defined descending channel on the 1H timeframe.
Price has reacted strongly from the 50% Fibonacci retracement zone (65,700–66,000) , showing clear bullish rejection from support.
🔎 Market Structure:
1.Descending channel still intact
2.Higher low forming near key support
3.EMA 21 being reclaimed
4.Stochastic crossing upward from oversold zone
📈 Bullish Scenario:
If price breaks above 68,800 – 69,500 resistance zone and confirms a breakout of the channel, we can expect continuation toward:
➡️ 72,000
➡️ 75,000
➡️ 78,000
⚠️ Bearish Scenario:
Failure to break resistance may lead to another rejection toward:
66,000 support
Deeper liquidity near 63,000–62,000
📌 Key confirmation will be a strong close above 70,500.

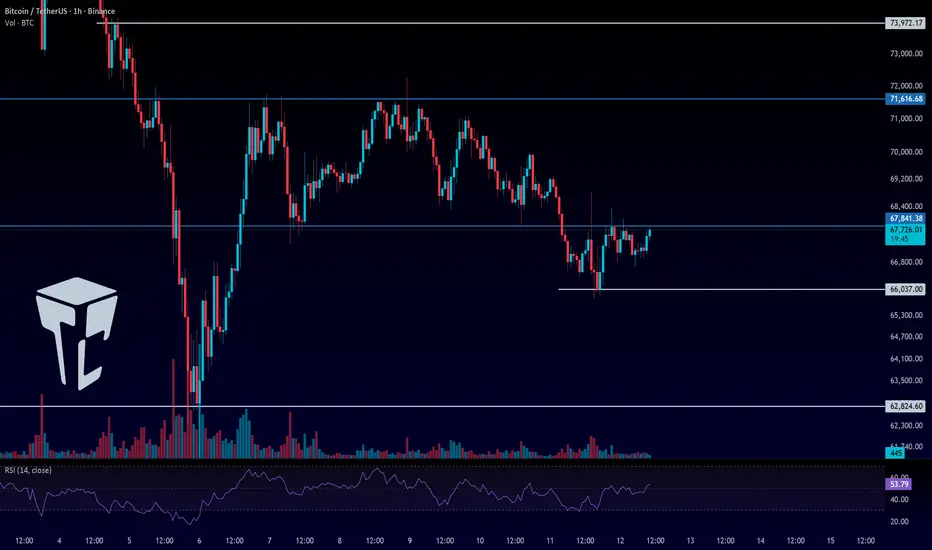
TradeCityPro | Bitcoin Daily Analysis #266👋 Welcome to TradeCity Pro!
Let’s move on to Bitcoin analysis. After activating our trigger yesterday, the market is now moving sideways.
⌛️ 1-Hour Timeframe
At the moment, Bitcoin has formed a small range box between 66,037 and 67,841, and after breaking 67,841, price has entered a consolidation phase.
✨ The fact that price started ranging after the break of 67,841, without bearish momentum entering the market, shows that sellers don’t currently have enough strength and haven’t been able to win the battle against buyers.
✔️ On the other hand, buyers haven’t been able to fake this breakout either, so their strength isn’t dominant as well. Overall, we can say that there’s no clear power or momentum in Bitcoin right now.
✨ If price doesn’t spend too much time inside this range and breaks out before the end of today’s New York session, momentum could enter the market.
📊 A break above 67,841 would confirm that the bearish move was fake and signal the entry of bullish momentum.
A break below 66,037 would confirm the continuation of the bearish move.
💥 Personally, I won’t open a long position on the break of 67,841, but I’ll be watching closely in case the market gives a trigger for a risky long position. The main long trigger remains 71,616.
⚖️ For shorts, the 66,037 level is a valid trigger. If you don’t already have a short position, you can enter on a break of this level.
💡 Since the market currently lacks momentum, RSI isn’t very useful right now. We should wait for the next impulsive leg to begin before relying on momentum oscillators again.
❌ Disclaimer ❌
Trading futures is highly risky and dangerous. If you're not an expert, these triggers may not be suitable for you. You should first learn risk and capital management. You can also use the educational content from this channel.
Finally, these triggers reflect my personal opinions on price action, and the market may move completely against this analysis. So, do your own research before opening any position.
BTC AB-CD IS THE BEST CASE...Morning folks,
So, BTC under the negative wave - massive sell-off, whales' buying can't help, Clarity Act is stuck etc...
By technical picture market is strongly oversold. At the same time, price stands too close to downside AB=CD target @52K to ignore it. So, we suggest chances on solid pullback from 52K as solid .
That's why now, if even we get the pullback it will not be the major one. At the best case scenario we will get minor AB-CD to ~75-76K area from 5/8 support. Most probable that we get a kind of Double Bottom instead with the same target.

BTCUSD (1M): The Bottom SignalMacro Analysis
We are analyzing the Monthly (1M) Logarithmic Chart of Bitcoin utilizing Bollinger Bands and RSI. This setup has historically pinpointed every major cycle bottom with high precision.
Lower Bollinger Band Test: The price action has retraced to the Lower Bollinger Band. Historically (as marked by the upward arrows on the chart), touching or hugging this lower band indicates the cyclical "accumulation zone." We saw this in 2015, 2019, 2020, and 2022. We are currently testing this zone again.
RSI at 43: The Monthly RSI is currently at 43, sitting exactly on the historical support line (red horizontal line).
Every time the Monthly RSI has touched the 42-44 zone in the last 14 years, it marked the end of the bear market/correction phase.
This suggests that seller momentum is mathematically exhausted on a macro scale.
While the indicators suggest a bottom, the price is currently below the Middle Band (Red Line). This confirms we are in a "buyer's market" (accumulation) rather than a confirmed bull run. The strategy here is accumulation at support, anticipating a mean reversion to the middle band.
Bitcoin is trading at a "Maximum Financial Opportunity" zone based on historical Logarithmic Band and RSI data. While fear is high, the math suggests the downside is limited compared to the cyclical upside.
BBW (Bandwidth)

ETH/BTC Losing Momentum Below 21 MA#ETH/BTC on the daily timeframe is trading inside a clear descending channel structure.
Price recently broke back below the 21 MA and lost the 0.0324 range support. That former range is now acting as resistance. The pair is currently sitting near the mid-to-lower portion of the channel, with immediate structure support around 0.0290.
Below current price, the major higher timeframe support sits at 0.0259. This level aligns with historical reaction and is the key level to watch.
If 0.0290 fails to hold, the market is likely to rotate into the 0.0259 demand zone. A loss of 0.0259 opens the path toward 0.0194, which is the next major structural support on the chart.
On the bullish side, reclaiming the 21 MA and breaking back above 0.0324 would be the first sign of strength, opening room toward 0.0354 and potentially the upper channel boundary.
Currently, structure remains bearish while price stays below the channel midline and 21 MA.
