CEP Here's a version of this giving an idea for a short-term pop followed by more downside and compression.
It's always good to look at things from multiple points of view and see what you think on various opinions and not be blind to things going against your personal desires.
Btc-bitcoin

BTC End of Q3 Setup Now that FOMC is over and the FED finally cut interest rates by 25bps, what does this mean for BTC in the short term future and beyond?
It has been known for a while that the September FOMC would bring a cut to interest rates and that is what we got, generally this was priced into the market and despite some low time frame volatility not much has changed in terms of % move in the last day.
However, the macro does look bullish from here. Flipping $117,500 opens up the possibility of a range high test. For me this is the direction I'm leaning towards given the macro and how seasonality suggests a stronger end to the year especially after a rate cut.
Should BTC fail to break above the grey box BTC stays within the same constraints it's had for the last month.

FOMC Day: Prepare for Potential Bitcoin Volatility!Today is a big day for the markets – the US Federal Funds Rate decision and the FOMC Press Conference are scheduled, events that could potentially change the game for Bitcoin ( BINANCE:BTCUSDT ) and other assets .
But until the meeting begins , we still have time to analyze the charts and prepare.
Keep in mind : as we get closer to the announcement and especially during the release, the market could turn highly volatile. Manage your positions wisely and don’t forget your stop-loss levels .
-------------------------------------------
Bitcoin rose about +2% yesterday on the news that " Trump Family's American Bitcoin just went public on the Nasdaq ."
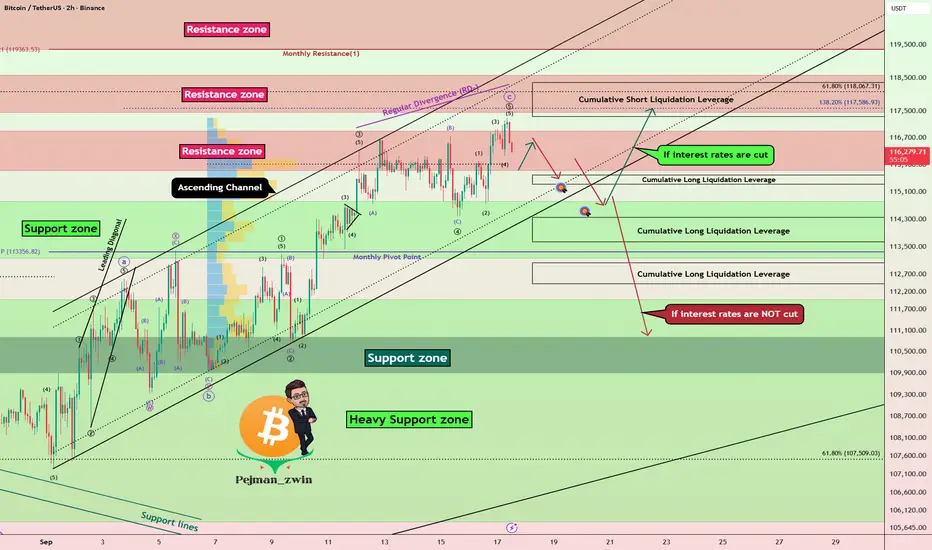
Bitcoin is currently trading in an ascending channel and Resistance zone($116,900-$115,730) near the Cumulative Short Liquidation Leverage($118,354-$117,329) .
In terms of Elliott Wave theory , if interest rates cut , Bitcoin could be completing wave 4 and then rising again and possibly forming a new All-Time High(ATH) . On the other hand, if interest rates do NOT cut , Bitcoin appears to have completed wave C of the Zigzag Correction structure(ABC/5-3-5) .
Also, we can see the Regular Divergence(RD-) between Consecutive Peaks .
I expect Bitcoin to drop to at least $114,860(First Target) before the Fed meeting starts , and if interest rates are not cut , we will see a further and more sudden drop in Bitcoin . And if interest rates CUT , there is a high probability of a Bitcoin pump, so stick to the first target($114,860) for now.
Second Target: $114,470
Cumulative Long Liquidation Leverage: $115,597-$115,330
Cumulative Long Liquidation Leverage: $114,351-$113,640
Cumulative Long Liquidation Leverage: $113,031-$112,430
Do you think the Federal Reserve will cut interest rates?
Please respect each other's ideas and express them politely if you agree or disagree.
Bitcoin Analysis (BTCUSDT), 2-hour time frame.
Be sure to follow the updated ideas.
Do not forget to put a Stop loss for your positions (For every position you want to open).
Please follow your strategy and updates; this is just my Idea, and I will gladly see your ideas in this post.
Please do not forget the ✅' like '✅ button 🙏😊 & Share it with your friends; thanks, and Trade safe.
HBAR ANALYSIS📊 #HBAR Analysis
✅There is a formation of Falling Wedge Pattern on 4HR chart with a breakout and currently trading above its major support area🧐
Pattern signals potential bullish movement incoming in few days
👀Current Price: $0.2385
🚀 Target Price: $0.2780
⚡️What to do ?
👀Keep an eye on #HBAR price action and volume. We can trade according to the chart and make some profits⚡️⚡️
#HBAR #Cryptocurrency #TechnicalAnalysis #DYOR

BITCOIN NEXT MOVE REVEALED!!!!! (this will make you scream) Yello Paradisers! In this video, we went through multiple timeframes as professional traders. We assumed things to analyze in Elliott Wave and other important indicators and advanced technical analysis tools. What's the next movement going to be with the highest probability!
Paradisers! Keep in mind to trade only with a proper professional trading strategy. Wait for confirmations. Play with tactics. This is the only way you can be long-term profitable.
Remember, don’t trade without confirmations. Wait for them before creating a trade. Be disciplined, patient, and emotionally controlled. Only trade the highest probability setups with the greatest risk to reward ratio. This will ensure that you become a long-term profitable professional trader.
Don't be a gambler. Don't try to get rich quick. Make sure that your trading is professionally based on proper strategies and trade tactics.

For couple years we've said Crypto = StocksWant more proof Crypto = Stocks now?
CRYPTOCAP:TOTAL 3 = NO CRYPTOCAP:BTC or CRYPTOCAP:ETH
This index looks identical to TVC:RUT = Russell 2k
Sorry we don't post much. It's a lot to keep 1 social account, let alone 2 - 3!
Please see our profile for more info.

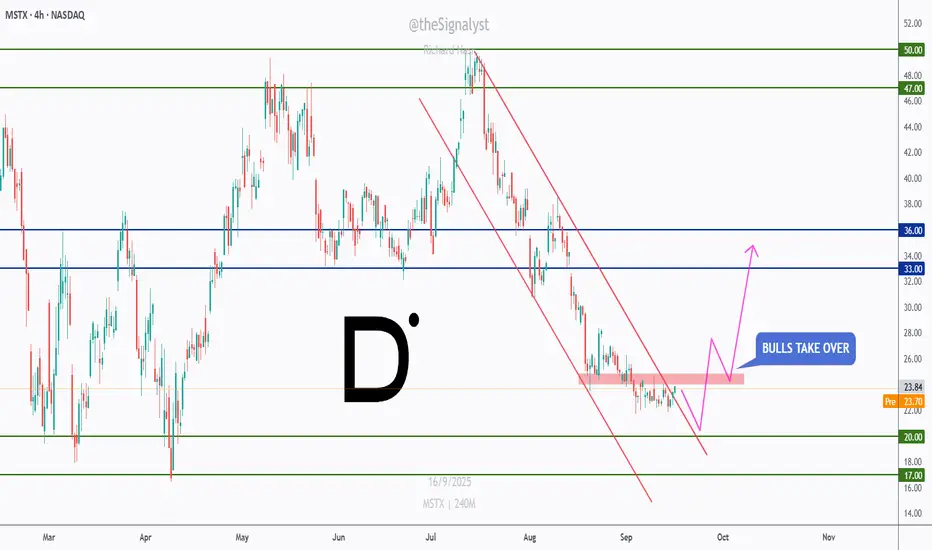
MSTX – Bulls Preparing a Reversal Move!MSTX has been overall bearish 📉, trading inside a well-defined descending channel.
Recently, price approached the $23 – $24 support area, where buyers started showing signs of activity. This zone could act as a potential turning point if momentum continues.
🟢 Support at $23 – $24: A critical level where bulls may step in.
📈 Upside targets: If buyers take over, the first resistance sits around $33, followed by $36 and higher toward $47 – $50.
As long as $23 support holds, bulls 🐂 could drive a short-term reversal that turns into a bigger recovery move.
Patience ⏳ is key — waiting for confirmation before entering can provide a higher-probability setup.
⚠️ Disclaimer: This is not financial advice. Always do your own research and manage risk properly.
📚 Stick to your trading plan regarding entries, risk, and management.
Good luck!
All Strategies Are Good; If Managed Properly!
~Richard Nasr
BTC – Between Structure and Supply!BTC has been trading inside a clean ascending channel 📈, respecting both support and resistance.
After breaking above the $113,000 structure zone, price pushed higher but is now approaching a potential retest area.
🟠 Structure zone ($113K – $114K): Could act as support on a pullback.
🟢 Channel support: Aligns perfectly with structure for confluence.
🔵 Supply zone ($122K – $124K): Next major resistance where sellers may step in.
As long as BTC holds above structure, bulls 🐂 remain in control, with the next upside target sitting around the supply zone.
Patience ⏳ is key — waiting for a clean retest could set up the next continuation trade.
⚠️ Disclaimer: This is not financial advice. Always do your own research and manage risk properly.
📚 Stick to your trading plan regarding entry, risk, and management.
Good luck!
All Strategies Are Good; If Managed Properly!
~Richard Nasr

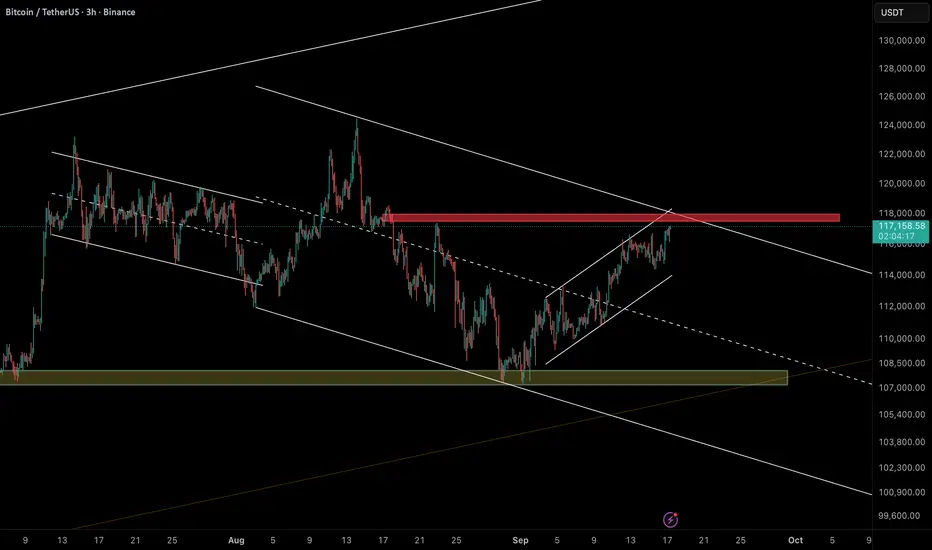
Bitcoin at Critical Resistance – Reversal or Breakout?Bitcoin (BTCUSDT – 3H) is testing the 117.5k – 118k resistance zone, which coincides with the upper boundary of the descending channel.
So far, this level has acted as a strong rejection zone several times.
🔎 Key Insights:
• Structure: Price has formed a rising channel/wedge, often seen as a corrective bearish pattern.
• Resistance: 117.5k – 118k (major supply zone + channel top).
• Supports:
• 114k (short-term channel support)
• 107k – 108k (major support zone + channel bottom).
📌 Scenarios:
• Bearish (more likely): Rejection from 118k → downside targets at 114k and 107k – 108k.
• Bullish (alternative): Break & close above 118k → potential rally toward 122k – 124k.
⚠️ As long as BTC stays below 118k, downside risks remain higher.

BITCOIN 1W Stoch RSI completed a Bullish Cross. Expect new ATH.Bitcoin (BTCUSD) just completed a Bullish Cross on its 1W STOCH RSI and that's the first time it does so since April 07 2025. That was as we know, the previous market bottom of the Trade War correction.
In fact, every 1W STOCH RSI Bullish Cross has been a buy signal within this Bull Cycle's Channel Up (since November 2022), most of which huge. The April 2025 Bullish Leg rose by +65.92% and that has been the 'weakest' one of this Channel Up.
As a result, if we get the bear minimum of +65.92% this time around too, expect a new High around $175000, which should be the Cycle Top and in our opinion the absolute maximum that this Cycle can give.
Do you think we will go that high? Feel free to let us know in the comments section below!
-------------------------------------------------------------------------------
** Please LIKE 👍, FOLLOW ✅, SHARE 🙌 and COMMENT ✍ if you enjoy this idea! Also share your ideas and charts in the comments section below! This is best way to keep it relevant, support us, keep the content here free and allow the idea to reach as many people as possible. **
-------------------------------------------------------------------------------
💸💸💸💸💸💸
👇 👇 👇 👇 👇 👇


Bitcoin Roadmap | Short termBitcoin ( BINANCE:BTCUSDT ) has been experiencing a lot of volatility over the past 10 days, and the reasons for these movements could be the announcement of US indices + geopolitical issues Those who were in favor of Bitcoin caused Bitcoin to pump .
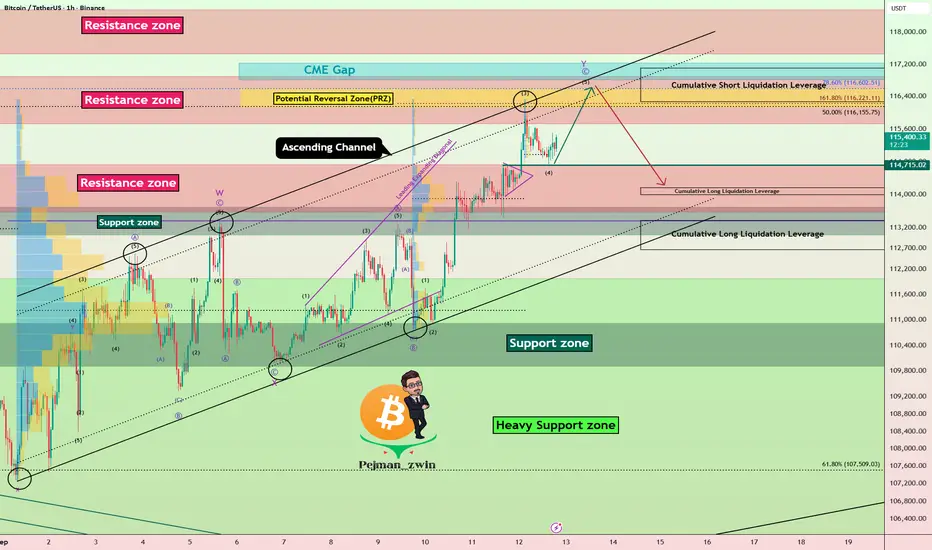
Bitcoin's movements over the past 10 days have managed to form an Ascending Channel .
In terms of Elliott Wave theory , Bitcoin appears to be completing microwave 5 of microwave C of the main wave Y .
I expect Bitcoin to try to complete main wave Y , and if we find signs of a reversal in the Resistance zone($116,900-$115,730) and Potential Reversal Zone(PRZ) , we can expect a further decline . Also, it is expected that the CME Gap($117,235-$116,820) will eventually be completed in the main wave Y .
Cumulative Long Liquidation Leverage: $114,165-$113,989
Cumulative Long Liquidation Leverage: $113,370-$112,664
Cumulative Short Liquidation Leverage: $117,102-$116,266
Please respect each other's ideas and express them politely if you agree or disagree.
Bitcoin Analysis (BTCUSDT), 1-hour time frame.
Be sure to follow the updated ideas.
Do not forget to put a Stop loss for your positions (For every position you want to open).
Please follow your strategy and updates; this is just my Idea, and I will gladly see your ideas in this post.
Please do not forget the ✅' like '✅ button 🙏😊 & Share it with your friends; thanks, and Trade safe.
15/09/25 Weekly OutlookLast weeks high: $116,672.39
Last weeks low: $110,615.91
Midpoint: $113,644.15
It's FOMC week and finally the time has come for the FED to cut interest rates, but by how much?
Currently the probability of a cut is 100%. The chance of a 25bps cut is ~90%, a 50bps cut ~12%.
Therefore I believe a 25bps cut is priced in and expected by the majority, a 50bps cut would be bullish and no change would be devastating to the markets in the short term.
Last week BTC continues its move up and flipped the important S/R level of $114,000 in preparation for FOMC. Ultimately the bulls should now target a flip of $117,500 to continue the larger bullrun move. Should the bulls fail to do so the rangebound environment looks to continue with the low being $106,000 (1D 200 EMA).
As I have mentioned in previous post September often gives poor returns, so far this year BTC is up 6% from month open, perhaps in anticipation for the rate cut to come? I don't see many setups presenting themselves until after Thursday so just being patient until then.
Good luck this week everybody!

BITCOIN Will it pull back??Bitcoin (BTCUSD) just formed a 4H Golden Cross, technically a bullish pattern, which usually emerges at the start of uptrends.
Such a formation emerged on both main Channel Up patterns since the April 07 Trade War bottom. The interesting feature however is that, following every 4H Golden Cross, the price always pulled back to its 4H MA200 (orange trend-line).
With BTC having started the week on the back foot, the 4H MA200 currently stands at $113600. Ahead of the Fed Rate Decision this week, a 'volatility' pull-back would align the news with this technical need.
Do you think we'll get that pull-back? Feel free to let us know in the comments section below!
-------------------------------------------------------------------------------
** Please LIKE 👍, FOLLOW ✅, SHARE 🙌 and COMMENT ✍ if you enjoy this idea! Also share your ideas and charts in the comments section below! This is best way to keep it relevant, support us, keep the content here free and allow the idea to reach as many people as possible. **
-------------------------------------------------------------------------------
💸💸💸💸💸💸
👇 👇 👇 👇 👇 👇

The altseason will begin!!!The price will drop to the 0.618 Fibonacci level, then pump to 117K. If Bitcoin holds the 113K support, the altseason will begin.

Roundtrips are part of speculation. #HEX could go back to 1 SatThis is Hex, on ethereum, in it's entriety.
This is not a prediction.
As in, I Believe this will happen, with massive conviction.
But do I believe, it has a chance, of occurring?
Absolutely!
Richard pre loaded the HEX launch with 25 thousand followers.
And hours of streaming on youtube.
5 thousand got into HEX around the launch.
There are literally thousands of people, who are still MASSIVELY in profit versus #Bitcoin.
This is not a strong base for an altcoin like HEX, to go on a Bull Run.
The long term staking has in my opinion not allowed a proper capitulation / abandonment of the coins.
Imagine #Bitcoin goes on to do a 3X to it's top.
1 satoshi would be $0.00145
Now do you believe?

BTC: What to expect on Monday?BTC: What to expect on Monday?
Sunday is the perfect time to sync up with the market while most people are resting. Historically, Monday sets the tone for the entire week, often bringing increased volatility after the CME futures open. Currently, we can see the price of BTC on the 1-hour chart moving neatly within an ascending channel, gathering strength before the next impulse. This is the calm before the storm.
Fundamentally, everyone is awaiting this week's US Federal Reserve meeting, where there is a high probability of a rate cut. This could weaken the dollar and provide a powerful boost to risk assets, including Bitcoin. Technically, we have run into a key resistance zone of $117,200 - $117,500. It is here that the short-term fate of the trend is being decided. A breakout above this level will open the way up for us.
My plan is simple: I am not entering a position right now, but rather waiting for confirmation. I need a confident breakout and for the price to hold above $117,500. If that happens, my first target will be the $119,000 area.

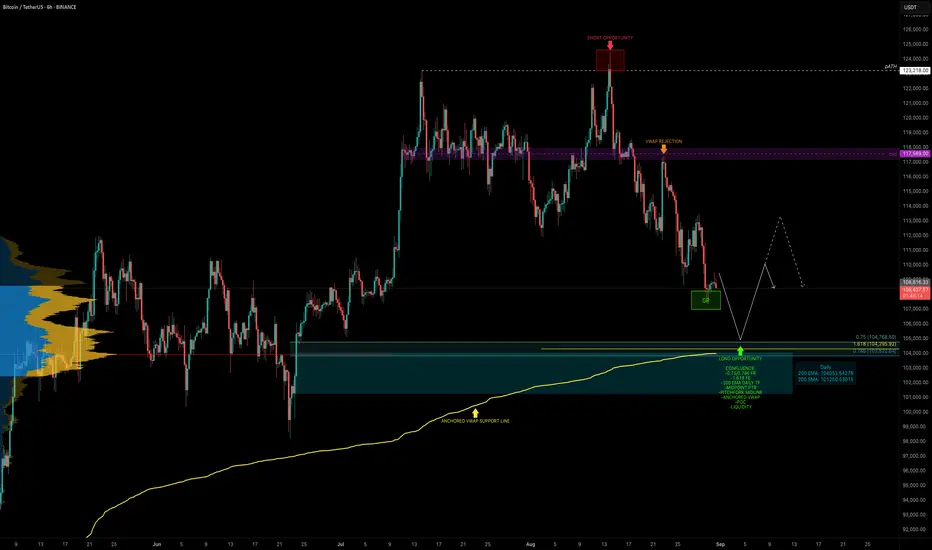
BTC — Identifying High-Probability Long Zone With ConfluenceBTC has been in a 17-day downtrend since the swing failure at the ATH (~$124.5K). That move acted as both a bull trap and the completion of a 5-wave structure, offering an excellent short entry at the highs.
Now the key question: where is BTC heading next, and where is the next high-probability trade setup?
Current Situation
BTC is sitting at the 0.618 Fib retracement ($108,236) of the move from $98.2K → $124.5K. Many traders are already buying this level, which is valid but a deeper zone below offers stronger confluence.
🧩 Confluence Zone: $105K–$104K
POC of the previous trading range → ~$104K
0.75 Fib retracement: $104,768.5
0.786 Fib retracement: $103,823
Anchored VWAP (from swing low $74,508) → just above the 0.786 Fib
Midpoint of the previous 60-day range
Liquidity cluster → positioned around $105K–$104K
1.618 Fib extension target: $104,296
Pitchfork midline → supporting this level
200 EMA (daily) → adding dynamic support at ~$104K
This creates a high-confluence support cluster between $105K–$104K, making it the next strong long setup.
🟢 Long Trade Setup
Entry Zone: $106K–$104K
Stop-Loss: Below $103K
TP: $110K-$114K
R:R Potential: 1:2+
Technical Insight
The ATH rejection confirmed both bullish exhaustion and a completed 5-wave move, triggering the current correction.
While the 0.618 retracement offers valid support, the $105K–$104K zone holds significantly stronger confluence.
This makes it the most attractive high-probability long entry zone in the current structure.
🔍 Indicators used
Multi Timeframe 8x MA Support Resistance Zones → to identify support and resistance zones such as the daily 200 EMA/SMA.
➡️ Available for free. You can find it on my profile under “Scripts” and apply it directly to your charts for extra confluence when planning your trades.
_________________________________
💬 If you found this helpful, drop a like and comment!
GUN Market Update📊 LSE:GUN Market Update
LSE:GUN trading around $0.02295 🟢
👉 Key level to watch for potential bounce and long entry 🚀
⚡ Momentum building — but wait for confirmation before entering.
⚡ Trade smarter, not hope 🔑

BTC – the $130K Roadmap!CRYPTOCAP:BTC is showing strong bullish structure both short-term and long-term 📈
After forming a clean inverse head & shoulders at support, price broke higher and is now trading within a rising channel.
🟢 Bullish short-term: As long as BTC holds above the $113,000 – $115,000 structure zone, buyers remain in control.
📊 Bullish long-term: Price continues to respect the major ascending channel, keeping the bigger picture bias to the upside.
🎯 Next target: If momentum continues, BTC could be on track toward the $130,000 resistance.
Patience here is key ⏳ — pullbacks into support could offer fresh continuation entries for the bulls 🐂.
⚠️ Disclaimer: This is not financial advice. Always do your own research and manage risk properly.
📚 Stick to your trading plan regarding entries, risk, and management.
Good luck!
All Strategies Are Good; If Managed Properly!
~Richard Nasr

BITCOIN PREDICTION: NEXT MASSIVE MOVE TO HERE - INCOMING!!!!!!!Yello Paradisers! In this video, we have been going through multi-time frame analysis as professional traders using Elliott Wave Theory and other advanced technical indicators and analysis techniques.
On the ultra-high time frame, we have been going through the Elliott Wave price section since 2023. We have taken a look at the Moving Average Trendline Touch, which worked perfectly, the Channel Retest that is incoming, and the Bearish Divergence with Bearish Cross.
On medium and high timeframe charts, I have been sharing with you the completed zigzag and first wave. We are currently in the secondary wave, waiting for it to finish, along with resistances and bullish and bearish divergences.Together with that, there are shooting star patterns, and on a low timeframe, I have been sharing with you the triple top reclaim and the next possible resistances, and what the next resistance and target are from a multiple timeframe perspective.
Paradisers! Keep in mind to trade only with a proper professional trading strategy. Wait for confirmations. Play with tactics. This is the only way you can be long-term profitable.
Remember, don’t trade without confirmations. Wait for them before creating a trade. Be disciplined, patient, and emotionally controlled. Only trade the highest probability setups with the greatest risk to reward ratio. This will ensure that you become a long-term profitable professional trader.
Don't be a gambler. Don't try to get rich quick. Make sure that your trading is professionally based on proper strategies and trade tactics.

PPI Shock Pushes Bitcoin Higher – Fake Pump Before Drop?Bitcoin ( BINANCE:BTCUSDT ) has been making high momentum Sharpe moves over the last few days , which has made it a little difficult to trade, which is why I am still sticking to my previous analysis , and this analysis is an update of targets and even new entry points .
Bitcoin is currently moving near the Resistance zone($114,720-$113,580) , Reversal Zone(PRZ) , Cumulative Short Liquidation Leverage($114,510-$113,771) , Monthly Pivot Point , and Resistance lines = a set of Resistances
A few minutes ago, the US Core PPI m/m and PPI m/m data were released, which triggered a pump in Bitcoin . In my view, we should wait for Bitcoin to digest this shock and then continue its real trend .
Do you agree with me?
In terms of Elliott Wave theory , it seems that Bitcoin has completed microwave 5 of microwave C of the main wave Y , and we can expect a downtrend .
I expect Bitcoin to drop again to at least $111,600(First Target) .
Second Target: $110,883
Third Target: $110,000 and more dumps.
Stop Loss(SL): $114,923(Worst)
CME Gap: $117,235-$113,800
Cumulative Long Liquidation Leverage: $110,822-$109,752
Note: Be sure to follow capital management and do not take risks.
Please respect each other's ideas and express them politely if you agree or disagree.
Bitcoin Analysis (BTCUSDT), 1-hour time frame.
Be sure to follow the updated ideas.
Do not forget to put a Stop loss for your positions (For every position you want to open).
Please follow your strategy and updates; this is just my Idea, and I will gladly see your ideas in this post.
Please do not forget the ✅' like '✅ button 🙏😊 & Share it with your friends; thanks, and Trade safe.
