Bitcoin Warming Up- Like always, everything in the graphic to simplifies the information, stay simple is better.
- Bitcoin is known for its extreme price volatility, which can lead to major fluctuations, such as a significant crash in value followed by a rapid doubling of its price in a very short period, for that simple reason i avoid to predict low timeframe moves.
- Now check the hidden bullish divergence, check the level of BBW, the volality could be low, but TheKing could be ready to make parabolic move soon or later.
- I do my best to try to post at the good time for medium long term investment.
- Don't forget that 125,000$ is far to be enough.
Happy Tr4Ding !
Btc-bitcoin

BTCUSD: Fake Breakout and Drop to Support LineHello everyone, here is my breakdown of the current Bitcoin setup.
Market Analysis
From a broader perspective, the price of Bitcoin has transitioned from a downward channel into a large rising wedge pattern. This structure has defined the price action for several weeks, creating a volatile environment with clear boundaries at the support zone near the 109000 level and the resistance zone up to the 113000 area.
Currently, we are at a very interesting and critical point. The price has once again rallied to the top of the Wedge and is testing the major horizontal resistance at the 112500 level. This is the third significant test of this ceiling in recent history.
My Scenario & Strategy
My scenario is built on a repeating pattern of behavior I've observed at this resistance. On the two previous tests of this 112500 area, the price created a 'fake breakout', briefly pushing above the level only to be aggressively sold off. This repeated failure is a strong clue that sellers are dominant here.
My expectation is that history will repeat itself. I'm looking for the price to make one more 'fake breakout' push into the 112500 - 113000 resistance zone. A swift reversal and a fall back below the 112500 level would be the key signal that sellers have once again taken control. The primary target for this move is 110700, which aligns with the ascending wedge support line.
That's the setup I'm tracking. Thank you for your attention, and always manage your risk.

BTC's situation+next targets and expected movementsThe price seems to have completed the corrective wave, and from now on, it's time for a price increase, which will continue up to around $150k .
_ _ _ _ __ _ _ _ _ _ _ _ _ _ _ _ _ _ _ _ _ _ _ _ _ _ _ _ _ _ _ _
✅Thank you, and for more ideas, hit ❤️Like❤️ and 🌟Follow🌟!
⚠️Things can change...
The markets are always changing and even with all these signals, the market changes tend to be strong and fast!!

BTC - Are the bulls looking for a liquidity grab?Market Context
Bitcoin is holding strong after bouncing from a higher support zone and is now pressing into an area packed with liquidity. The recent bullish price action has carved out multiple fair value gaps on the way up, each serving as confirmation of demand and strengthening the bullish structure. Above current price lies a major cluster of buy-side liquidity — a magnet for price.
Fair Value Gaps & Confirmations
On the way up, price created several bullish fair value gaps that have each been respected as support. The first, second, and now third retests into these imbalances show that demand continues to step in, absorbing supply and building pressure upward. Adding to that, a bullish inversion fair value gap (IFVG) has formed, giving extra confirmation that buyers are in control.
Liquidity Target Above
The most obvious draw for price is the heavy buy-side liquidity resting above recent highs. With so many stops positioned there, the market is incentivized to push higher and sweep that zone. The path toward it could involve another retest into one of the fair value gaps below before expansion takes place, or a direct continuation straight into the liquidity pocket.
Final Thoughts
This structure is showing textbook bullish strength: stacked fair value gaps, IFVG confirmation, and a clear liquidity pool overhead. Unless the market breaks back below the deeper support zone, the expectation remains a run into buy-side liquidity.
If this breakdown sharpened your view, a like is appreciated — and I’d love to hear from you: do you expect a retest first, or do we shoot straight into liquidity?

BTC 4H Analysis - Key Triggers Ahead | Day 38😃 Hey , how's it going ? Come over here — Satoshi got something for you!
⏰ We’re analyzing BTC on the 1-Hour timeframe.
👀 On the 4-hour timeframe of Bitcoin we can see that Bitcoin was under a descending trendline, and each time it touched this trendline it faced selling pressure. Bitcoin broke this trendline at the end of August, and since the beginning of September until now it has been ranging below the $113,000 resistance, where it has touched this level 3 times and then got rejected downward. Usually, these kinds of zones don’t break easily, and if they do, it is together with major global economic news.
⚙️ The key RSI zone of Bitcoin in the 4-hour timeframe is at 65. A swing scenario is considered for Bitcoin after the news, and if this news comes in favor of the risky market (crypto), it can move above the 65 range and even enter overbought territory.
🕯 The size, volume, and number of green candles have almost increased, while red candles are still accompanied by selling pressure. There is a taker-seller zone above, at the $113,000 resistance, that has kept the price down. With the release of news, a good wave of capital can enter or exit the market.
📊 On the 4-hour timeframe of USDT.D we can see that Tether dominance is in a very important support zone, and losing this support can bring good volume into the market. I think this support break can also happen with today’s PPI news. Tether dominance, like Bitcoin, was above a continuation ascending trendline, but now it has broken the trendline and is ranging below it. This shows us the importance of the news!
📊 On the 4-hour timeframe of BTC.D we can see that Bitcoin dominance is in a support zone, and with a 4-hour candle that looks like multiple profit-taking it got supported and moved upward. Although the move is small, we should pay attention. The resistance zone of Bitcoin dominance is at 58.36%, and the support zone is at 58.06%. Losing these zones can give altcoins very strong moves.
🔔 Bitcoin is now under an important resistance at $113,000. If this zone is broken, it can move upward again. A very strong support zone is also built by maker buyers at $107,627, which is quite far from the current price. For a long position, wait until the taker-seller zone is taken out with a whale candle and then enter on the pullback. Also pay attention that altcoins can give us the most profit during this period when both Bitcoin dominance and Tether dominance are dropping.
❤️ Disclaimer : This analysis is purely based on my personal opinion and I only trade if the stated triggers are activated .

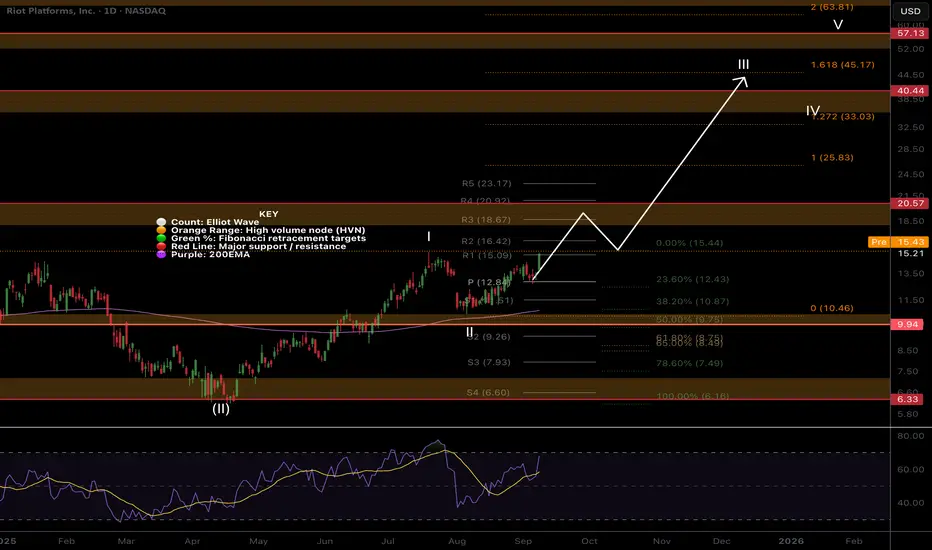
RIOT Continues wave 3.NASDAQ:RIOT is moving well in wave 3 after price completed wave 2 at the triple support -0.5 Fibonacci retracement, High Volume Node (HVN) and daily 20EMA.
Fibonacci extension targets for wave 3 are minimum $45.17, which falls in line with wave 4 retesting the High Volume Node resistance as support at $34.
Daily RSI will put in bearish divergence if we continue higher today so watch out for that. An initial rejection or consolidation at $18 HVN is expected.
Analysis invalidated below $10.5
Safe trading
US100 - New Highs are coming!Market Context
The US100 is trading within a strong bullish structure after bouncing from a well-defined support zone. Price has been respecting key levels on the way up, forming fair value gaps (FVGs) that act as stepping stones for continuation. The overall picture points to a market that is building momentum for a potential liquidity grab higher.
Support Zone & Initial Rally
The chart shows a strong support zone at the lows, which provided the foundation for the current bullish impulse. Once price tapped into this area, buyers stepped in aggressively, leaving behind multiple bullish imbalances on the way up. This confirms that institutional interest is present at these levels.
Fair Value Gaps & Structural Strength
On the rally, price created overlapping FVGs, including a bullish fair value gap and an inversion fair value gap (IFVG). Importantly, candles never closed below the primary FVG — reinforcing its validity as strong demand. This means that even if price retraces, these areas will be closely watched for re-entries.
Liquidity Grab & Next Move
Above current price action lies a clear buy-side liquidity (BSL) level. The market is likely to target this zone, either directly from current levels or after a retest into the stacked FVGs. A liquidity sweep above the highs would be the natural continuation of the bullish structure, unlocking the potential for new short-term highs.
Final Thoughts
The US100 is showing a textbook bullish setup: strong support, healthy retracements, and unmitigated FVGs acting as demand. As long as the lower support holds, the expectation remains for a run into the BSL above.
If this analysis brought value, drop a like — and let me know: are you waiting for the retest, or do you think the market runs the highs straight away?

BTC 1H Analysis - Key Triggers Ahead | Day 37💀 Hey , how's it going ? Come over here — Satoshi got something for you!
⏰ We’re analyzing BTC on the 1-Hour timeframe.
👀 On the 1H timeframe for Bitcoin, we can see that after breaking the 111,330$ resistance, BTC managed to push higher and is now approaching its next key resistance at 113,000$. This level overlaps with the multi-timeframe range high, making it a critical zone. A clean breakout above this area could drive BTC toward higher price targets.
⚙️ On the RSI, the key zones are around 70 and 50. If momentum pushes past these levels—especially with positive news flow—BTC could enter an overbought phase, fueling further upside.
🕯 Candle structure is showing strength: green candles are getting larger with more volume. At the range high, we’ve seen some red candles forming, reflecting seller absorption. However, each test shows weaker selling pressure compared to the last time BTC hit this level—back then, price dumped sharply within just 2 red candles.
📊 Looking at Tether Dominance (USDT.D) on the 1H, after reacting to 4.45%, it broke lower toward 4.39% and even closed below that level. Right now, it’s retesting 4.39%. If this new support fails, dominance could extend lower toward the next support. A breakdown below 4.37% would be strong confirmation for BTC breaking its range high.
🔔 Trading plan : Bitcoin is currently sitting just below the 113,000$ resistance. Don’t rush into a position here. Ideally, wait for : Another test of this resistance. A confirmed breakout with a pullback/retest of 113,000$. Enter long after the retest for a safer entry.
❤️ Disclaimer : This analysis is purely based on my personal opinion and I only trade if the stated triggers are activated .

Bitcoin Cycles: History Repeating Itself?Bitcoin has always moved in cycles — a strong impulsive rally 📈 (1), followed by a healthy correction 🔻 (2), then a breakout above the previous high 🔓 (3).
Looking at the chart, the current price action is following this same rhythm once again. After the last correction, BTC bounced strongly, retested previous highs, and is now consolidating before its next potential move.
If this pattern continues to repeat, the next leg could take Bitcoin toward the $140,000 target 🎯 — aligning perfectly with the upper bound of the long-term channel.
👉 The past doesn’t guarantee the future, but BTC’s structure suggests the market might just be writing the same story again.
💬 What’s your bias here? Are you bullish or waiting for a deeper pullback?
📚 Always follow your trading plan regarding entry, risk management, and trade management.
Good luck!
All Strategies Are Good; If Managed Properly!
~Richard Nasr

BTC - Are You Ready?Hello TradingView Family / Fellow Traders. This is Richard, also known as theSignalyst.
📈BTC has been overall bullish trading within the rising wedge pattern marked in red.
This week, BTC has been retesting the lower bound of the channel.
Moreover, the orange zone is a strong strong and previous all-time high.
🏹 Thus, the highlighted blue circle is a strong area to look for buy setups as it is the intersection of the lower red trendline and previous ATH.
📚 As per my trading style:
As #BTC is around the blue circle zone, I will be looking for trend-following bullish reversal setups (like a double bottom pattern, trendline break , and so on...)
📚 Always follow your trading plan regarding entry, risk management, and trade management.
Good luck!
All Strategies Are Good; If Managed Properly!
~Richard Nasr

BTCUSD - Last Daily Run Up BTCUSD I believe has one more left in the tank.
From there it will likely plateau and alts will explode. This idea is supported as BTCD is dropping heavily.
Still bullish but coming to the top.
3 Arrows up are three moves up in a row.
Daily timeframe

Bitcoin no local peak yetBitcoin no local peak yet, global run continues.
The CRYPTOCAP:BTC rally is far from over.

BITCOIN PREDICTION: MASSIVE MOVE INCOMING!!! (Guard UP NOW) Yello Paradisers! In this video, we are professionally analyzing Bitcoin. We are doing multi-time frame analysis as professional traders. First, we are starting on an ultra-high time frame chart where I'm sharing with you the magical moving average trend line, how it's perfectly working as a support, and the possible channel retest and the bearish cross.
On the high timeframe chart, we are looking at a zigzag that has finished with the highest probability. The first wave of an impulse has started—that is the question. We have a bullish divergence plus a shooting star, and we are waiting for the daily candle to close and reclaim that resistance to confirm some nice long positions.
On the medium timeframe, I'm sharing with you the bearish divergence we are waiting for across and the possibility of finishing the first wave.
On the low timeframe chart, we are going through the ending diagonal. Watch the fourth high; it cannot be reclaimed. Until it gets reclaimed, we are actively looking for short positions. We are anticipating a huge move, and we are going to be positioning ourselves aggressively very soon.
Paradisers! Keep in mind to trade only with a proper professional trading strategy. Wait for confirmations. Play with tactics. This is the only way you can be long-term profitable.
Remember, don’t trade without confirmations. Wait for them before creating a trade. Be disciplined, patient, and emotionally controlled. Only trade the highest probability setups with the greatest risk to reward ratio. This will ensure that you become a long-term profitable professional trader.
Don't be a gambler. Don't try to get rich quick. Make sure that your trading is professionally based on proper strategies and trade tactics.

BTCUSDT (Daily)### 🔎 **Chart Context**
* Pair: **BTC/USD**
* Exchange: **Binance**
* Timeframe: **1D (Daily)**
* Current price: \~**112,231**
* Bitcoin is consolidating above the **111,000 support zone**, while the projection targets **130,500** as the next major upside level.
* The structure remains **bullish**, with higher lows intact and fair value gap (FVG) marked below.
---
### 📊 **Key Observations**
1. **Market Structure**
* Last major swing high: **123,731**.
* Recent correction found support near **111,971 – 111,917**, forming a higher low.
* Uptrend remains intact above **100,000 – 104,500 key supports**.
2. **Support Zones**
* **111,900 – 111,500**: Immediate intraday support.
* **104,553 – 100,424**: Strong demand zone aligning with EMA cluster.
* **98,385 – 99,500**: Historical support + fair value gap.
3. **Resistance Zones**
* **119,900 – 123,731**: First resistance block.
* **130,500 (TP)**: Chart projection and major liquidity target.
* Above 130K → possible extension toward **136,000 – 140,000**.
4. **Fair Value Gap (FVG)**
* Marked between **98,000 – 104,500**, which could be retested if BTC fails to sustain current support.
---
### 📈 **Bullish Scenario (Higher Probability)**
* BTC holds above **111,900** support and pushes higher.
* Path: Retest **119,900 → 123,731 → breakout toward 130,500** (main TP).
* If momentum continues, rally could extend toward **136K – 140K**.
---
### 📉 **Bearish Scenario (Risk Case)**
* Breakdown below **111,900** opens path toward:
* **104,500 – 100,400 demand zone**.
* If this fails, price could dip into **98,000 – 99,500 FVG fill**.
* Structure flips bearish only if BTC closes below **98K** on daily.
---
### ⚡ **Trading Plan**
* **Long Setup (Preferred):**
* Entry: 111,900 – 112,200 retest (confirmation bounce).
* TP1: 119,900
* TP2: 123,731
* TP3: 130,500
* Stop: Below 109,500
* **Short Setup (Countertrend):**
* Entry: Rejection at 123,700 – 124,000.
* TP: 111,900 → 104,500
* Stop: Above 125,500
---
### ✅ **Conclusion**
BTC/USD daily chart shows **bullish continuation bias**. Holding above **111,900** strengthens the case for a rally toward **119,900 → 123,731 → 130,500**. A deeper retest into **104K – 100K demand zone** would still be healthy as long as price stays above **98K**.

BTC 1H Analysis - Key Triggers Ahead | Day 36💀 Hey , how's it going ? Come over here — Satoshi got something for you!
⏰ We’re analyzing BTC on the 1-Hour timeframe.
👀 On the 1-hour timeframe for Bitcoin, we can see that BTC has successfully stabilized above the alarm zone at $111,300 and is now sitting right below the resistance at $112,105. With stronger volume and volatility, this setup could give us a long trade opportunity.
⚙️ Key RSI oscillator levels are at 70 and 50. If price action pushes RSI beyond these levels, Bitcoin can continue its current bullish move and sustain the trend. At the moment, RSI is sitting just below the Overbought threshold, and once it enters this zone, the identified resistance could be broken more easily.
🕯 With the start of the new week, buying volume has increased, and the weekly candle closed fairly strong. On the 1-hour chart, the size, volume, and number of green candles are all rising.
📊 Looking at the 15-minute timeframe of Tether dominance (USDT.D), after breaking and stabilizing below 4.45%, dominance continues to move lower. The next support lies at 4.41%, and if this is broken and confirmed, Bitcoin could see even stronger upside momentum early in the week.
🔔 Currently, Bitcoin is sitting just below its resistance. The best approach is to wait for a pullback, either below or above this level, and then open a position with a setup candle confirmation or a multi-timeframe breakout. Two possible scenarios exist here, where a pullback could also give us a tighter stop-loss opportunity.
❤️ Disclaimer : This analysis is purely based on my personal opinion and I only trade if the stated triggers are activated .

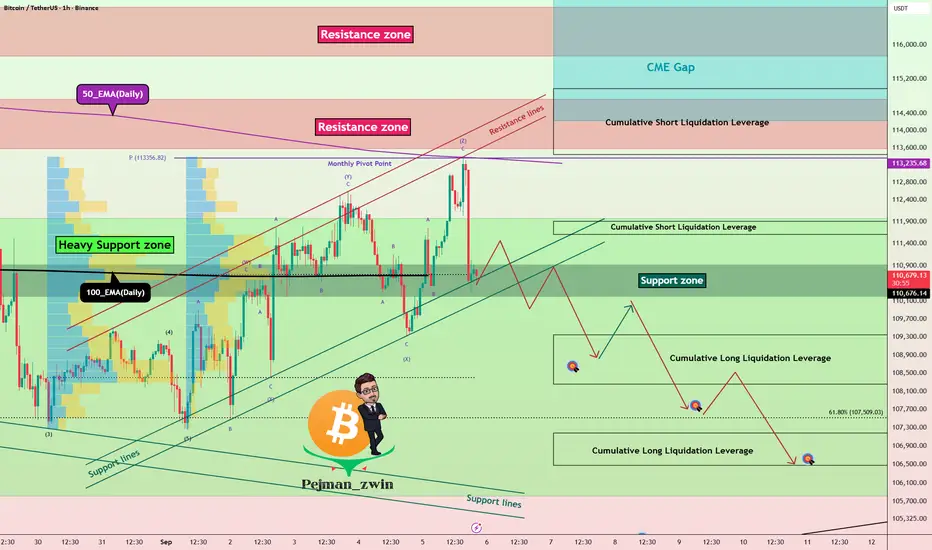
Bitcoin Roadmap – Breakdown Toward $107K or Bounce?Bitcoin ( BINANCE:BTCUSDT ) has been moving with high momentum this week , with the US indexes and Gold ( OANDA:XAUUSD ) bullish .
Bitcoin is currently trying to break the Support lines , Support zone($110,920-$110,200) and 100_EMA(Daily) .
In terms of Elliott Wave theory , it seems that the waves that Bitcoin has made this week have been in the form of a Triple Three Correction(WXYXZ) .
I expect Bitcoin to decline to at least $109,133(First Target) AFTER the Supports are broken.
Second Target: $107,740
Third Target: $106,660
Stop Loss(SL): $114,108(Worst)
Note: As I said at the beginning of this analysis, the financial markets have been a bit emotional and sudden with their movements this week, so always be prepared for any scenario and pay more attention to capital management.
Note: Generally, trading volume is low on Saturdays and Sundays. Perhaps it is a bit far-fetched to expect a break of the Heavy Support zone($111,980-$105,820) during the weekend. What do you think?
Cumulative Short Liquidation Leverage: $114,976-$113,440
Cumulative Short Liquidation Leverage: $111,907-$111,607
Cumulative Long Liquidation Leverage: $109,346-$108,259
Cumulative Long Liquidation Leverage: $107,181-$106,479
CME Gap: $117,235-$113,800
Please respect each other's ideas and express them politely if you agree or disagree.
Bitcoin Analysis (BTCUSDT), 1-hour time frame.
Be sure to follow the updated ideas.
Do not forget to put a Stop loss for your positions (For every position you want to open).
Please follow your strategy and updates; this is just my Idea, and I will gladly see your ideas in this post.
Please do not forget the ✅' like '✅ button 🙏😊 & Share it with your friends; thanks, and Trade safe.

BTC 1H Analysis - Key Triggers Ahead | Day 35💀 Hey , how's it going ? Come over here — Satoshi got something for you !
⏰ We’re analyzing BTC on the 1-Hour timeframe .
👀 On the 1-hour timeframe for Bitcoin, we can see that after touching its resistance at $111,300, Bitcoin moved toward its short alarm zone and activated it. However, the market didn’t show much selling pressure or bearish momentum. Currently, Bitcoin is ranging with very low volume, but with the new week starting, stronger volume could enter the market.
⚙️ Key RSI levels for Bitcoin are at 70 and 50. If RSI crosses these thresholds, Bitcoin could start a strong move — most likely at the beginning of the new week.
🕯 The size and number of green candles have slightly increased, and we are now sitting right below the critical resistance at $111,300. It’s likely that this level will be broken in the coming week.
🖥 This week has plenty of economic news events, which means the market could see high volatility. Overall, it looks like a good week for trading.
📊 Looking at the 1-hour timeframe of Tether dominance (USDT.D), after a strong rally it recently got rejected from the 4.51% level. The market sentiment shifted toward long positions, and selling pressure didn’t sustain. If 4.45% in Tether dominance breaks down, significant USDT could flow into Bitcoin and altcoins.
🔔 The key alarm zones for Bitcoin are set at $110,500 for short positions and $111,300 for long positions. Breaking these zones in the upcoming week could give us solid trade opportunities. Keep in mind that the economic news scheduled this week can strongly influence the market.
❤️ Disclaimer : This analysis is purely based on my personal opinion and I only trade if the stated triggers are activated .

BTC - Bullish continuation in the makingMarket Context
BTC has recently broken out of a long-standing descending trendline, marking a significant shift in sentiment. This breakout signals the end of the controlled downtrend and sets the stage for a possible bullish continuation. At the same time, the chart shows a clear sweep of sell-side liquidity at the lows, which often serves as the fuel for a reversal.
Trendline Breakout & Liquidity Sweep
The bullish breakout of the old upper trendline is an important technical event. Combined with the earlier sell-side liquidity sweep, this suggests that downside liquidity has been cleared and that the path of least resistance could now be higher. Such a combination often marks the start of a new leg in the trend.
Market Structure Shift Retest
Following the breakout, price has pushed higher and printed a market structure shift (MSS). The current retest of this MSS zone will be key — if it holds, it provides the ideal spot for bulls to reload positions. This retest acts as confirmation that the breakout is valid, not just a short-lived deviation.
Next Liquidity Grab & Upside Targets
Above the current range sits a clear buy-side liquidity pool. The next logical move would be a grab of that liquidity, which could extend into a more aggressive bullish expansion toward higher levels. The structure suggests a stair-step move higher: liquidity grab, retest, and then continuation toward 115k–117k zones.
Final Thoughts
The sell-side liquidity sweep, trendline breakout, and market structure shift all point to a bullish shift in momentum. The key lies in how price reacts to the retest — hold it, and the next liquidity levels are likely to be taken.
If this breakdown helped clarify the setup, a like is much appreciated — and let me know in the comments: are you playing the retest, or waiting for the liquidity grab above?

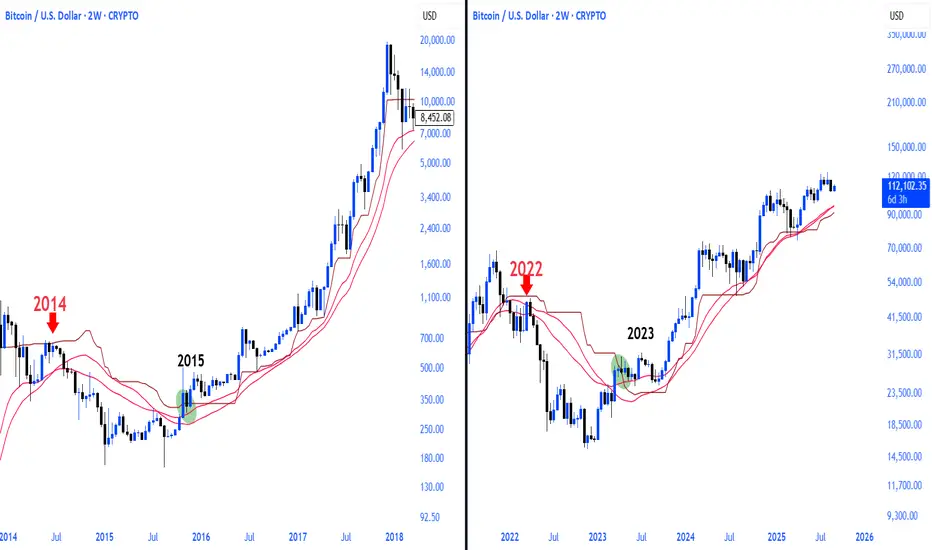
bitcoin 2017 vs. 2025Bitcoin Same rhythm, same feelings.
History is repeating itself, the trend is still strong.
CRYPTOCAP:BTC

BTC's Situation, A Comprehensive Analysis !!!As you can see, after breaking the bearish wedge, the price dropped sharply. The question is, how far will this price decline continue? In my opinion, the price could remain bearish until the PRZ (Potential Reversal Zone), which is around the 107500 level. After that, an increase in buying pressure could lead to a price rise to higher levels.

get readyget ready says btc
have you seen crossovers - up and down
not the ema crossing another ema
or sma crossing another sma
i'm talking about ema crossing its own sma
i've never seen checking or using these type of crossover analysis
here you will see that ema 50 crossing down sma 50 ( dotted orange crossed down blue )
as similar ema 100 crossing down sma 100 ( dotted red crossing down red )
now the ema 50 about to cross down sma 100
can you see that?
here we used 50, 100, 200 & 365
check it out & try it out !!
