Bitcoin is correcting ┆ HolderStatBINANCE:BTCUSDT on the 4h chart is retracing into the $110,700 support after hitting new ATH levels. Previous triangle and higher low formations show a continuation structure, where pullbacks act as accumulation. If buyers defend $110,000, the market could regain momentum toward $120,000–122,000.
Btc-bitcoin

IREN Just Won't Quit! Wave 3 Behabviour!IREN Continues its push into price discovery with strong candle spread despite the drop in Bitcoin and range in the S&P. Strong wave 3 herding behaviour!
Price appears to be overextending in wave 5 of (iii) with a target of the R5 daily pivot.
Bearish divergence persists on the overbought RSI.
Safe trading

$COIN Local Chart, Still WaitiingNASDAQ:COIN Coinbase is still resetting towards the target of $275 quadruple support - High Volume Node, ascending 200EMA, 0.5 Fibonacci retracement & S2 pivot point.
Daily RSI is setting up with bullish divergence at the moment near oversold.
There is a gap that never filled at the golden pocket ~$217 so this would be the secondary target if we get a deeper sell off.
Safe trading.

Bitcoin SOPR #3- Quick Update.
- Everything is in graphic.
- Check SOPR + Green Circles.
- Did some smart hands took their benefits ?
- Yes.
- Does it means BTC price will crash ?
- No.
- Does it means we are in a correction ?
- Not really.
- Does it means it's a boring phase ?
- Yes.
Happy Tr4Ding !

Bitcoin SOPR- Keeping facts simple as possible.
- Not a price prediction.
- Everything in Chart.
- SOPR is your friend.
- Exhaustion #2.
- BTC price still stable.
Happy Tr4Ding !

BTC Wave C of (2) underway?BTC appears to have completed wave (1) at the daily R1 pivot with wave C of (2) underway.
The initial target is the triple support - Ascending daily 200EMA, High Volume Nodeand 0.382 Fibonacci retracement $102k.
BTC has had shallow retracements this cycle, often ending at the 0.382, demonstarting investor psychology - people just cant wait to buy the dip!
Daily RSI is making its way into oversold which would print a bullish divergence from the wave 4 low unless this value was penetrated.
Safe trading

Is the Crypto Winter here?Ethereum is seeing a very large decline today.
Hitting massive long term technical resistance in an overbought and hyped up treasury bull run.
It looks like Ethereum has done a prefect bull trap of the all time high price.
Our members received the short alert on Friday and its been a very profitable trade thus far.
A failed breakout of all time highs can lead to catastrophic falls.
The total crypto market caps need to be monitored for a head & shoulders topping formation.

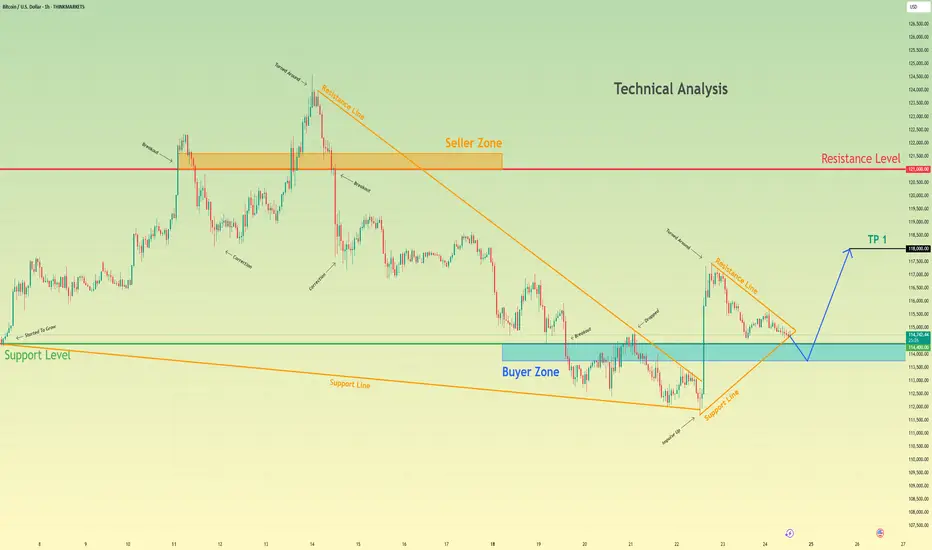
Bitcoin will exit of triangle and then bounce up from buyer zoneHello traders, I want share with you my opinion about Bitcoin. Following a decisive breakout from a prior downward wedge, Bitcoin entered a phase of balance and consolidation that is currently forming a symmetrical triangle. This new market environment signifies contracting volatility, with the price being methodically squeezed between a descending resistance line and an ascending support line. The asset has reached a critical juncture, as it is now at the apex of this formation, where the ascending support line converges with a strong horizontal support level at 114400. The primary working hypothesis is a long scenario, based on the expectation of a 'fake breakdown' or 'liquidity hunt'. It is anticipated that the price may briefly dip below the support line and into the buyer zone to trigger stops before staging a strong reversal. A swift reclaim of the 114400 level would be the ultimate confirmation of this bullish thesis, validating the original uptrend. This reversal is then expected to trigger a significant upward rebound. Therefore, the TP is logically placed at the 118000 level, as this represents a key area of prior price interaction and serves as a prudent first objective for a rally of this nature. Please share this idea with your friends and click Boost 🚀
Disclaimer: As part of ThinkMarkets’ Influencer Program, I am sponsored to share and publish their charts in my analysis.
BITCOIN MASSIVE CRASH TOWARDS $44K JUST STARTED!!!? (warning) Yello Paradisers!
In this video, I'm sharing with you the CME futures gap that we have created and what needs to be done to close it. On the ultra-high time frame, I'm sharing with you the bearish cross. We are shifting our focus afterward to the high time frame where I'm seeing the bullish divergence. I'm telling you where the daily candle cannot close.
Then, we move our focus to the medium time frame, where I'm sharing with you the RSI bullish divergence plus the support. On the lower time frame, we will look in the next video.
Paradisers! Keep in mind to trade only with a proper professional trading strategy. Wait for confirmations. Play with tactics. This is the only way you can be long-term profitable.
Remember, don’t trade without confirmations. Wait for them before creating a trade. Be disciplined, patient, and emotionally controlled. Only trade the highest probability setups with the greatest risk to reward ratio. This will ensure that you become a long-term profitable professional trader.
Don't be a gambler. Don't try to get rich quick. Make sure that your trading is professionally based on proper strategies and trade tactics.

BTCUSD: Correction Toward $100K or Rebound Ahead?BTCUSD – Weekly Overview
Bull run over at $111K? Or just a deeper correction?
Bitcoin starts the last week of August under pressure, with traders eyeing a potential retest of $100K after a sharp long liquidation shook the market. Whales are rotating into ETH while smaller holders continue accumulating, leaving BTC at a crossroads.
Meanwhile, macro focus remains on the Fed’s “preferred” inflation gauge later this week, as rate-cut bets intensify across risk assets.
🔹 Technical Outlook
BTC is currently approaching $110,370 — the key pivot.
A daily close below 110,370 would confirm bearish continuation, targeting 106,200 – 102,650 – 100,000.
As long as price trades above 110,370, bulls still have a chance.
A daily close above 113,800 would flip sentiment back bullish, opening the path toward 120,600 and 124,000.
🔹 Key Levels
Pivot: 110,370
Support: 106,200 – 102,650 – 100,000
Resistance: 113,800 – 120,600 – 124,000
✅ Summary:
Bitcoin sits at a critical level. Below 110,370, the correction could deepen toward $100K. But stabilization and a breakout above 113,800 would revive the bull trend, with upside targets at 120K+. Expect volatility this week as macro and earnings catalysts collide.

BTC 1H Analysis – Key Triggers Ahead | Day 22💀 Hey , how's it going ? Come over here — Satoshi got something for you !
⏰ We’re analyzing BTC on the 1-hour timeframe timeframe .
👀 On the 1-hour Bitcoin chart, after the last attempt to push toward resistance, it faced a strong rejection at $115,000 and moved toward the box's lower boundary. Currently in the alarm zone for a short position, but personally, I wouldn’t open a short here.
⚙️ Key RSI levels are 45 and 20. The 20 level is a support in the heart of oversold territory, where Bitcoin’s volatility spikes and often sees a reversal. The 45 level acts as resistance, with volatility triggering reversals upon hitting it.
🕯 Volume shows larger and more frequent red candles, with price heading toward its support levels.
💵 USDT.D broke and held above 4.27% but got rejected at 4.4%. A break and hold above 4.4% could increase selling pressure on Bitcoin.
🔔 Bitcoin’s alarm zones today aren’t very logical, so we can focus on altcoins instead. I’ll post a few altcoin picks on TradingView and the channel today.
❤️ Disclaimer : This analysis is purely based on my personal opinion and I only trade if the stated triggers are activated .

Bitcoin back at 112k: Bullish Illusion or Bearish Truth?1. What happened lately
In my previous BTC analysis, I mentioned that as long as the 110k zone holds, the bullish structure technically remains intact.
On Friday, Powell’s speech lifted the market precisely from that zone, as the possibility of rate cuts injected optimism across risk assets, including crypto.
2. The psychological trap
But here’s the question I keep asking myself: is this genuine strength, or just wishful thinking? I’ve said it many times — trade what you see, not what you hope for . And what the charts are showing right now is not as promising as the initial bounce might suggest.
3. Technical signals
- BTC quickly returned to the 112k support level, erasing the Friday rally.
- Price remains under the trendline that started in April.
- The bounce looks more like a retest of broken levels than a new impulsive leg.
- Structurally, we can even identify a head and shoulders pattern with the neckline around the 110k zone, although not perfectly shaped.
4. Reading between the lines
It’s hard for me to believe that Bitcoin came back to the same support just to give latecomers another easy buying opportunity. More likely, the “rate cut euphoria” was dead cat bounce, and the market is telling us something different than the headlines.
5. Conclusion
At this moment, I remain neutral in my positioning but leaning bearish in my outlook. Optimism is tempting, but discipline requires us to trust the charts, not our hopes.
And... if it looks like a duck, walks like a duck, and quacks like a duck… it’s probably a duck. 🦆

BTC 1H Analysis – Key Triggers Ahead | Day 21💀 Hey , how's it going ? Come over here — Satoshi got something for you !
⏰ We’re analyzing BTC on the 1-hour timeframe timeframe .
👀 On the 1-hour timeframe of Bitcoin, we can see that Bitcoin has still maintained a good bullish trend after breaking out of the channel and is currently in correction, but it hasn’t yet formed a proper structure for trades.
⚙️ The key RSI zones are 40 and 70. When the oscillator crosses these levels, trading volatility increases and this will cause price movement.
🕯 Candle size and volume grew during the Jackson Hole event, but since the market is in holidays, there isn’t much volume present. We need to wait for the opening of the next weekly candle for volume to enter the market.
💵 On the 1-hour timeframe of USDT.D , we can see that during the Jackson Hole event, Tether dominance moved strongly downward into an oversold area, and a large amount of Tether entered the market.
🔔 Bitcoin alarm zones are still the same as before. Breaking these levels can give us positions. Since Bitcoin hasn’t built a complete structure yet and the market is in holidays, we won’t take trades.
❤️ Disclaimer : This analysis is purely based on my personal opinion and I only trade if the stated triggers are activated .

FOMC and Market Reactions – Simple Logic Explained💎MJTrading:
The Federal Open Market Committee (FOMC) guides U.S. interest rates. Their decisions ripple through all major markets, not just the dollar.
🔑 How It Works (Simple View):
- When the Fed signals higher rates, the USD demand rises (investors seek higher returns), while gold, stocks, and crypto often fall because money becomes “more expensive.”
- When the Fed signals lower rates or slows tightening, the USD loses demand, and money flows into assets like gold, stocks, and crypto.
🔍 Why a Rate Cut Weakens the Dollar:
* Cutting rates means borrowing money becomes cheaper.
* Investors earn less return by holding USD in banks or bonds.
* This lowers demand for the dollar, making it cheaper in global markets.
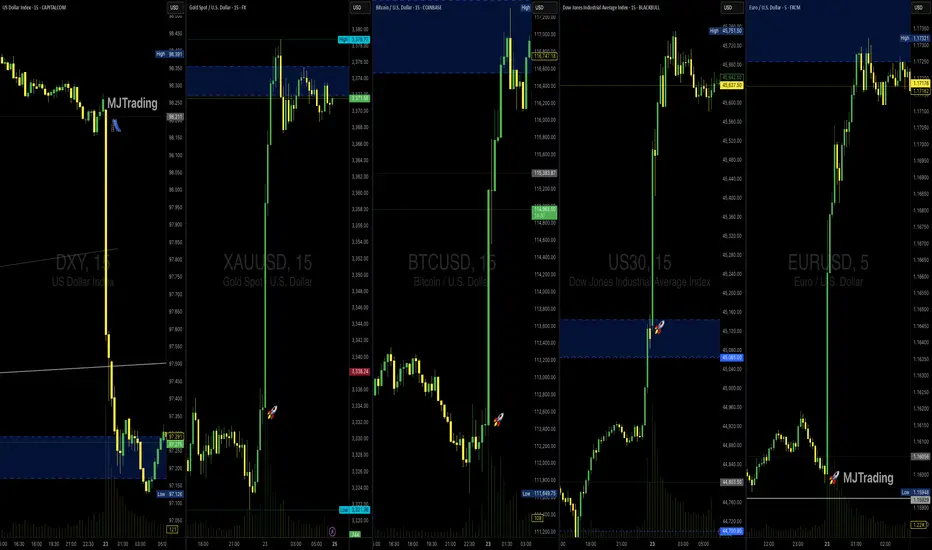
📊 What the Current Charts Show:
CAPITALCOM:DXY (Dollar Index): Sharp drop → less demand for USD.
FX:XAUUSD (Gold): Demand rises as an alternative store of value.
FX:EURUSD : Euro strengthens against weaker dollar.
BINANCE:BTCUSD : Risk appetite returns, lifting crypto.
BLACKBULL:US30 (Dow Jones): Stocks benefit as liquidity shifts from USD into equities.
⚡ The Core Reason – Demand & Supply
Weaker dollar = reduced demand for USD, so supply flows into gold, stocks, euro, and crypto.
🔮 Looking Ahead – Will the Rally Continue?
The rally may extend if the dollar remains under pressure and the Fed stays dovish.
But caution: after the first strong impulse, markets often retrace to test demand zones before continuing.
Next week’s momentum will depend on whether buyers can sustain demand beyond the initial FOMC reaction.
👉 Takeaway for Traders:
FOMC moves aren’t random. They’re driven by where capital finds the best return. Understanding this demand–supply flow helps explain why all charts move together in these moments.
#MJTrading
#FOMC #DXY #XAUUSD #EURUSD #BTCUSD #US30 #Forex #Gold #TradingEducation #Rally
Psychology Always Matters:
FOMC and Market Reactions – Simple Logic Explained💎 MJTrading:
The Federal Open Market Committee (FOMC) guides U.S. interest rates. Their decisions ripple through all major markets, not just the dollar.
🔑 How It Works (Simple View):
- When the Fed signals higher rates, the USD demand rises (investors seek higher returns), while gold, stocks, and crypto often fall because money becomes “more expensive.”
- When the Fed signals lower rates or slows tightening, the USD loses demand, and money flows into assets like gold, stocks, and crypto.
🔍 Why a Rate Cut Weakens the Dollar:
* Cutting rates means borrowing money becomes cheaper.
* Investors earn less return by holding USD in banks or bonds.
* This lowers demand for the dollar, making it cheaper in global markets.
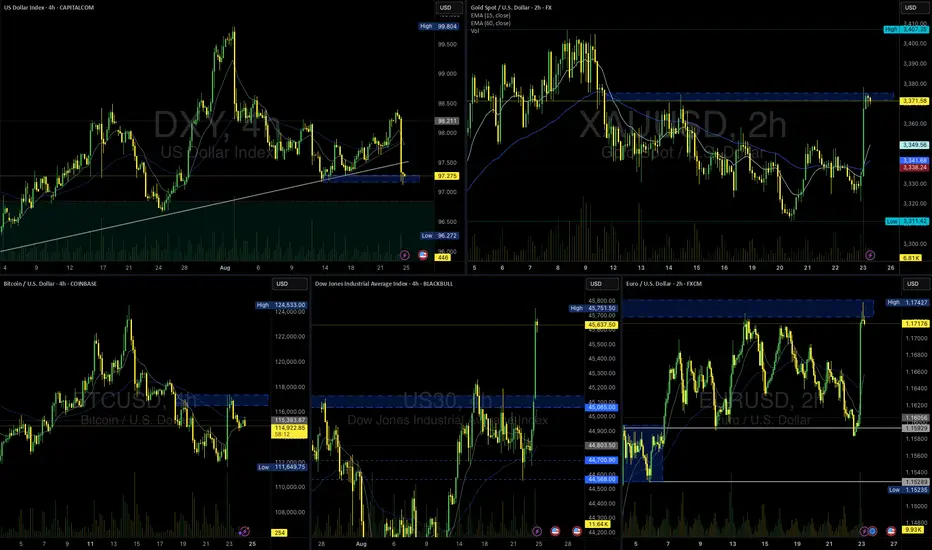
📊 What the Current Charts Show:
DXY (Dollar Index): Sharp drop → less demand for USD.
XAUUSD (Gold): Demand rises as an alternative store of value.
EURUSD: Euro strengthens against weaker dollar.
BTCUSD: Risk appetite returns, lifting crypto.
US30 (Dow Jones): Stocks benefit as liquidity shifts from USD into equities.
⚡ The Core Reason – Demand & Supply
Weaker dollar = reduced demand for USD, so supply flows into gold, stocks, euro, and crypto.
🔮 Looking Ahead – Will the Rally Continue?
The rally may extend if the dollar remains under pressure and the Fed stays dovish.
But caution: after the first strong impulse, markets often retrace to test demand zones before continuing.
Next week’s momentum will depend on whether buyers can sustain demand beyond the initial FOMC reaction.
👉 Takeaway for Traders:
FOMC moves aren’t random. They’re driven by where capital finds the best return. Understanding this demand–supply flow helps explain why all charts move together in these moments.
#MJTrading
#FOMC #DXY #XAUUSD #EURUSD #BTCUSD #US30 #Forex #Gold #TradingEducation #Rally
Psychology Always Matters:
Click on the image to read the caption.
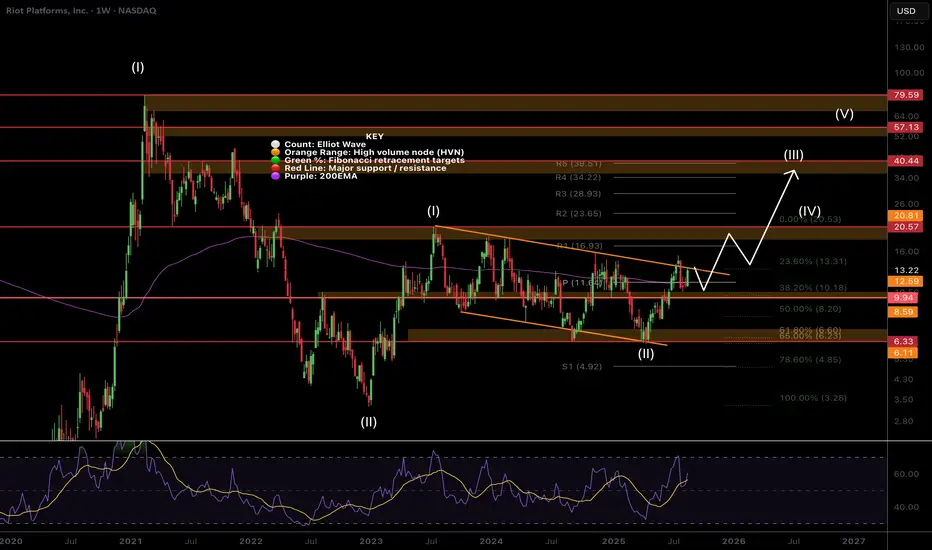
$RIOT Making Moves!NASDAQ:RIOT found support at the areas mentioned last week, the weekly pivot and 200EMA.
Wave (ii) ended at the golden pocket and High Volume node support.
Retesting the descending channel resistance upper boundary again will be the 5th test and a very high probability breakout. This would bring up the first target resistance of the wave (I) swing high and High Volume Node $20.5 followed by $40.
Weekly RSI did hit overbought but this can take months to pay play out and there is no divergence!
Analysis is invalidated below $6.33.
Safe trading
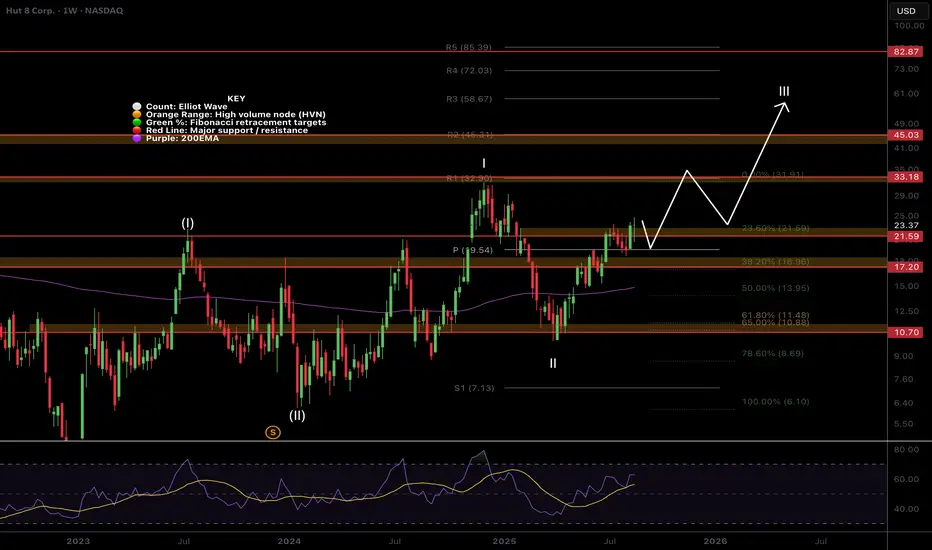
$HUT Clear for take off?NASDAQ:HUT bounced strongly off the weekly pivot retest above the major resistance High Volume Node flipped support.
Path is clear for the weekly R1 pivot target resistance at $33 and a poke above the previous swing high.
Long term cyclical targets remain at the R3 weekly pivot at $61. Weekly RSI is in an uptrend but not yet overbought while weekly RSI is pointing upwards.
Analysis is invalidated below $10.7
Safe trading
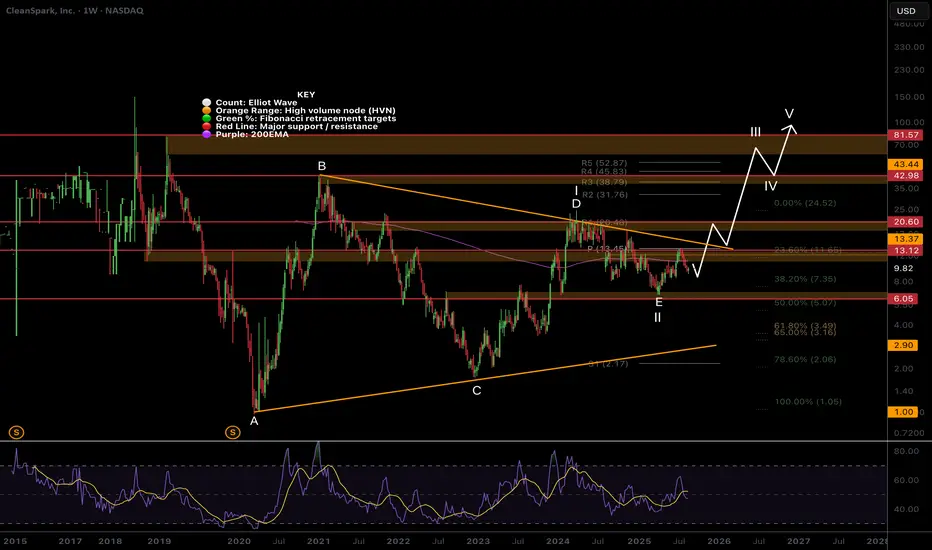
$CLSK Looks like XRP at $0.4 before the move to $3NASDAQ:CLSK is hated right now as much as XRP was when it ranged between $0.4-$0.8 for 4 years before it when ballistic.
CRYPTOCAP:XRP printed a huge macro triangle similar to what I have identified here for CLSK which looks complete at the triangle EQ, where wave E is expected to terminate! This finds confluence with the High Volume Node and 0.5 Fibonacci retracement.
Quadruple resistance lies ahead of the weekly 200EMA, major High Volume Node, weekly pivot point and descending resistance boundary, tested multiple times weakening the point. This built up pressure could provide an explosive move to price discovery.
I have left my alternative motif wave count on their as a secondary count (1-2) with similar targets.
RSI is at the channel EQ so plenty of upside left.
Analysis is invalidated below $6.05.
Safe trading
$BTDR Pressure Building?NASDAQ:BTDR still appears to be in a wave 2 triangle building pressure for a significant wave 3 up into price discovery.
Wave (II) found support a the golden pocket, shallower than the other miners! Price has tested the upper boundary of the triangle and High Volume Node multiple times at $15 and only once at the bottom threshold hinting at a breakout upwards. Each test makes the boundary weaker.
The weekly pivot point at $17 is the first area of resistance to watch followed by the all time high at $25
Analysis is invalidated below $6.44. RSI is only at the EQ so has room to grow.
Safe trading

Bitcoin above the $112k ┆ HolderStatBINANCE:BTCUSDT has tested the $111,978 support after forming a double top near recent highs. The level may produce a false break, and if buyers defend it, BTC could recover toward $122,500, continuing the overall bullish trend.

BITCOIN PREDICTION: PUMP TO $135K STARTING???! (Buy Now?) Yello Paradisers! In this video, I'm sharing with you the high time frame chart, the double shooting star candlestick pattern, double top formation, bearish divergence that needs to be confirmed, and its channel that we are trying to break to the downside. High time frame chart, I'm sharing with you the ABC zigzag and the potentiality of that C move being already finished. If not, the previous low needs to hold, and we are looking at things on a medium time frame. The bullish things on a medium time frame are the bullish divergence, and on a low time frame chart, the Elliott wave count that seems to be completed to the downside. If the previous low is going to hold, we are starting a new impulse towards $129,000 as a higher degree third wave. Then we will have a fourth wave, and the final fifth wave will take us towards $135,000. Watch the video where I'm explaining all the confirmations and the price action dynamics, and how we will be developing with the highest probability.
Paradisers! Keep in mind to trade only with a proper professional trading strategy. Wait for confirmations. Play with tactics. This is the only way you can be long-term profitable.
Remember, don’t trade without confirmations. Wait for them before creating a trade. Be disciplined, patient, and emotionally controlled. Only trade the highest probability setups with the greatest risk to reward ratio. This will ensure that you become a long-term profitable professional trader.
Don't be a gambler. Don't try to get rich quick. Make sure that your trading is professionally based on proper strategies and trade tactics.

Others: Now or Never- As always, the chart tells the full story (Trend, Fibonnacci and Elliot Waves).
Historically, OTHERS.D (altcoin dominance) has had big swings depending on market cycles:
- During altcoin seasons (e.g. 2017, 2021), it has surged strongly as capital rotated from BTC and ETH into mid-cap and small-cap coins.
- Macro Cycle : if Bitcoin finishes its post-halving run (2025–2026), then money often rotates into altcoins, pushing OTHERS.D higher.
- Historical levels: OTHERS.D peaked near 20% in 2021. So 27% is ambitious but not impossible if altcoin adoption accelerates.
Remember, I only provide technical analysis and assumptions, fundamentals can shift everything at any moment, whether through governments, wars, unforeseen events, or even something as wild as an asteroid or alien invasion.
Happy Tr4Ding !

