#BTC Update #10 – July 27, 2025#BTC Update #10 – July 27, 2025
Bitcoin continues to move between $116,400 and $118,900, and staying within this range is actually a positive sign, even in bearish scenarios. A decisive close below $114,000, however, could open the door for a deeper and more prolonged correction.
Although BTC hasn’t broken to new highs yet, its ability to hold here means the trend isn’t broken. A strong breakout above $118,900 could lead to a rally toward $123,300 and possibly even $128,000.
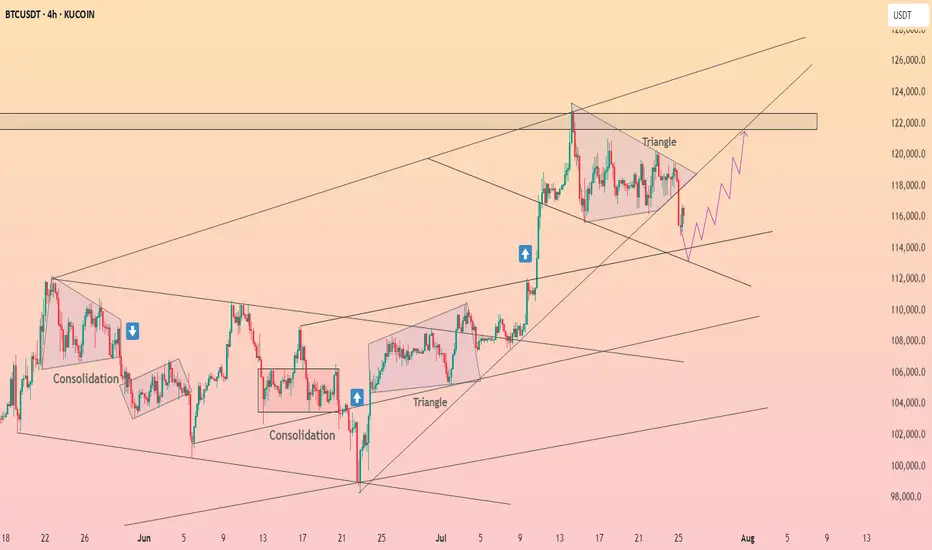
🔹 On the 4H chart, BTC seems to have completed its minor correction.
🔹 On the daily chart, the correction remains incomplete – despite dipping to $114,700, the key $112,900 zone hasn’t been tested.
In lower timeframes, BTC remains squeezed within a symmetrical triangle. While it occasionally pokes out, it quickly returns inside — showing indecision.
📌 Direction is unclear at the moment. There’s no strong signal for Long or Short. Waiting for confirmation with volume and a clear breakout is the safer play.
Btc-bitcoin

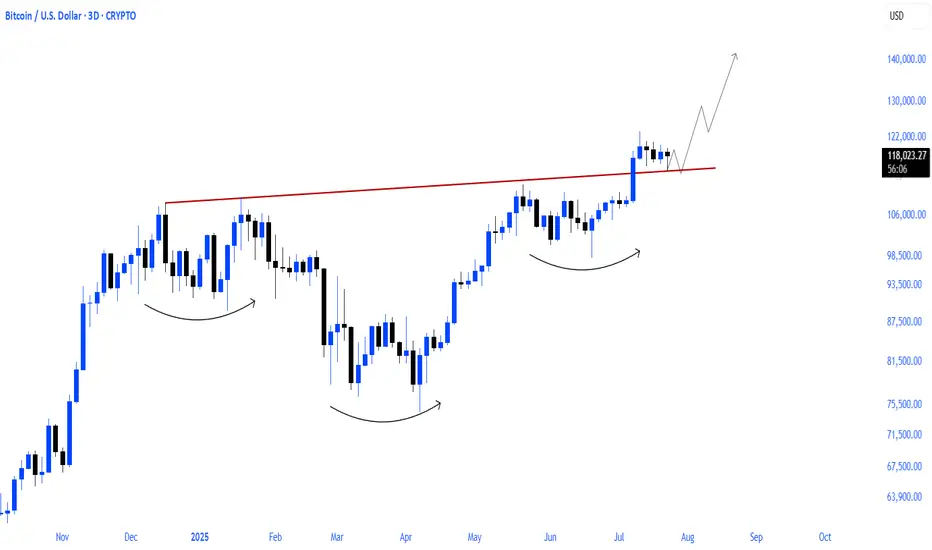
$BTC NEXT WAVE PROGRAMMED!bitcoin will load the next wave after the accumulation process it is in after the parabolic run
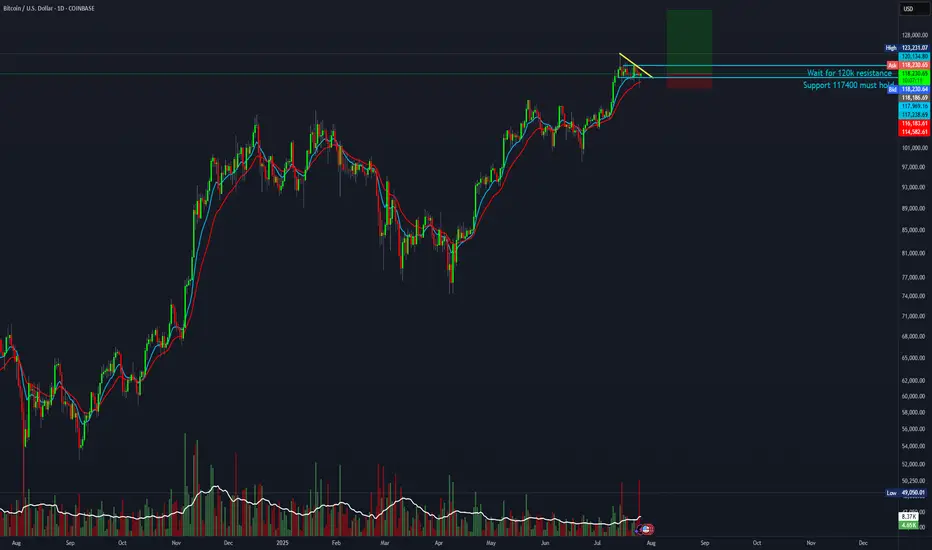
4:1 R:R for BTCBulls are likely to send it higher before the 120K breakout. This early setup is worth a try.
Entry: 118,200
Stop-loss: 115,000
Target: 135,000
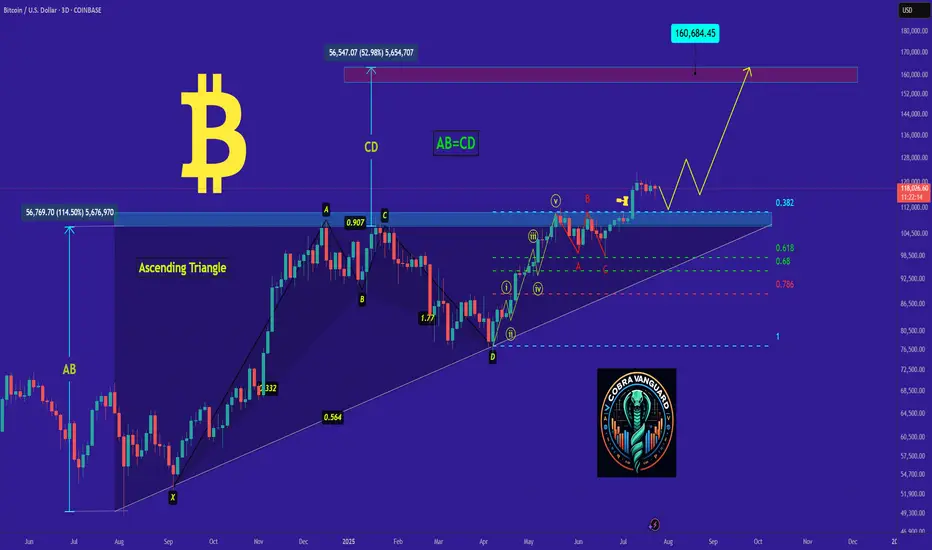
BITCOIN's Situation (12h) !!!So if you pay attention to the TON chart you can see that the price has formed a Ascending wedge which means it is expected to price move as equal as the measured price movement.( AB=CD )
NOTE: wait for break of the WEDGE .
Best regards CobraVanguard.💚

bitcoin- Time to buy again! (Update)As I said, Bitcoin broke the triangle, and now with a slight price correction, it could surge to $160,000, and you still think I'm joking!!
Previous analysis
BTC – Bulls still in controlBTC is trading around 117,800 USD, well above both the EMA 50 (111,800) and the pivot level (105,300), confirming bullish dominance. Price remains below the upper Bollinger Band (123,400), leaving potential room for continuation.
Momentum stays constructive, with RSI at 60 and MACD in a strong positive zone, reflecting sustained upward pressure. As long as price holds above EMA 50 and pivot, the next upside targets lie at 123,400 and R1 at 110,000 has already been surpassed.
Volume has dropped significantly (-31%), suggesting the latest move could lack conviction or represent a pause rather than a breakout.
As long as BTC holds above 111,800, the bullish scenario remains intact.
Watch for any rejection near 123,400 or a close back below the EMA as potential invalidation signals.

ETHBTC x ETH.DETHBTC x ETH.D
Ethereum bitcoin pair and ethereum dominance will gain upward momentum with the reaction it receives from the major support line in 2019
The better Ethereum is, the better Altcoins will be.

BTC - Trap, Tap, and Blast Off!BTC has been overall bullish, trading within the rising blue channel (1). After reaching a local high, it entered a short-term correction, forming a falling red channel (2).
👀All eyes are now on the key demand zone (3), which aligns with the lower bound of both the red channel and the rising blue structure.
🔎As long as this confluence holds, we anticipate a potential bullish impulse in August.
A retest of the $111,500–$112,000 zone could serve as the trigger for the next leg toward $128,000. Let’s see if BTC is gearing up for another breakout or if a deeper correction is in play.
🔔 Disclaimer: This analysis is for educational and informational purposes only. It does not constitute financial advice or a recommendation to buy or sell any asset. Always do your own research and manage your risk accordingly.
📚 Always follow your trading plan => including entry, risk management, and trade execution.
Good luck!
All strategies are good, if managed properly.
~ Richard Nasr

BTC setup looks good for 5R.Looks like BTC is about to make another leg up toward 135K. Playing a 5:1 R:R on this setup
Entry: 119,000
Stop Loss: 116,000
Target: 135,000

Trade with crux Atlantic... 🔔🔔Trading the financial market is easy when you've the right tools and strategy.💯💯
🔔🔔Let the chart pay your bills.💰💰

Bitcoin is correcting ┆ HolderStatBINANCE:BTCUSDT compresses inside a triangle between $132K and $137K. Breakout above $137K could initiate a run toward $143K. Breakdown exposes $132K. Watch for decisive move.
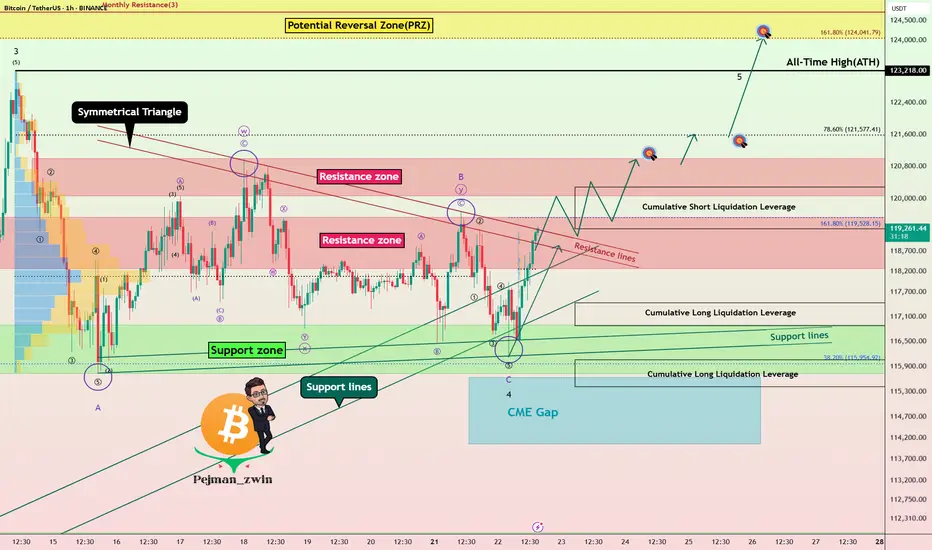
Powell’s Comments Could Decide BTC’s Fate: New ATH or Rejection!Bitcoin ( BINANCE:BTCUSDT ) has attacked the Support zone($116,900-$115,730) several times over the past week but failed to break through, meaning that buyers are still hoping for a BTC increase or even a new All-Time High(ATH) .
Bitcoin has reached a Resistance zone($119,530-$118,270) again and is trying to break the upper lines of the Symmetrical Triangle Pattern . The Cumulative Short Liquidation Leverage($117,255-$116,675) is important and includes high sell orders , so if Bitcoin can break the Resistance zone($119,530-$118,270) and the Resistance lines with high momentum , we can hope for a continuation of the upward trend.
Whether or not the Resistance zone($119,530-$118,270) and the Resistance lines break could depend on the tone of Jerome Powell’s speech today .
Jerome Powell will speak at the opening of the “ Integrated Review of the Capital Framework for Large Banks ” — the final major appearance before the Federal Reserve enters its pre-meeting blackout period.
Market Expectations:
The speech is officially about regulatory frameworks (like Basel III), but traders are watching closely for any hints regarding interest rate policy. Even indirect comments could move risk assets like BTC.
Rate Cut Signals?
With political pressure mounting (including criticism from Trump ) and markets pricing in a potential cut later this year, Powell may adopt a cautious, data-dependent tone emphasizing flexibility in decision-making.
--------------------
In terms of Elliott Wave theory , it seems that the wave structure of the main wave 4 correction is over. The main wave 4 has a Zigzag Correction(ABC/5-3-5) , so that the microwave B of the main wave 4 has a Double Three Correction(WXY) . Of course, the breakdown of the Resistance zone($119,530-$118,270) and Resistance lines can confirm the end of the main wave 4 .
Also, there is a possibility that the 5th wave will be a truncated wave because the momentum of the main wave 3 is high , and Bitcoin may NOT create a new ATH and the main wave 5 will complete below the main wave 3.
I expect Bitcoin to rise to at least the Resistance zone($121,000-$120,070) AFTER breaking the Resistance zone($119,530-$118,270) and Resistance lines .
Second Target: $121,620
Third Target: $123,820
Note: Stop Loss(SL)= $117,450
CME Gap: $115,060-$114,947
Cumulative Long Liquidation Leverage: $117,429-$116,878
Cumulative Long Liquidation Leverage: $116,053-$115,411
Please respect each other's ideas and express them politely if you agree or disagree.
Bitcoin Analyze (BTCUSDT), 1-hour time frame.
Be sure to follow the updated ideas.
Do not forget to put a Stop loss for your positions (For every position you want to open).
Please follow your strategy and updates; this is just my Idea, and I will gladly see your ideas in this post.
Please do not forget the ✅' like '✅ button 🙏😊 & Share it with your friends; thanks, and Trade safe.
That's where the $BTC 2017 vibes are felt!As we mentioned before, the current cycle that Bitcoin is in is exact

Global Liquidity Index vs BitcoinGlobal liquidity index at ATH!
CRYPTOCAP:BTC will continue to follow hard!

Bitcoin’s Epic Run from 80K to 120K: What’s Next for BTC?Yo traders, it’s Skeptic from Skeptic Lab! 🩵 Diving into Bitcoin’s wild ride from 80K to 120K—breaking down the key supports, resistances, and what’s next for BTC.
From the $76k bounce to smashing $110K, we’re eyeing the $120K PRZ. Will it correct or keep soaring? Check the video for the full scoop! Drop your thoughts or coin requests in the comments, boost if it vibes & Let’s grow together!

BITCOIN IS CREATING A SECRET PATTERN! (Huge move incoming?!)Yello paradisers! I'm describing to you what's going on with Bitcoin right now. We are creating a secret pattern that is forming, and once its neckline is reclaimed, we are going to have a huge movement.
In this video, I'm sharing with you the most important support and resistances on multiple time frames. We are describing Elliott wave theory wave count, and taking a look at candlestick patterns. We are talking about confirmations necessary for bullish and bearish cases. I'm explaining to you what the professional trading signals need for long-term profitability.
Some of the points are great risk-reward ratios. I'm talking about that in the video. One of them is taking only the highest probability trade setups, and having the patience and discipline to wait for them.
I'm talking about proper strategy which is needed, and systemology in your overall trading and how important it is. Here on TradingView, I'm describing to you the overall bias I have on Bitcoin right now.
Don't be a gambler. Don't try to get rich quick. Make sure that your trading is professionally based on proper strategies and trade tactics.

Bitcoin is testing the triangle ┆ HolderStatBINANCE:BTCUSDT is ranging $132K–$137K in a triangle pattern. Breakout above $137K may target $143K. Decision point near.

Sell Signal on Bitcoin (1-week timeframe)The IQTrend indicator shows a Sell signal on the weekly timeframe for BINANCE:BTCUSDT .
I also noted the percentage of movement after previous signals so that you understand the seriousness of the situation.
Of course, this time it may be a little different, but I think it's worth keeping this signal in mind anyway.
DYOR

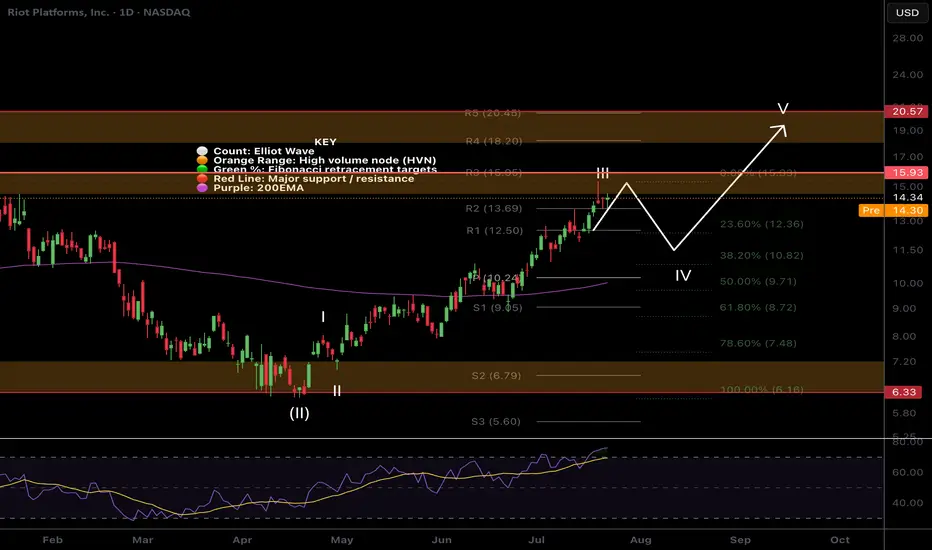
$RIOT Targets hitNASDAQ:RIOT has hit my take profit target at the High Volume Node and R3 daily pivot where it has found resistance.
Wave III appears to be complete with wave IV expected targets being the 0.382-0.5 Fibonacci retracement, also the daily pivot point and ascending daily 200EMA, $10.24.
Analysis is invalidated if we continue to the upside with a new swing high. RSI is overbought no bearish divergence.
Safe trading
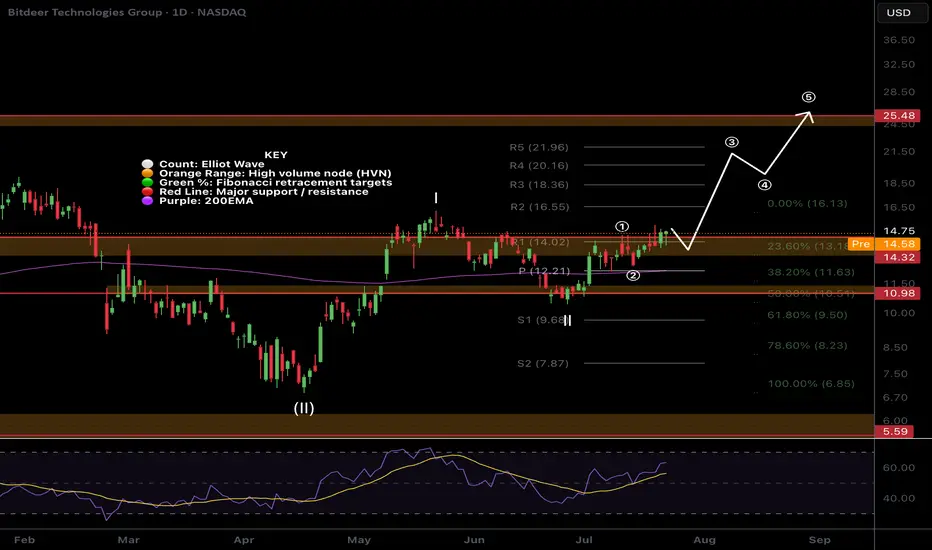
$BTDR Closed above resistance!NASDAQ:BTDR Bitdeer closed above major resistance yesterday, despite BTC and alt coins having a bearish day, triggering our long signal in the Weekly Trade signals substack.
I am looking for price to start to accelerate in wave 3 and resistance now support to hold. If BTC reverses it will add additional tailwinds with a target of the major resistance above the R5 daily pivot $24
Safe trading
HolderStat┆BTCUSD consolidatedBINANCE:BTCUSDT is consolidating between $129K and $137K. Breakout above $137K could lead to new highs. Key support remains at $125K.


BITCOIN FINAL WARNING BEFORE HUGE MOVE!!! (urgent) Yello Paradisers! I am Sharing with you my idea about #Bitcoin of what's going on with Bitcoin right now: be very careful because the Fear and Greed Index, a special one, is at "Greed". We are seeing funding rates, the accumulated funding rates, as extremely positive. We are seeing bearish patterns forming.
In this video, I'm describing the confirmations we are waiting for that will confirm that Bitcoin is about to make a huge movement. Make sure that you are trading with professional trading strategies and that you are waiting for confirmations before any trade execution. Also, make sure that you have tight risk management because only the best, most professional traders will win long-term in this game.
Don't be a gambler. Don't try to get rich quick. Make sure that your trading is professionally based on proper strategies and trade tactics.
