Target 92KBTC has breached major areas of support and key VALs which were last line of hope around 108K.
This fractal likely to play out rest of Q4!
Target 92K
BTC-D

Bitcoin-Gold Ratio Versus Monetary Policy
Chart shows:
—Bitcoin/Gold
—20-Week SMA
—SMA Slope Z-Scores*
—Fed Funds
—QE & QT
Bitcoin/Gold broke support of its 20W SMA for the 6th time in Bitcoin's history while the SMA slope normalizer* value reached zero (the long SMA rolled over), the Fed enters a rate-cutting cycle, and QT is ending.
These could represent increased bearish probabilities for the Btc/Gold ratio on medium and long timeframes.
*Slope Normalizer: The differentiated (positive and negative values are separated before subsequent calculations are made with the data) normalized z-scores (z-scores below 1 are muted while z-scores above 1 are not muted, in order to emphasize unusual values.)
When used with the SMA as an input, this essentially shows the normalized values of the rates of change of the SMA (on this chart, it is showing the normalized slope of the long-term simple moving average.)

BTC Loses Structure — Risk of Falling Below $106KBitcoin has officially lost the low-time-frame structure, confirming the end of the previous uptrend zone.
Momentum has shifted to the downside, with sellers gaining control and price now approaching a critical breakdown level.
📉 Current outlook:
BTC remains under $112K, signaling continuation of short-term weakness.
The end uptrend zone around $109K failed to hold support.
Market structure shows potential continuation below $106K if no reversal occurs soon.
📊 Observation:
Buyers have not defended the local range, and repeated rejections near $116K confirm exhaustion of bullish strength.
The next liquidity pool sits below $106K, which could act as the next target zone in this downtrend sequence.
💬 Summary:
BTC has broken its short-term structure — the chart shows clear downside risk with potential move below $106K if pressure continues.

BTC-Moment of TruthBTC-Moment of Truth ⚖️
Zoom out to the #Bitcoin Weekly —
Three distinct ranges, three tops.
Each time BTC broke above one…
it eventually came back to retest that range top as support —
right under the Bull Market Support Band (BMSB).
This latest dip?
No different. BTC has returned to retest the prior range top once again.
If the Satoshi Halving Prophecy is to be fulfilled —
and new ATHs are to emerge this year —
then this weekly + monthly close must reclaim the BMSB with strength.
👉 A close above $114K (ideally above $115.7k-last week’s high)
= Higher High + Bottoming Tail = Momentum Reversal.
Fail here, and the range expands lower.
Reclaim it… and the prophecy breathes.
Stay Sharp... We are at the Moment of Truth!

BITCOIN Has this huge Bearish Divergence started the Bear Cycle?Bitcoin (BTCUSD) continues to be under heavy pressure in the past 4 weeks since the October 06 All Time High (ATH) and finds itself battling to hold the 1W MA50 (blue trend-line) as Support. That trend-line has been basically the Support of this Bull Cycle since March 2023, and acted as the most optimal long-term buy level.
** Has the Bull Cycle ended? **
However this Bull Cycle may have very well come to an end already as the 1W RSI has been long exhibiting the same kind of bearish pattern (Lower Highs trend-line), while also having completed the 4-year Cycle, that all previous Bull Cycles formed on their respective tops. This is a huge Bearish Divergence formation as it goes against the price's Higher Highs, indicating trend exhaustion.
As you can see that 1 RSI Lower Highs trend-line formed the November 2021, December 2017 and December 2013 Cycle Tops. Even worse, the current Lower Highs trend-line has been going on since the March 11 2024 High. If BTC closes a 1W candle below its 1W MA50, it has greater probabilities to confirm the start of the new Bear Cycle as all previous ones did on such break-out.
** If yes, how much can it drop? **
Now, it might not be too relevant at this time yet, but as far as how low the Bear Cycle can go to before it bottoms, there are three potential levels of interest where long-term investors can Dollar Cost Average (DCA).
The January 2015 Bear Cycle bottom was formed on the 1W MA200 (orange trend-line). Then the December 2018 Bear Cycle bottom was formed on the 1W MA200 and the 0.382 Fibonacci retracement level from the previous bottom. The last Bear Cycle has its bottom below the 1W MA200 and on the next Fib in line, the 0.5 level. The decline on each Bear Cycle that followed decelerated and was less than the previous (-86.70% to -84.19% to -77.22%).
If the new Bear Cycle has already started then the first level for a potential bottom is again the 0.382 Fib around $58000 where contact may potentially be made with the 1W MA200 as well. If it follows the previous Bear Cycle and bottoms on the 0.5 Fib, it will also be below the 1W MA200 around $45000. If on the other hand it goes a Fib level further, as the last two Cycles did, we are looking at the 0.618 Fib as a potential strong bottom candidate around $35000. That will also be a -70.76% decline from the Top, which will be -7% less than the previous Bear Cycle, which is also the difference that the 2022 Bear Cycle had from the 2018 one.
So what do you think? Has the Bull Cycle ended already and if yes, how low can the new Bear Cycle go? Feel free to let us know in the comments section below!
-------------------------------------------------------------------------------
** Please LIKE 👍, FOLLOW ✅, SHARE 🙌 and COMMENT ✍ if you enjoy this idea! Also share your ideas and charts in the comments section below! This is best way to keep it relevant, support us, keep the content here free and allow the idea to reach as many people as possible. **
-------------------------------------------------------------------------------
💸💸💸💸💸💸
👇 👇 👇 👇 👇 👇

Bitcoin holds above key support while the monthly trend stays inFear comes from chop, not collapse. That matters now because price is sitting on support while the longer chart still points up, which is where the bigger money is made.
My objective is simple. Decide if this drop is a pause inside the monthly uptrend, and map the highest probability path for the next week, the next few weeks, and the next quarter.
The monthly picture is my anchor. On 1M, ADX 14 is 41.95 which signals a strong trend. Price sits well above the 1M EMA 9 at 101766.79 and the 1M SMA 10 at 100687.53, which means pullbacks have room before any structural damage. The 1M MACD line is above the signal with a positive histogram at 2118.32, a sign of trend persistence, even if momentum cooled a bit. The 1M stochastic is overbought at 86.19, which often brings consolidation, not immediate reversal. Translation. Primary uptrend intact, likely sideways to up over the next quarter.
The weekly chart shows the consolidation. On 1W, price is below the 1W EMA 9 at 114030.37 and below the 1W SMA 10 at 113718.48. RSI 14 is 54.5, so momentum is neutral but not weak. The 1W MACD histogram is negative at minus 1113.44, yet it improved from last week, which fits a basing phase. Weekly ATR 14 is about 9297, so swings of nine to ten thousand fit the tape. Conclusion. A test of support is still likely before trend continuation.
Daily tells us where that test happens. On 1D, price hovers near the pivot at 110955.01, with resistance at 112710.01 and support at 108266.28 then 106511.28. The 1D SMA 200 sits at 109213.25, a level buyers care about. RSI 14 is 44.74, which is below neutral and consistent with a pullback. The 1D MACD histogram is positive at 345.64 after a series of higher bars, which often precedes a bounce. Daily ATR 14 is about 3789, so two to three day swings around four thousand are normal.
Intraday texture supports a near term bounce attempt. On 4H, RSI 14 is 43.58 and the stochastic %K turned up to 42.17 from deeply oversold. MACD histogram is still negative at minus 487.12, which is why any bounce should first aim for resistance rather than blue sky. The 4H pivot sits near 110294.59 and VWAP 50 on 4H at 111433.88 is the next tactical magnet.
Key levels I care about. Daily resistance 112710.01. Daily pivot 110955.01. Daily SMA 200 109213.25. Supports 108266.28, 106511.28, 103822.55. If buyers keep price above 109213.25, the path of least resistance is a grind back to 112710.01. Lose 108266.28, and the market likely tags 106511.28 where prior demand sits.
Here are the targets, chosen by timeframe and probability, with moves sized by ATR.
Short term, next 5 to 10 days. I expect a bounce toward 112700 which aligns with daily R1 at 112710.01. Probability about 60 percent, since 4H momentum is turning up and the 1D MACD histogram is rising, while the 1D SMA 200 at 109213.25 offers nearby support.
Medium term, within 4 to 8 weeks. I expect a retest of 106500 which aligns with daily S2 at 106511.28 and fits a weekly consolidation. Probability about 55 percent, because the 1W trend is neutral, price is below weekly moving averages, and weekly ATR allows a drop of this size without breaking the 1M uptrend.
Long term, by Q1 2026. I expect a push toward 123800, near the 1M upper band at 123481.59 and below the swing high at 126199.63. Probability about 65 percent, since 1M ADX is strong, moving averages are rising, and the monthly trend has not been violated.
Bottom line. This is a pullback inside a larger uptrend. Respect 109213.25 on the daily, trade the bounce to 112700, be ready for a weekly dip toward 106500, and keep sights on 123800 into the first quarter.

BTCUSDT Breakdown Ahead: Sellers Eye $108K SupportHello everyone, here is my breakdown of the current Bitcoin setup.
Market Analysis
BTCUSDT has been consolidating within a well-defined range, facing multiple rejections from the $121,700 Resistance Zone. After several failed breakout attempts above this area, the market shifted into a bearish phase, confirming sellers’ dominance. The structure now forms a descending triangle pattern, a classic bearish continuation signal. We can see multiple breakouts and retests throughout the move, with price respecting both the Triangle Resistance Line and Support Line. The most recent rejection from the upper boundary of the triangle shows that buyers are losing momentum, while sellers are gradually regaining control.
Currently, BTCUSDT is approaching the Triangle Support Zone around $110,000–$108,800, a crucial level where previous reactions occurred. A clean break below this support area could accelerate the downside move, confirming a continuation toward the lower Support Zone near $105,000–$103,000.
My Scenario & Strategy
In my view, BTC remains in a vulnerable technical position. If the price closes below the $108,800 level, this would likely trigger a fresh bearish impulse, leading to deeper declines. Until a confirmed breakout happens, short-term traders may look for retest entries after breakdowns for better risk-to-reward setups.
However, if BTC finds strong support and rebounds from this level, we could see a short-term correction toward $114,000–$116,000, which would act as a retest of the Triangle Resistance Line before further decline. For now, my bias remains bearish, expecting continuation to the downside as long as price stays below the $114,000–$116,000 resistance zone.
That's the setup I'm tracking. Thank you for your attention, and always manage your risk.

BTC HAS TO START UPSIDE ACTION ... OR IT DOESN'T START IT AT ALLMorning folks,
So, we've got a H&S that we suggested. Great. Besides, price is already at the right arm's bottom - its time to make a decision, whether you're in or not. Also we could use this small 30-min H&S to minimize the risk.
The logic is simple. Upside action has to start right from here, or it will not happen at all and BTC will fall back to 100K lows.
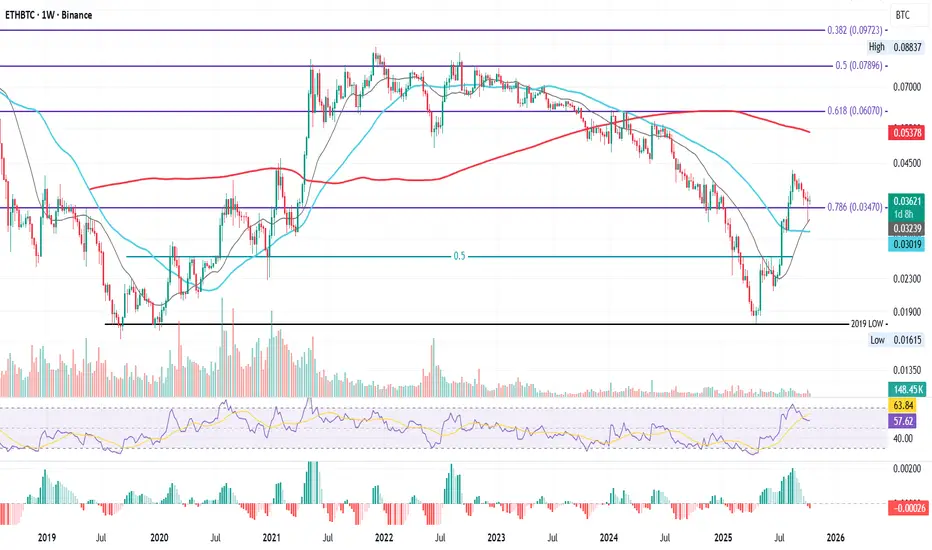
ETHBTC Weekly Series – Tracking the Shift, Week by WeekETHBTC Weekly – Confluence at the 0.786 Fib
This is ETHBTC on the weekly, now retesting one of the most important Fibonacci levels on the chart: the 0.786 Fib at 0.03470.
This time, price isn’t testing it alone. Just below, we have the 21-week MA and 50-week MA, both providing strong confluence. Last week’s flash crash on October 10th already tagged the 21-week MA, showing how reactive this area is for buyers.
This zone could serve as a structural base for a potential bounce toward higher resistance: such as the 200-week MA, or Fibonacci levels around 0.06–0.07. But for any of that to happen, price must hold here first.
That’s why, starting this week, I’ll be tracking this pair closely and updating this idea regularly, to better understand whether ETH can regain strength against BTC, and what that means for the altcoin market as a whole.
Because as history has shown:
when ETHBTC climbs, altcoins breathe again.
Right now, most alts look bruised after the flash crash, but some, especially those with real-world use cases, still hold long-term promise.
The key is timing.
And timing starts with ETHBTC holding this level.
Bias:
Neutral–bullish, strong confluence support, but confirmation needed through weekly close above 0.0347.
Always take profits and manage risk.
Interaction is welcome.
Bitcoin Approaches Key Resistance — Bulls Eye 117K BreakoutHello traders, I want to share my view on Bitcoin (BTCUSD). The current market structure shows a gradual recovery phase following the previous breakdown from a large range near the 118,000 level. After a sharp decline and retest of the 106,400 support zone, the market found strong buying interest, forming a new ascending channel structure. This setup has been characterized by steady higher highs and higher lows, confirming the presence of short-term bullish momentum. At this stage, BTCUSD is approaching a key resistance level around 116,000, which aligns with both the upper boundary of the current channel and the prior horizontal resistance zone — a region that previously acted as a strong supply area. This confluence suggests that the market could face a short-term pause or pullback before attempting another bullish impulse. My primary scenario anticipates that if the price holds above the support line near 113,000–113,500, buyers may maintain control and push toward the 117,000 target (TP1) — the next logical resistance level and the top of the channel. However, a clear rejection from 116,000 without follow-through could open the door to a corrective pullback toward 110,500–111,000 for another demand test. In my opinion, the structure remains bullish in the short term, as long as the lower boundary of the ascending channel holds. Therefore, I continue to favor a long scenario with a TP at 117,000, expecting a potential breakout or test of the upper resistance. Please share this idea with your friends and click Boost 🚀

BTC - Bouncing From the Sweet Spot?⚔️Bitcoin is currently sitting at a high-confluence zone , where the daily support perfectly aligns with the lower bound of the ascending wedge. This intersection makes it a prime area to look for potential bullish reactions.
🏹As long as this support holds, I’ll be looking for long opportunities, expecting BTC to push higher within the wedge structure.
The first target for this bullish move lies around the upper bound of the wedge, which conveniently lines up with the supply zone near $122,000, a key resistance to watch.
📉If the support fails, the structure could shift, but for now, bulls still have the technical edge.
⚠️ Disclaimer: This is not financial advice. Always do your own research and manage risk properly.
📊All Strategies Are Good; If Managed Properly!
~Richard Nasr

BCHUSDT → Consolidation ahead of news. Target 600?BINANCE:BCHUSDT.P is consolidating above key resistance. Consolidation is forming ahead of news. Are the bulls in play?
Bitcoin is consolidating, trading above key support at 111650. News ahead, a positive outcome could support the market, including altcoins...
As for BCHUSDT, the coin is breaking through the strong resistance zone of 549.15 as part of a bullish trend and is forming consolidation in the range of 549-570. A liquidity pool has formed below 549. There is a high probability of a long squeeze before growth.
Resistance levels: 570, 600, 612
Support levels: 549.15, 533, 511.25
The market is bullish, which is clearly visible on the D1 timeframe. After a strong rally, the coin is entering a consolidation phase, which is forming above the previously broken resistance. A retest of support could trigger growth in the direction of the trend.
Best regards, R. Linda!

$BTC UPDATE: As mentioned in our Sunday update,CRYPTOCAP:BTC UPDATE:
As mentioned in our Sunday update, we said if Bitcoin holds above $110K, a move toward $115K–$117K is possible, and that target has been hit perfectly. Now the market is turning bearish again. We are still in a bearish structure, and a move below $100K remains our main target.
There’s support around $107K–$108K; if Bitcoin holds this area, some sideways movement is possible, but overall, our structure remains bearish.
FLM , GETTEX:KDA , $PERP #BTC , #더블유 , #kite , #enso , #Trump , #FOMC , #COAI

BTCUSDT.P - October 30, 2025BTCUSDT.P - In-depth analysis | 1D Timeframe
Trend Structure:
The market is currently consolidating after a notable uptrend that peaked near the $127,000 zone. Recent weekly candles display lower highs and moderate-bodied structures, suggesting a weakening bullish impulse. The current range is bounded by resistance at $126,200–$132,900 and support at $101,500, with a deeper structural support near $74,450.
Trend Strength:
Trend momentum is weak, indicated by a low strength reading. The loss of directional follow-through implies the market is entering a mid-cycle cooling phase or secondary correction within a broader bullish structure.
Volatility Conditions:
Volatility remains moderate, reflecting an equilibrium between buyers and sellers. This volatility profile typically precedes a breakout move after extended consolidation.
Squeeze:
Current market condition suggests energy buildup and potential for a decisive breakout in the coming weeks.
Bias:
Given the weakening trend and active squeeze near mid-range support, the near-term bias is SHORT, targeting potential tests of the $101,500 level before any renewed bullish continuation can be confirmed above $126,000.

BTC Daily: Sellers react from 115,963The market is in a sideways range with an active seller initiative targeting 103,528.
Hey traders and investors!
This analysis is based on the Initiative Analysis (IA) method.
On the daily timeframe, the market is in a sideways range with an active seller initiative targeting 103,528.
After the rise to 115,963, we see a seller reaction accompanied by increased volume.
Look for buy setups only when the buyer shows strength — so far, that hasn’t happened.
Wishing you profitable trades!

BTCUSDT 4-Hour Chart Analysis !!BTCUSDT 4-Hour Chart Analysis
Support and Trend: BTC has bounced off the ascending trendline and is currently holding above the $110,000-$111,000 support area (represented by the gray band). The price is respecting both diagonal trendline support and horizontal support, which is a positive sign for bullish momentum.
Key Levels: Immediate resistance is at $112,000-$113,000. A clear break above this area could create room for further growth towards the next major resistance at $123,250-$124,000 (marked at the top).
Outlook: As indicated by the green arrow, the chart suggests a bullish scenario if this area holds, with the potential for upward acceleration towards the $123,000 area.
DYOR | NFA

Bitcoin is crazy volatile as rates get cutBTC reacted by selling off while the news of a 25bps interest rate cut was being released. Despite the bullish news, the market still sold; however price is still respecting the range and did not produce a lower low. These moments are designed it inflict pain and flush holders out of the market. Have strong risk management and don't risk what you are not willing to lose.

BTC/USDT | BTC Update – Testing the $112K Barrier!By analyzing the #Bitcoin chart on the 12-hour timeframe, we can see that after finding strong support near $103,500 , BTC has continued its recovery and recently reached $111,700 . The key question now is whether the price can break decisively above the $112K resistance zone.
The $103K–$105K range still acts as a major demand area , while the $109K–$112K zone remains short-term resistance . A confirmed breakout above $112K could open the door toward $113,800, $116,000, and $119,600 , while rejection from this zone might trigger another pullback before continuation.
Overall, the structure remains neutral-to-bullish , and volatility is still high — you guys should stay alert for a confirmed breakout before the next big move develops.
Please support me with your likes and comments to motivate me to share more analysis with you and share your opinion about the possible trend of this chart with me !
Best Regards , Arman Shaban

Before DOW 50K Happens (DJI long call for holders)Remember the future. Beware of the past. This time it's different. That's all.
I recommend studying Richard Wyckoff Stock Trading Technique, but not Tape Reading because that information is past its prime, in my opinion ;)
There's nothing left but upward ascent for humanity in my view. This is to do with spiritual reasons that many of us traders are privy to in our inner circles.
This chart is directed guidance towards the g20 group and the G7 group of Countries we call Home on Earth protectors.
We use capitalization as necessary to achieve the desired effect, affect, or required attribute enrichment in order to AVOID City 17, and not have to go back to the old ways of fearing totalitarian rule.
I posit that Donald Trump, The President of the United States of America, will eventually reply to my Christmas letter from 1993 and finish Home Alone 3, but I degress.
Some of us write letters. This is one such letter to the public; I used to write letters to Bill Gates on an IBM PS2, if you know your stuff.
This is my final chart, at least for a while. I always say something like that when I post a grand prediction like this one.
I bid you all well, and hope you find fruitfulness in your future life endeavors.
BLUEDOG OUT

Bitcoin strong, Dominance weak.Bitcoin maintained its strength above the major uptrend and support zone, while BTC Dominance broke below the major uptrend and also received confirmation of a retest of the major resistance and major uptrend for the downside.
For altcoins, this is a trend towards the beginning of a new momentum.

Fed Rate Cut Looms: BTC Dip to 95K-100K = Prime Entry Before MooCRYPTOCAP:BTC / #Bitcoin 🪙
Fed Rate Cut Looms: BTC Dip to 95K-100K = Prime Entry Before Moonshot? (October 29, 2025 )
I've been away from the market for a good long while. In essence, nothing much happened during that time.
We're just hanging out in a sideways range, waiting for the big events:
1. Fed Interest Rate Decision
2. FOMC Press Conference
3. Trump and Xi
In just a couple of hours, we'll see that 0.25% interest rate cut. And there'll be a key speech from Jerome Powell.
For today, trader sentiment looks mostly positive, from what I can tell. But I've got this gut feeling the market's gonna dip again.
The sweet spot for entry on Bitcoin should be 95k to 100k. They'll sweep the long liquidity once more, and then we'll head higher. That's how I see this event shaking out.
Charts:
➖ On the 5-day timeframe, that key level around 95k is still holding. Once it's tested, it'll clear the way for a push up to 145k to 200k (the final leg up).
➖ Chart from Coinglass Legend, which shows long trader liquidations stacking up below from $93k to $98k on the Bybit exchange. I figure they'll clear out that liquidity first before we rally.
➖ Big cluster of orders right nearby on the Coinbase crypto exchange at 93k and 100k, which backs up this zone as a hot spot. Whale money's piling in, partly by scooping up those trader liquidations.
As you know, messing with leveraged trades is a risky game.
The smart play is limit orders, and stick to spot only 😀🔥.
#Crypto #Trading #Coinbase #FED #FOMC #STOCK

Solana – Saucer Pattern & Key Resistance in FocusSolana is starting to stand out with notable relative strength versus both Bitcoin and Ethereum, and it's catching my attention this week.
✅ Key Support Holding:
Price recently held firm at the $185–$190 support zone, bouncing with strength and attempting to establish a higher low. If this level holds, it would further confirm the uptrend in place since April.
📉 Corrective Phase Since September:
Despite the pullback, the larger trend structure remains bullish. A break above the September high is still needed to confirm trend continuation.
🔵 Multi-Month Saucer Formation:
A rounded base is developing on the daily chart—a classic saucer bottom. If confirmed, this pattern points to major upside potential, with a projected move possibly targeting $500 over time.
⚠️ Watch This Zone Closely:
The $250–$260 resistance area is the key overhead level to clear. A decisive breakout here could trigger a strong rally and confirm the saucer breakout.
📌 Summary:
Solana is showing resilience, building a bullish structure, and forming a significant base. If momentum builds above $260, bulls may take control in a big way.

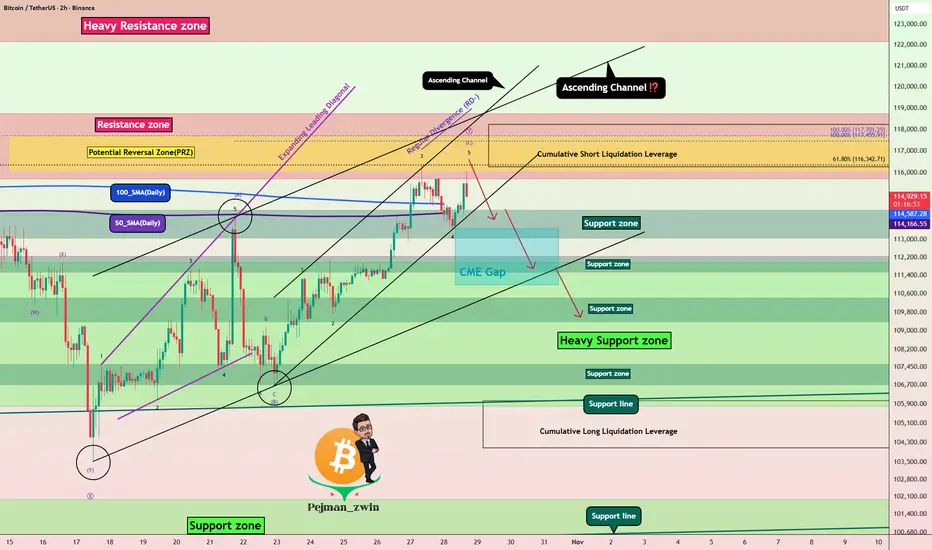
Bitcoin Hits PRZ – Time for a Correction?As I expected yesterday , Bitcoin ( BINANCE:BTCUSDT ) did drop down to the Support zone($114,300-$113,000) at the lower line of the ascending channel and then started rising again today. Both Long and Short positions basically hit their Targets .
At the moment, Bitcoin is moving near a Resistance zone($118,740-$115,740) , the Potential Reversal Zone(PRZ) , and Cumulative Short Liquidation Leverage($118,224-$116,281) .
From an Elliott Wave perspective , it seems like Bitcoin is completing the microwave 4 of the microwave C of the main wave Y . There's a noticeable Negative Regular Divergence(RD-) between the last two peaks, which suggests some weakening momentum .
I expect that Bitcoin won't break through the Resistance zone($118,740-$115,740) easily and may fall back at least to the Support zone($114,300-$113,000) . If it drops below the 100_SMA(Daily) and 50_SMA(Daily) , we could see a deeper decline and possibly the CME Gap($113,495-$110,990) being filled.
Note: Another point to mention is that although the SPX500( TVC:SPX ) has been hitting new all-time highs as the new week began, BTC has shown a bit less correlation with it in the last day. So if the S&P 500 undergoes a correction, Bitcoin might actually see a sharper pullback, which is something to watch out for as a potential negative factor for Bitcoin.
Note: Also, keep in mind that tomorrow, some important U.S. economic indices will be released, which could also influence the market. So definitely factor that into your considerations.
Note: In general, the crypto market in the past couple of weeks has been heavily influenced by news around U.S.-China tariffs. Any headline can cause Bitcoin and other tokens to swing up or down, so keep an eye on those geopolitical headlines.
Cumulative Long Liquidation Leverage: $106,033-$104,090
Please respect each other's ideas and express them politely if you agree or disagree.
Bitcoin Analysis (BTCUSDT), 2-hour time frame.
Be sure to follow the updated ideas.
Do not forget to put a Stop loss for your positions (For every position you want to open).
Please follow your strategy and updates; this is just my Idea, and I will gladly see your ideas in this post.
Please do not forget the ✅' like '✅ button 🙏😊 & Share it with your friends; thanks, and Trade safe.