Bitcoin Weekly Roadmap: 50_SMA(Weekly) Lost — $70K Break Next?Let’s start with my previous weekly analysis on Bitcoin from Jul 11, 2025 , which showed that when higher timeframe technical analysis is done right, it can be impactful and help capture key trends. Back then, we identified the All-Time High(ATH=$126,199) and the subsequent correction accurately.
Now, let’s explore what the next weekly move might be—stay with me!
Bitcoin, after losing its uptrend lines and the weekly 50_SMA(Weekly), has shown weakness in its bullish structure. Historically, on Bitcoin’s weekly chart, the 50_SMA(Weekly) has been a critical support. Each time it’s lost, Bitcoin has extended its correction. We’ve seen two similar moves on the weekly chart: Bitcoin pulled back to the 50_SMA(Weekly) and then dropped again. Right now, that pullback is complete, and we can anticipate a fresh decline.
While many analysts expect a bullish “head and shoulders” pattern to push upward, I see that as unlikely:
The S&P 500( SP:SPX ) is near its all-time highs and is more likely due for a correction. Given its correlation with Bitcoin, an S&P drop could pull Bitcoin down, especially with sharp moves.
Also, USDT.D% ( CRYPTOCAP:USDT.D ) has broken past a heavy resistance zone and may continue rising—this could add more pressure on crypto, including Bitcoin.
Additionally, the US 10-Year Government Bond Yield ( TVC:US10 ) is breaking resistance lines, which signals risk-off sentiment—another factor that could lead to declines in assets like Bitcoin and gold( OANDA:XAUUSD ).
Looking at Bitcoin’s weekly chart: Bitcoin is in a heavy support zone($76,600-$64,850) and there’s a CME Gap($84,560-$79,660) above.
From an Elliott Wave perspective, Bitcoin has completed its main 5-wave impulse. Signs include the loss of uptrend lines and the 50_SMA(Weekly).
I expect Bitcoin to break the heavy support zone($76,600-$64,850). It may bounce near $68,000, but if negative news increases, we could see a drop to the $58,000–$59,000 range in the coming weeks.
Note: Increased Middle East tensions could accelerate reaching these targets faster. Let’s stay vigilant!
What do you think? Can Bitcoin fall below $70,000, or should we wait for the price of Bitcoin to rise again?
💡 Please respect each other's opinions and express agreement or disagreement politely.
📌Bitcoin Analysis (BTCUSDT), Weekly time frame.
🛑 Always set a Stop Loss(SL) for every position you open.
✅ This is just my idea; I’d love to see your thoughts too!
🔥 If you find it helpful, please BOOST this post and share it with your friends.
Btc-e

Coinranger|BTCUSDT. Moving to H16 aim level🔥News
🔹JOLTS employment report at 18:00 UTC+3
🔥BTC
🔹Still moving within Monday's forecast. Let's see what's on the screens:
1️⃣ Dynamic levels above are 72600 and its potential extension to 75300.
2️⃣ 68470 remains actual below. Anything could happen when it gets there.
For now, I'm waiting for the H16 level to be reached.
---------------
Share your thoughts in the comments!

Another leg down to $73k for Bitcoin? Is Bitcoin setting up for another leg down to $73k for a day trade? The $77.9k support needs to hold if bulls want a push toward $81k.

Bitcoin Weekly – Bearish Continuation Thesis (Higher Time Frame)Note / Preface:
This publication focuses on higher-timeframe (weekly) structure and macro justification. Additional Fibonacci levels, minor supply/demand zones, and other references mentioned in the text but not shown on the chart exist on lower timeframes and are intentionally omitted to preserve clarity. The chart displays only the most pertinent macro levels used to frame the higher-timeframe thesis and potential decision areas.
Thesis:
This thesis is based on higher-timeframe structure, trend, and auction behavior using the weekly chart.
Following the ATH, BTC rejected the golden pocket (≈107–110k), overlapping a major supply zone, and formed a weak corrective channel that resolves as a bear flag. The retracement failed near the 0.5 level, with repeated rejection from supply at 90–93k. No weekly candles accepted above the channel midpoint, suggesting persistent seller control rather than accumulation.
Momentum confirms the structure. Weekly RSI remains in a bear regime (below the EMA and the 50 midpoint), and rallies continue to behave as corrective rather than impulsive.
The measured move from the bear flag pole (thick vertical yellow lines) projects toward ~62k, aligning with a large multi-cycle supply/demand zone (≈53–63k), the rising 200-week SMA (yellow dotted line), and the 0.382 retracement of the Nov 2022 low to ATH (~57.7k). Notably, the anchored VWAP (brown/orange line) from the 2022 low currently sits near the top of this zone (~63k), making it a likely area for long-duration participant defense and a potential reaction.
A bullish Cypher harmonic is tracking toward completion near this region. Harmonic completion is expected to produce a reaction, not necessarily a reversal—either a short-covering bounce followed by a back-test, or a deeper liquidity sweep within the zone. MACD histogram divergence supports the potential for a counter-trend reaction but does not override bearish structure without acceptance and regime change.
From a trend-following perspective, moving-average behavior is consistent with a late Stage 3 / Stage 4 environment under Stan Weinstein’s framework, reinforcing a bearish-until-invalidated bias.
The bearish thesis remains intact unless BTC reclaims 90–93k with acceptance and exits the RSI bear regime. The 53–63k zone is viewed as a high-probability reaction and reassessment area, not a hard target.

BTC 65-70K IS VITAL FOR BULLSMorning folks,
So, as we suggested last time, we're at 70K. Today we talk about big picture. Recent action tells two things. First is - long-term upside reversal, whenever it will happen, it takes "W" shape, not "V" one. Because long-term volatility and oversold level is broken. DiNapoli calls it as VOB (Volatility Breakout) trade.
Second - market now stands at vital long-term area for bulls. This is 66K. Because this is Yearly Pivot Support 1. Downside breakout means that major upside trend is broken. Besides, this is previous top and consolidation level. Downside breakout leads BTC in area of 50's with 57K as the first target.
But everything is so bad. Chances exist, so let's just keep watching. First - on our H&S pattern on 4H chart.
Since market stands at the targets that we specified last time. I set "neutral" mark for this update. But, overall context is bearish of course.

Full top down on BTC & ETH, Geronimo for nowIt seems we are being given a once in a lifetime opportunity to start from the bottom and get another chance to strike huge on the next ATH run!

Bitcoin Could Fade Into Irrelevance in the Next Bear MarketIf you haven`t sold BTC recently:
Now you need to know that Bitcoin (BTC) has been trading in a corrective phase after failing to sustain above $100,000 earlier this year.
Strategy (formerly MicroStrategy), led by Michael Saylor, holds over 671,000 BTC – acquired at an average cost basis of approximately $74,972 per BTC.
The company's aggressive accumulation has been funded through a combination of convertible debt, equity issuance, and at-the-market offerings, creating significant leverage.While Saylor frames this as "Bitcoin yield," it amplifies downside risk.
A sustained drop below the ~$75K average cost basis would flip unrealized gains into losses, potentially triggering margin pressures on debt covenants, forced dilution to raise capital, or – in a worst-case spiral – partial liquidations to service obligations.
MSTR stock already trades as a highly correlated, leveraged proxy to Bitcoin (historical beta often 1.5x–2x). A
BTC breakdown below $74K could compress MSTR's premium to NAV dramatically, sparking retail and institutional selling.
This, in turn, would pressure Bitcoin further if Strategy is forced to slow purchases or (unlikely but possible in extreme scenarios) sell holdings.
This setup creates a classic self-fulfilling prophecy: bearish sentiment drives price lower → crosses key psychological/technical level at $74K → leverage unwind in the largest corporate holder → accelerated selling → deeper correction.
Technical Outlook: Path to Sub-$74KFrom a chart perspective: BTC has rejected the $100K–$126K highs and is forming lower highs.
Key support cluster sits around $80K–$82K (prior resistance turned support).
A break below $80K opens the door to $74K retest – aligning perfectly with Strategy's average cost.
Further downside targets: $70K (38.2% Fibonacci retracement of the 2024–2025 rally) and the $62K–$72K zone, a major demand area from mid-2025 consolidation.
Bear Case Target: Sub-$74K, potentially triggering the leverage feedback loop described above.
Buy Area: If we see capitulation, the $62K–$72K zone represents strong historical support and a potential accumulation range for long-term holders.
This area coincides with prior cycle highs and significant on-chain volume.

USDT.D VS BTC With BTC testing April 2025 tariff war lows, many will be searching for the low/bottom of the move down.
The Tether dominance chart is often a good indicator of potential turning points in Bitcoins price. Looking at 2023 onwards which was roughly the end of the bear market and start of this bull market cycle, USDT dominance sat around 9% before a sharp drop to kick off the bull run.
Throughout the chart this pattern continues, with each high in USDT.D it means BTC puts in a relative low. However, the charts are not just opposites in that if USDT tops then BTC bottoms, the Tether chart is a clearly defined range compared to Bitcoins trending chart. It's because of the predictable nature of a range where price reacts at the extremes, the support and resistance areas can be estimated on the BTC chart.
Currently with BTC's price falling and testing April 2025 low, Tether has climbed and will soon be hitting the Bearish Orderblock/ origin of the October 2023 rally. For me that is a high probability area of resistance for USDT.D and so a potential bottom for BTC around $68,000.
IF that is to be the case Tether would be rangebound between grey and red zones with a relief rally from BTC being capped off by the grey zone, perhaps around $80,000.

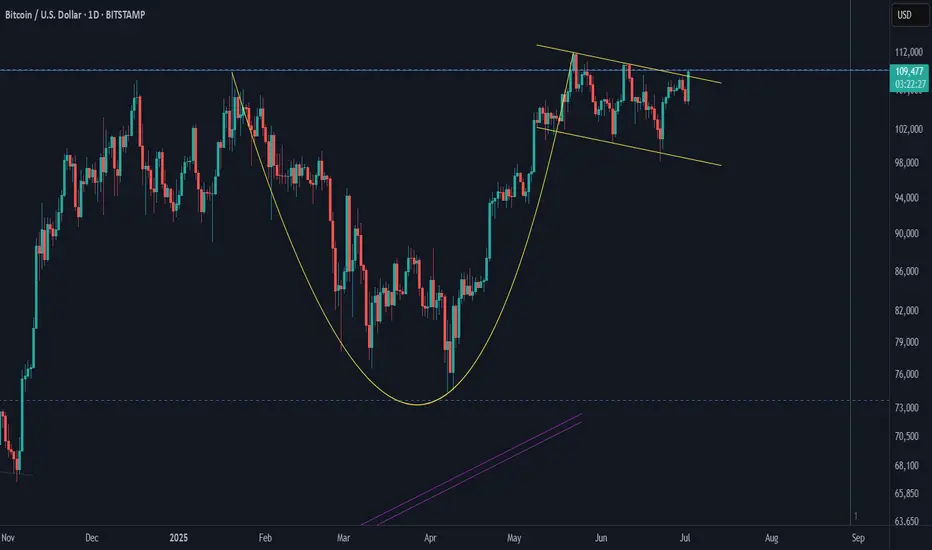
Bitcoin Upward Waves vol 2Continuing from the previous Bitcoin analysis:
Bitcoin is trying to break the Handle upward. If successful, that means the Cup and Handle pattern is confirmed. Next, have to wait for Bitcoin to go up and finish the pattern. How far can Bitcoin rise? Let's see what happens.
Bitcoin weekly —Crash warning & what to expectHere we are again looking at Bitcoin on the weekly timeframe. We can easily appreciate how bullish potential can become active again but also how a major crash is possible if nothing happens.
Resistance vs support —Good news vs bad news
Bitcoin is trading below support which opens up the market to a major flush. This is the bad part.
The good news has several points:
1) If a crash/flush were to happen now on Bitcoin, it would be short-lived. It can happen really fast and end with a chart supporting months of bullish action.
2) The week is still young. It is only Wednesday. While Bitcoin is trading below support it can recover before the week ends. A confirmation on this timeframe only comes after the session closes.
Bitcoin below $70,000?
Bitcoin is already trading at extreme levels in relation to the current bearish wave. Any touch of $70,000, $65,000 or $60,000 can lead to a strong reversal. Or the same support that is now active now holding through the week.
How long will it take?
1-2 weeks are still in the air as to what comes next. After two weeks, including this one, the picture will be 100% clear. By the time two more weeks close, we will know full well if Bitcoin will continue on a perpetual crash, forever down, or if the bullish reversal will show up.
This is also part of the good news. The lower it goes, the stronger the reversal that follows.
If Bitcoin moves below $70,000, this can open up space for not only 1-2 months of bullish action on the altcoins but 2-4 months. For Bitcoin itself, the same amount of time remains open for a relief rally. More time is needed.
Conclusion
Overall, we have to wait for the weekly close. Any additional bearish action now can be just momentary as the current ABC bearish wave has been active for four months, 120 days.
It is almost over... We are going up next.
Namaste.

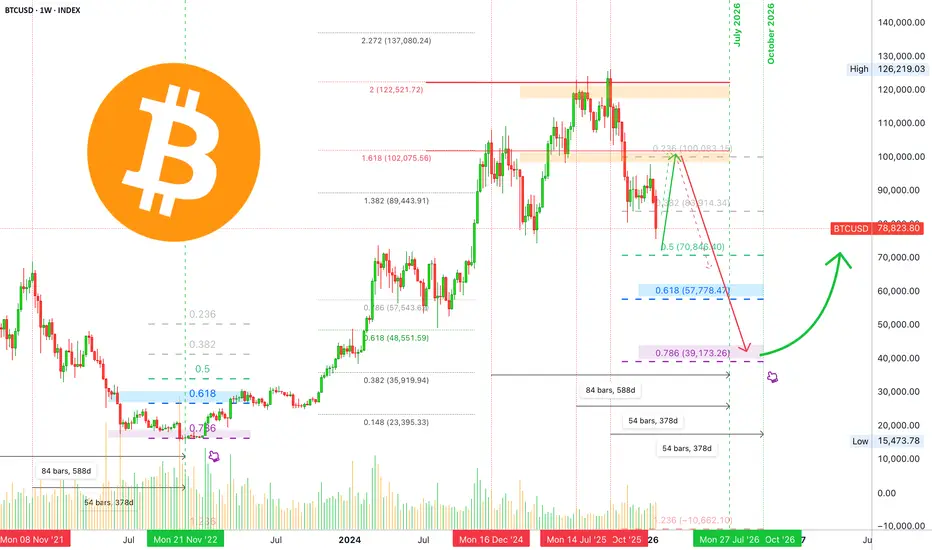
Bitcoin long-term: Full analysis year 2026 including 2027 & 2029My dear reader... It is my pleasure to write again for you today. I would like to show you the chart for Bitcoin long-term; what it looks like, what to expect.
Recently, we had a nice surprise with a bearish move that lasted just a few days longer than expected. A supposed retrace that went from $98,000 to $76,000 in a matter of 16 days. A drop more than 22% strong (-22.76%).
I was having doubts about the final wave of the relief rally. I continued to doubt its duration with an end date around mid-February being just too early, things just didn't add up.
The picture is clear now, based on the current move and the four consecutive red months close, we can easily see a full green February 2026 and also March 2026. The variation comes in March. It can be full green as well with a top in April, as it happened many times in previous cycles, or until mid-March. But now, the picture is clear when it comes to room for growth and duration for a relief rally.
Since $98,000 produced such a strong rejection, this becomes the main resistance on the way up. That is, ~$100,000 is the barrier now, keep this level in mind to prepare for short at the end of the C wave.
There is a saying in this market, "Sell in May and go away."
Let's start to map Bitcoin's long-term chart.
Q1 2026 bullish. Sometime around February, March and April. Can be just February and March. Allow for strong variations.
Q2-Q3 2026 bearish. Bear market climax. Two dates are available for the main lows. July 2026, a major low. October 2026, potential final low. Can be a lower low or higher low or double-bottom. October 2026 is of great interest because the peak happened October 2025. Bitcoin tends to turn bearish for a full year.
Q4 2026 neutral. Recovery period. Bottom consolidation. Some weak bullish action. The start of bullish action very late in the year.
Q1 2027 bullish recovery. The bullish recovery is confirmed.
Q2-Q3 2027 consolidation after initial bullish breakout.
Q4 2027 the start of a new bullish cycle. A new uptrend is fully formed and confirmed. Long-term growth until the final peak sometime around late 2029.
This is our long-term map. As the action unravels, we adapt to market conditions. The map is not the terrain.
Going deeper into the action:
February 2026 can be a bit tricky. While action can turn extremely bullish, an entire month is still a long time. The market can be quite cunning and deceiving. The month can start weak, red, only to turn at some point and produce strong bullish action; do not be deceived. Everything on this chart allows for a wave of growth.
With that said, there is a scenario where the market goes straight down but this is the least probable one but still possible.
A bullish wave in the coming months would produce the classic head and shoulders pattern to conclude Bitcoin's 2025 bullish cycle. The right shoulder is a lower high and this confirms the 2026 major lower low.
Remember how PAXGUSDT and TSLA went bearish recently, clearly showing a worldwide bearish bias in 2026.
It is not yet over, there is time to prepare. When the final high is in, I will share lots of instructions, techniques and opportunities to weather the bear market. We are going up next.
Namaste.
EURJPY – 2H chart pattern...EURJPY – 2H chart pattern.
Nice structure on this one. Here’s the clean target map based on what’s visible.
What I’m seeing
Strong impulsive bullish move just completed
Price tapped into upper supply / resistance zone (yellow)
Ichimoku: price extended far above the cloud → pullback is healthy/expected
My marked arrows suggest a corrective move down, not full trend reversal (yet)
Sell / Pullback Targets 🎯
From current area 184.7 – 185.0:
TP1: 183.80 – 183.65
Previous structure + cloud top
Matches my first marked target
TP2: 182.60 – 182.40 🔥
Strong demand zone
Prior consolidation + liquidity pool
My second target point aligns perfectly
Invalidation / SL
If 2H closes above 185.50
→ pullback idea weak
Safe SL: above 185.80
Bias
📉 Short-term bearish correction
📈 Overall trend still bullish → watch for buys again near 182.5

XAUUSD (2H) chart:..XAUUSD (2H) chart:
What I see
Clear breakout above the descending trendline
Price is holding above the demand / yellow zone
Ichimoku cloud ahead is thin → easier upside continuation
Momentum looks corrective → turning bullish
Targets (step-by-step)
TP1: 5,120 – 5,150 (nearest resistance / reaction high)
TP2: 5,280 – 5,320 (previous structure resistance)
Final target: 5,480 – 5,550 🎯
(Matches my drawn target point + measured move)
Invalidation / Safety
If price closes back below 4,980 – 5,000 on 2H → bullish setup weak
Conservative SL: below 4,950
Bias
📈 Bullish continuation as long as price stays above the breakout zone

Bitcoin Roadmap=>End of RallyBitcoin ( BINANCE:BTCUSDT ) has gained nearly +10% in the recent weekly candle so far. The question is where this rally could end up. So to get to that zone, let’s go to the weekly timeframe .
Before we start this analysis, let’s take a look at my last analysis on the weekly timeframe , which was well into the Potential Reversal Zone(PRZ) . ( Analysis time: 9 JUN 2025 )
Bitcoin has now entered the Potential Reversal Zone(PRZ) and Time Reversal Zone(TRZ=June 23 to August 4) , and these zones could be the zones where this Bitcoin rally will end. Do you agree with me?
In terms of Elliott Wave theory , Bitcoin appears to be completing a main wave 5 , as the main wave 3 was an extended wave . The main wave 5 could end at the Potential Reversal Zone(PRZ) .
I expect Bitcoin to start a main correction from the Potential Reversal Zone(PRZ) and could continue to support lines and near the $105(at least) .
What do you think about the end of the Bitcoin rally?
Note: Sell orders near $120,000 are very heavy.
Note: Cumulative Long Liquidation Leverage attractive volume for liquidation.
Note: If Bitcoin goes above $130,000, it can continue to rise to the Resistance lines (near $150,000).
Please respect each other's ideas and express them politely if you agree or disagree.
Bitcoin Analyze (BTCUSDT), weekly time frame.
Be sure to follow the updated ideas.
Do not forget to put a Stop loss for your positions (For every position you want to open).
Please follow your strategy and updates; this is just my Idea, and I will gladly see your ideas in this post.
Please do not forget the ✅' like '✅ button 🙏😊 & Share it with your friends; thanks, and Trade safe.

Bitcoin Feb, 2026The information and publications are not meant to be, and do not constitute, financial, investment, trading, or other types of advice or recommendations.

BITCOIN PREDICTION – GAME PLAN📊 Market Sentiment
Market sentiment is currently extremely bearish. We continue to see consistent outflows from Bitcoin ETFs. In addition, the Fear & Greed Index is sitting at 22 (Fear zone) and has remained there for some time.
Bitcoin has largely decoupled from the S&P 500 (US markets), and capital does not appear to be flowing into crypto at the moment. Unless a new and strong narrative emerges, I do not expect the market direction to change.
Today’s CPI data came in at 2.7% versus a 3.1% expectation, which could act as a positive catalyst for risk assets. We saw this effect clearly in U.S. equities; however, Bitcoin and the broader crypto market remained unresponsive. This further confirms my view that sentiment remains aggressively bearish.
📈 Technical Analysis
Price has been in a clear downtrend for some time. Over the past month, Bitcoin has been consolidating within a tight range.
In my opinion, this consolidation is more likely to resolve to the downside. While risk assets such as US100 continue to push higher, Bitcoin’s inability to follow reflects clear relative weakness.
📌 Game Plan – Prediction
I am monitoring two main scenarios:
Scenario 1 (Red Line – More Likely)
I expect price to decline toward $80,500, where we may see a short term bounce. However, I believe this bounce will fade, with the primary downside target at $74,500.
After price runs $74,500, I will be looking for potential long/buy opportunities.
Scenario 2 (Black Line)
Price first moves up toward $96,000, gets rejected from that level, and then closes back below it. From there, I expect continuation to the downside toward $80,500 and potentially $74,500.
💬 For deeper sentiment and strategy insights, subscribe to my Substack free access available.
This analysis is for educational purposes only and does not constitute financial advice. Always conduct your own research before trading or investing.

Coinranger|BTCUSDT. Reversal or continued decline?🔥News
🔹Today, the US votes on the government budget.
🔹US manufacturing PMI at 18:00 UTC+3.
🔥BTC
🔹A mega-drop to 74600. What's next:
1️⃣ Above there is the level at 79500, but it's dynamic. And until there's some kind of movement stop, there's nothing more to say. Keep an eye on your moving averages.
2️⃣ Below, a full set of waves with extensions on the h4 timeframe has already been completed. A reversal attempt could occur around the current level. There are 72900 and 71050 a bit lower on the hourly timeframe – a complete set of three consecutive downward sets.
I wouldn't do anything for now. It's best to wait for one of the above scenarios to play out.
---------------
Share your thoughts in the comments!

BTC Short Running with 1:3RRBTC Short Running with 1:3RR
Loving this BTC Short so far. Actual target is around 74-75K.

BITCOIN UPDATE – CRUCIAL ZONEHey Traders!
If you’re finding value in this analysis, smash that 👍 and hit Follow for high-accuracy trade setups that actually deliver!
BTC has reached a major confluence area 🔥
📌 Weekly support trendline($72k-$73k)
📌 Strong demand zone ($75K–$78K range)
This zone has acted as a launchpad in the past, and once again BTC is showing reaction from support 📈
🟢 Macro correlation to watch:
🔻 Gold & Silver are forming a top and have started correcting
Historically, whenever metals cool off, capital rotates into BTC 🚀
➡️ This strengthens the bounce probability from this region.
📊 What to expect:
As long as BTC holds above the weekly support, a strong upside move can follow.
❌ Invalidation:
Weekly candle close below $71K will invalidate this bullish view.
Patience + structure = edge
Stay disciplined. Stay profitable 💪

BITCOIN - Correction to 81K - 82K before the fallBINANCE:BTCUSDT.P is forming a correction after a decline. The market is testing 79,200 (the consolidation boundary), which could trigger a breakout and momentum for a retest of the liquidity zone.
The fundamental background remains weak, there is still no support for the market in this direction, and the crypto winter phase may continue for some time. Statistically, after a sharp fall or a strong trend, the market should move into a sideways range/flat, where accumulation for a trend reversal may form.
Bitcoin is in local consolidation after strong sell-offs. The market is storming 79,200 and, as part of the correction, may break through resistance and head towards the zone of interest 81,000-82,000 before falling.
The cryptocurrency market, like Bitcoin, is in a downtrend. The coin tested support at 75K, but the area of interest (74,500) was not reached. Accordingly, due to the relevance of the liquidity zone, the market may form a short squeeze and return to the target.
Resistance levels: 79,200, 81K, 82,000
Support levels: 77,850, 74,500
I expect two movements from the market. As part of the current correction, Bitcoin may form a breakout of 79200 and an impulse to 81-82K, but bears are likely to keep the market in this zone and provoke a further decline to 77900 - 74500.
Best regards, R. Linda!

BTCUSD – 1H Technical, Supply–Demand & Market LogicBitcoin is still trading inside a clean, well respected descending channel, and nothing in the current price action suggests trend exhaustion. What looks like a bounce is structurally a corrective pullback into supply, not the start of a new bullish leg.
Technical Structure
- Trend: Clearly bearish consistent lower highs and lower lows
- Channel: Price is reacting perfectly to the upper and lower boundaries of the descending channel
- EMA (dynamic resistance): Every rally into the EMA has been rejected, confirming sellers remain in control
The recent move from the demand zone near 74,800–75,200 is a technical reaction, not accumulation. That demand has already been tested and partially consumed. Price is now pushing back into a supply zone around 78,500–79,500, aligned with:
- Channel resistance
- EMA resistance
- Prior breakdown structure
This confluence makes the area high-probability sell-side liquidity.
Supply–Demand & Liquidity
- The green demand zone below has weak hands, not strong absorption
- The current upside move is best interpreted as stop-hunting and short-term relief
- The dotted projection shows the classic bearish path:
bounce → rejection → continuation lower
If price fails to reclaim and hold above the supply zone, the next move favors a breakdown through the demand zone, opening the path toward the major liquidity target near 71,900.
Macro Context
Risk assets remain under pressure as:
- Financial conditions stay tight
- Volatility picks up
- Speculative positioning continues to unwind
In this environment, Bitcoin behaves like a risk asset in distribution, not a safe haven.
Key Takeaway
As long as BTC remains inside this descending channel, every rally should be treated as a selling opportunity, not a breakout. A real trend shift requires acceptance above channel resistance until then, downside continuation remains the dominant scenario.
This is not panic selling / This is controlled markdown.

BTC Bitcoin CRASHING! Is the $74K Floor About to BREAK?The macro narrative heading into this week is dominated by a sharp "crisis of confidence" as Bitcoin recently plunged nearly 40% from its 2025 all-time highs 🏦. The primary driver is a combination of risk-off sentiment triggered by the hawkish stance of the new Federal Reserve nominee and a massive $2.5 billion liquidation event that swept through the derivatives market. Interestingly, general online sentiment has hit "rock bottom" with a notable shift toward extreme fear, suggesting a potential liquidity hunt before any sustainable recovery can take place. While some institutional voices are calling for a further drop toward the $60,000 handle, the current proximity to one-year lows usually signals that the retail crowd is already maxed out on pessimism 🧹.
We are seeing a Bearish Market Structure on the Daily timeframe 📈, characterized by aggressive selling pressure that has pushed price into a critical structural retest. However, widespread community chatter is heavily leaning into the "death cross" and further collapse, which often tells me retail is positioned poorly for a potential relief bounce. Price is currently testing a significant green support zone identified between $74,000 and $76,000, which aligns with the previous accumulation range seen in early 2025.
We are currently trading at the bottom of the range, effectively "balancing on a knife-edge" near $76,405. I am watching for a 'run on liquidity' to sweep the late sellers I'm seeing across various social forums who are chasing the breakdown 🧹. If we see a failure to close below the $74,000 level, it could set the stage for a violent short squeeze as those bearish retail positions are forced to cover.

Why BTC is Heading to $43k!Looking at the weekly chart, the picture for Bitcoin is becoming increasingly bearish. We have a clearly defined Head and Shoulders pattern, and the recent price action suggests we are at a critical tipping point.
Technical Outlook: The "Right Shoulder" has just been completed right around the 2025 Open level.
My primary scenario involves a short-term corrective bounce towards the zone between the 2026 Open (~$88,000) and 2025 Open (~$94,000) to flip previous support into resistance.
Following this, I expect a continuation of the downtrend with a primary target at the 2024 Open level (the ~$42k - $45k area), representing a potential -44% move from current levels.
Fundamental Headwinds:
Institutional Exit: Over the last 3 months, we've witnessed a massive $6.18 billion outflow from BTC ETFs.
BlackRock Signal: Notably, even BlackRock's client base has shown a significant shift toward selling, which often precedes a deeper market correction.
The MicroStrategy Risk: With their average purchase price hovering around $76,052, the current market price puts them near a break-even point. If BTC sustains a move below $70k, the pressure on their balance sheet becomes a real "black swan" threat.
The 2nd Year Presidential Cycle: We are currently in the second year of Trump's presidency. Historically, the 2nd year of any US presidency over the last 50 years has been the weakest for high-risk assets.
This is typically the year when economic "skeletons in the closet" appear. I don't expect a sustainable bull run until 2027 (the 3rd year), when administrations historically pump the markets to ensure favorable re-election conditions.
Conclusion: The technical breakdown combined with institutional outflows and unfavorable cyclical timing points to a long-term correction. Watch the 2024 Open level as the ultimate magnet.
Resistance Zone: $88,000 - $94,000
Target: $43,000 (2024 Open)
Not financial advice. Trade at your own risk!
