BITCOIN hit 10-month Low! Will it recover, at least a bit??Bitcoin (BTCUSD) almost hit today (so far) its 10-month Low of the April 07 2025 Low (Support 1). It did so after a very disappointing 2-week bearish streak where it initially had a crystal clear 1D MA100 (green trend-line) rejection, followed by two on the 1D MA50 (blue trend-line).
The pattern is technically quite similar to the January - March 2025 Channel Down correction that led to the April 07 bottom. With the 1D RSI turning massively oversold in the process, hitting the 23.50 Support, where both the November 21 2025 and February 26 2025 Lows were priced, it is possible to see a rebound to test the 1D MA50 at least, again.
Since however this is a Bear Cycle and not just a short-term correction within a Bull Cycle, we don't expect a sustainable rally like April - May 2025 but rather a prolonged sideways volatile price action, that could retest the 1D MA100 even before making a new Low and start Phase 2. For now, at least, a rebound to $87000 seems like a technical probability.
Do you think that's the case or BTC will drop even lower more aggressively? Feel free to let us know in the comments section below!
---
** Please LIKE 👍, FOLLOW ✅, SHARE 🙌 and COMMENT ✍ if you enjoy this idea! Also share your ideas and charts in the comments section below! This is best way to keep it relevant, support us, keep the content here free and allow the idea to reach as many people as possible. **
---
💸💸💸💸💸💸
👇 👇 👇 👇 👇 👇
Btc-e

Bitcoin - Will Bitcoin recover?!Bitcoin is below the EMA50 and EMA200 on the four-hour timeframe and is in its descending channel. Bitcoin's upward correction towards the specified supply zones will provide us with its next selling opportunities.
It should be noted that there is a possibility of heavy fluctuations and shadows due to the movement of whales in the market and compliance with capital management in the cryptocurrency market will be more important. If the downward trend continues, we can buy within the demand range.
By the end of January 2026, Bitcoin once again moved into the spotlight of global investors. However, instead of establishing a decisive bullish trend, the market entered a consolidation phase accompanied by downward-leaning volatility, a development that is well supported by on-chain metrics and fundamental indicators.
One of the most significant fundamental signals during this period has been related to on-chain activity and Bitcoin’s supply structure. Recent data show that illiquid Bitcoin supply—coins that are highly unlikely to be spent—has reached historically elevated levels, approaching record highs. This indicates that Bitcoin holders are increasingly inclined toward long-term holding, avoiding selling at current price levels. Such behavior reflects structural confidence in the asset and can contribute to reinforcing a price floor.
At the same time, Bitcoin balances on exchanges have declined, suggesting a reduction in potential selling pressure—an important factor that can help prevent sharp drawdowns during consolidation phases.
Whale accumulation data further reveal that large market participants retained a substantial portion of their Bitcoin holdings throughout 2025, while retail investors showed a greater tendency toward short-term selling.
Bitcoin’s pullback toward the $75,000 level caused the market value of Strategy’s digital asset holdings to fall below the company’s average purchase price for the first time in several months. Led by Michael Saylor, Strategy is one of the world’s largest Bitcoin holders, owning 712,647 BTC at an average acquisition cost of approximately $76,000.
While this situation carries psychological significance, it has limited financial implications. None of Strategy’s digital assets have been pledged as collateral. As a result:
There is no liquidation pressure;
No bank can force the company into a mandatory sale;
Strategy retains full discretion over whether to sell or continue holding its Bitcoin.
Strategy currently carries approximately $8.2 billion in convertible debt, with its first major maturity not occurring until the second half of 2027. The company has multiple options, including refinancing, converting the debt into equity, or redeeming it outright. This financing structure has previously been implemented successfully by other companies and is considered a proven model.

02/02/26 Weekly OutlookLast weeks high: $90,610.47
Last weeks low: $75,706.32
Midpoint: $83,158.39
With January of the new year wrapped up it's been quite the opening month for Bitcoin and the broader market in general.
The loss of the yearly open ($87,500) confirmed the bears remain in control and as such, with the help of an enormous crash in metals, pushed Bitcoins price back towards 2025's Yearly low of $74,500. Now in the early hours of the weekly open that exact level has been traded with a perfect double bottom on the HTF chart. Does this mean BTC is now safe to move back up?
A relief bounce may be on the cards from here, my targets would be the inefficiency zones at 0.25 ($80,000) and if the bounce has real backing maybe $86,000. However I am not yet satisfied that the April Low has been effectively traded just yet...
For more confirmation of a bottom being in I would like to see the demand zone swept with sellers continuing to pour in but buyers soaking up the volume resulting in very little price movement. In effect this would be forced sellers (liquidations) moving their BTC to high conviction buyers in the market. I am not yet satisfied that we have had this play out.
The fear and greed index sits at 14, the same score as the Covid crash but interestingly it's a higher score than the sell-off in November of last year at a score of 11. This gives us an interesting divergence similar to that of the end of the bear market in 2022. It's also significantly lower than the April low of last year at a score of 24.
This week is about seeing where/if BTC finds strength, with BTC strength alts will follow. Also Tradfi and specifically the metals market is something to keep a eye on. It's not everyday an asset loses $4T in value in 3 days like silver did!

Maybe your biggest risk is your biggest chance !!!The chart speaks for itself. As you can see, after breaking down from the descending wedge, the price has dropped. Now it can be said that the ABC corrective waves are close to completion, with only the final wave — wave C — remaining. I expect this wave to fall to around 69,000 dollars. After that, in my view, Bitcoin could rise to 130,000 dollars. Remember this: the sea erupts in a single moment, and nothing can stop it.

$BTC — Short-Term Base FormingCRYPTOCAP:BTC | 2h
Now that 74k has been tapped, I’m looking to see if price can start forming a short-term base in this area. Ideally, we want to see the 76–75.7k zone hold as support, which would help stabilize price action and set up a potential push higher. If that level continues to defend, the near-term upside target sits around 80.5k–81.3k.
For now, I’m letting price action develop and watching how buyers respond around this range before getting more aggressive.

BTC Getting Ready For Another Leg Up ?Following the recent crash, Bitcoin effectively swept all available liquidity around the $70K region, clearing out weak hands and stop orders. With that liquidity now taken, price action is beginning to stabilize, suggesting the market may be preparing for its next significant move. BYBIT:BTCUSDT.P reclaims structure and builds MOMENTUM, this phase could mark the transition from distribution into a new expansion or continuation leg, depending on volume and confirmation.

Bitcoin Testing Key Support | Don’t Miss This Signal! (1D)📊 Bitcoin Price Analysis | Major Support Zone, Liquidity Sweep & Potential Reversal | Daily & Weekly Outlook
Bitcoin is currently approaching a highly significant and well-established support zone that has historically acted as a strong demand area in the market. This region represents a key level where institutional buyers and long-term investors have previously entered the market.
Recently, Bitcoin has swept major liquidity pools and triggered multiple stop-loss levels. Through consecutive bearish drops and strong selling pressure, price has been driven closer to this critical support area. This type of liquidity grab often signals market manipulation by smart money and may precede a major trend reversal.
Based on current market structure, price action behavior, and technical confluences, Bitcoin is expected to react from the highlighted zone and potentially move toward the predefined upside targets. These targets are aligned with previous resistance levels, Fibonacci retracements, and structural highs.
⚠️ Important Timeframe Notice:
This analysis is based on the daily timeframe, which means the projected move is expected to develop gradually. The full realization of this scenario may take several weeks, requiring patience and disciplined risk management.
📈 Bullish Scenario:
If Bitcoin successfully holds above the marked support zone and shows strong buying momentum, a bullish continuation toward higher price targets is likely. Confirmation signals such as bullish engulfing patterns, higher lows, volume expansion, or structure breaks will strengthen this outlook.
❌ Invalidation Level:
This analysis will be invalidated if a weekly candle closes below the defined invalidation level. Such a breakdown would signal weakness in market structure and could lead to further downside movement.
🔍 Key Highlights:
Major long-term support zone in focus
Liquidity sweep and stop-loss hunt completed
Potential mid-term bullish reversal setup
Daily timeframe analysis (multi-week development)
Weekly close below invalidation = bearish continuation
📌 Disclaimer:
This analysis is for educational purposes only and does not constitute financial advice. Always do your own research and manage risk responsibly.
If you would like us to analyze a coin or altcoin for you, first like this post, then comment the name of your altcoin below.

BTCUSDThe price on the 1h timeframe is within an ascending triangle, which can be promising. If the price breaks this pattern with bullish candles, it could easily rise by the distance of AB=CD.

#GBPJPY , Today i wanna a good setup on GJ🔎 Instrument Focus: #GBPJPY
📈 Technical Overview:
Same as Sell side .
🚀 Trading Plan:
• Need Valid momentum Structure Close
• LTF ENTRY NEEDED ‼️
• Just and Only for QuickScalp

Odds suggest pullback out from 70-75KMorning folks,
So, we're here. As we said - BTC will drop and it has dropped. Now it is around 75K, but daily picture and some downside extensions suggest that it could reach ~70K area . If course it would be nice to catch it right at the bottom. But, generally speaking, we're in an area of 70-75K where odds on pullback are high.
If everything goes with our initial plan - we should get reverse H&S pattern with 100-105K target. But, this is next question.
Now, we just need to keep an eye on 1H chart trying to not miss potential bullish reversal patterns. That is what we're going to do now...

Bitcoin pull backBitcoin is on a very strong and important support about 72k and IMO we are going to see a strong bounce to 100k area one more time

GOLD reverse?GOLD has been continuing to drop upon market open. Waiting for confirmation as it is near the SUPPORT zone for a possible climb back up.

Lingrid | Where will Bitcoin stop falling?BTC just broke down from a triangle on the 4H chart and dumped straight into a support zone (the grey box).
Here’s the simple read:
✅ What I see
• The move down was strong → sellers are in control for now.
• Price is now at demand/support → this is where bounces often start.
📌 Two scenarios
1) Bounce scenario (most common):
If this green zone holds (no clean breakdown), BTC can bounce and try to climb back toward:
• the broken triangle area
• the descending resistance line (the main “ceiling”)
2) Continuation lower:
If BTC breaks below the grey zone and can’t reclaim it fast, the downside trend likely continues.

BTC — Price Slice. Capital Sector. 75559.30 BPC 1.4© Bolzen | The Architect | BPC Framework
Bolzen Market Institute
🏷 BTC — Price Slice. Capital Sector.
TradingView Publication Date: 10.01.2026
🏷 75559.30 — price not yet reached at time of publication.
🏷 BPC — The Bolzen Price Covenant — Strength Index: 1.4
Quantum structure of obligations and capital flow in price formation via energy blocks.
🏷 Vertical chart — Energy Grid Dashboard.
🏷 Static Stream 1: price published in energy-block production sequence.
🏷 The price energy block is already ordered—not by time, but by execution priority. Crucially: block priority dynamically reconfigures in response to hidden energetic impulses, whereas price execution order records their market manifestation. Every price in the dynamic stream is tied to proprietary energy-production metrics inaccessible to the general public. Those who perceive structure before its manifestation do not follow price—they anticipate it.
EΞ2Φ8Ψ45Θ·ζ⁻¹·106Λ732·Ω²
📎 Screenshot:
🏷 When trading from levels, use liquidity zones from BPC 10 and above.
🏷 Bolzen Liquidity Map — BTC (numerical equivalent):
🏷 In development — coming soon
🏷 I. Interactive Reference Guide: BPC — The Bolzen Price Covenant
🏷 P.S. English is not my native language — I offer no apologies for stylistic imperfections. What you see here is not a post. It is a demonstration of another level of preparation: the symbiosis of human intuition and algorithmic precision. Mathematics and aggressive market analysis — against the machine of liquidations.
The persistent ETH and BTC Energy Grid Dashboard remains publicly accessible and is intended for international institutional review.
— The Architect
BPC — The Bolzen Price Covenant

H&S on Bitcoin Daily Is Now Confirmed!Trading Fam,
Not a long post here as I have said enough on this in many of my previous posts. Just wanted to update you on the Head and Shoulders pattern. Our candle close today has now confirmed a break in the neckline. This is bad. We will now look to the weekly candle close to confirm further price action down. The weekly could save us. But this is doubtful.
Remember, I have outlined at least 6 additional strong bearish patterns in previous posts that have all been confirmed. This H&S was really the final nail in the coffin. My target down remains a rough 40-50k. If we're lucky, we'll turn up again at 60k. But that remains to be seen.
One more note and something to keep an eye on, Michael Saylor's MSTR BTC buy-in price is roughly 74k. If Bitcoin breaks below that for any sustained amount of time, things could get spicy!
The show must go on.
✌️Stew

Update —Lower right away or higher first? Bitcoin is going up!Whenever there is a challenge of resistance after a bullish move, of any size, there is always a retrace or correction. We are ready for this, we accept it and it always happens. It is just the nature of the market. It works in reverse also.
Whenever there is a challenge of support after a bearish move, of any size and shape, there tends to be a pullback or inverted correction, some sort of relief, even if the bearish move is set to continue long-term.
Bitcoin is showing several positive signals:
1) There is a hidden bullish divergence with the RSI. The recent low is a higher low compared to November but the candles produced a lower low.
2) The RSI is oversold, at the lowest since February 2025, a year ago.
3) The current lower low has less volume than the November low.
These are the three main signals. Then we can look at the shape and size of the bearish move.
In just 17 days, Bitcoin dropped a huge 22.68%. Bitcoin is no longer 6 years old. It is an adult now, worth trillions, 17 years old. This is a strong move by all standards and it happened really fast. It is unlikely that it will continue straight down. Relief within relief.
The up-move took a total of 54 days to reach a positive 22%. The fact that the bearish move was so fast, opens the door for a reversal to happen.
The April 2025 low support remains active and valid. If we go by past action, we can say this level can easily break as Bitcoin moves straight down; but, right now nothing is the same. We are witnessing different patterns, a very different market; a completely different world.
Let's stay open to the signals, market data and all that is coming from the charts.
Bitcoin is going up.
Namaste.

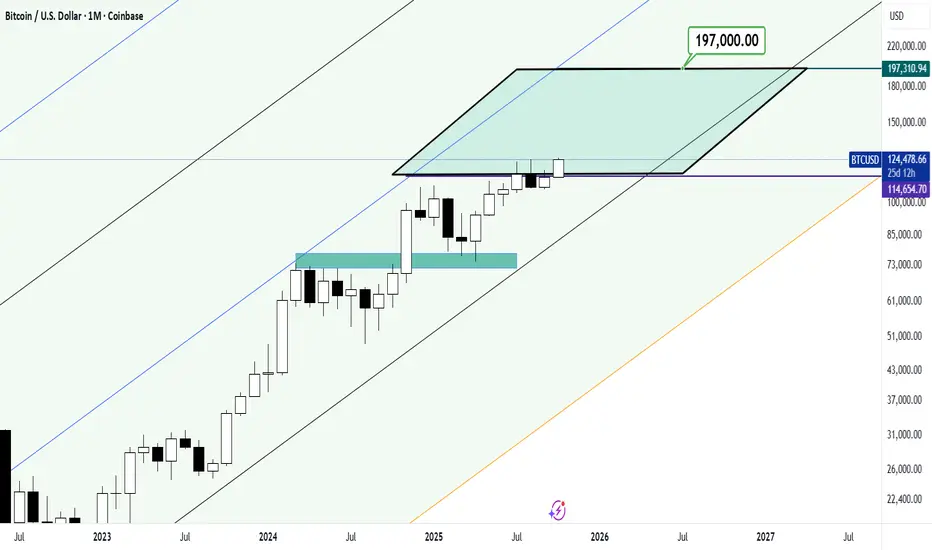
How long will the price stroking continue on the Bitcoin chart?A long-term analysis of Bitcoin’s trend suggests that we should expect a continued bullish trend in the coming months!
A price range of $197,000 per Bitcoin may seem far-fetched, but it would be very desirable and appealing to holders of this asset!!
Good luck!
Will this date come true?This is not fundamentally unbelievable, especially with the manipulation of governments in the crypto market
What is completely clear to us activists is the manipulation of absurd markets with great temptation by the yellow-haired doll and the child politicians and child killers around him.
Although I am not active in this market, I feel sorry for you, despite this cesspool soaked in the blood and hearts of the people of the world!
These numbers may not be realized, but the much blood that has been spilled on the ground will rise and the consequences will drown it.
The freedmen will definitely win.
And I must say, this analysis may expire after a while:
Good luck
MJ.REZAEI

Crypto Not Dead Yet- The crypto market is facing strong suppression. It’s still young and relatively small. I’m not a market maker or an insider, but the direction they’re pushing toward is hard to ignore and they’ll keep pressing this market down until you give up, and this time they make it harder.
- Anyone who witnessed 2018 and 2021 bullruns understands how quickly sentiment can flip. In crypto, x50 or x100 moves can unfold in a matter of few months. This market has never failed to see another sunrise.
- Forget all the noise. Only one thing matters on this chart : MACD is on the verge of a bullish cross ( see the green circle). Also note that altcoin dominance didn’t fall, it actually rose during the BTC crash.
- As a trader, my focus has always been long-term guidance to help peoples. Sometimes i was right and sometimes i was wrong, that’s the nature of trading.
Remember Opportunities are forged in blood, not chased in Euphoria.
No matter the choice you make, I wish you the best of luck !
Happy Tr4Ding !

BTC/USDT 1D 1️⃣ Market Structure
• Previously an ascending channel (higher lows + higher highs)
• A breakout from the channel occurred ➜ the structure changed to a downward one
• The current move is a downward impulse, not a correction
📉 This is no longer a healthy correction in an uptrend
⸻
2️⃣ Key Levels (what you marked)
🟢 Support Zones (now resistance)
• 84,300 – first support → broken
• 80,600 – key support → broken by an impulse
➡️ Both zones after retests = resistance
🔴 Downside Targets
• 75,150 – closest logical target (local low/demand)
• 69,950 – strong demand zone (weekly demand)
➡️ 75k very realistic, 70k possible with panic/news
⸻
3️⃣ Momentum & candles
• Long red impulse candles
• No lower wicks = sellers in full control
• No demand reaction after breaking 80.6k → market weakness
⸻
4️⃣ Stochastic RSI
• Entry into oversold
• BUT ❗
In a downtrend, the Stochastic RSI may stay at the bottom for a long time.
📌 This is not a signal to go long, but rather information that:
• Shorts should be careful of a short bounce
• Longs → scalp only, not swing
⸻
5️⃣ Scenarios (most important)
🔴 Baseline scenario (70–75%)
• Retest of 80–81k from below
• Rejection
• A drop to 75k
• A spike to the bottom is possible 70k
🟡 Alternative scenario (25%)
• Quick rebound to 84k
• Lack of volume
• Another bearish wave
➡️ Until price < 80.6k – BEARISH bias

HYPEUSDT - Dump after pumpBINANCE:HYPEUSDT.P ended its rally in the 35.0 zone, smoothly changing the market phase from pump to dump. The cryptocurrency market is weak, but after a sharp decline, there may be a local correction
Bitcoin fell again to 81K during the Asian session. A strong rebound or uptrend should not be expected at this time. There is no fundamental support for the crypto market. Any attempts at growth may be perceived as a hunt for liquidity before the fall.
Within the framework of the downward trend and the weak state of cryptocurrencies, HYPEUSDT formed a pump phase and tested the local resistance zone of 35.0. The market was unable to reach the liquidity zone of 36.4. Before continuing its decline, against the backdrop of a general market correction, the coin may test 31.38 - 32.90
Resistance levels: 31.38, 32.9
Support levels: 29.98, 28.4, 25.84
If the market rebounds after the fall, the coin may test the resistance zone of 31.38 - 32.9. Another short squeeze and a close below 29.98 could trigger a continuation of the dump down to the interim bottom...
Best regards, R. Linda!

Bitcoin BTC price analysisCRYPTOCAP:BTC is struggling to move higher.
Walls of limit orders are everywhere — sellers vs buyers — and OKX:BTCUSDT is basically stuck.
That’s exactly how consolidation & distribution phases look like.
🖐️ Trading manually right now?
Honestly — not the best idea. At this stage, mistakes often outnumber profits.
🤖 Meanwhile, trading bots keep doing their job:
• predefined ranges
• zero emotions
• steady volatility harvesting
👀 Retail traders (us) should wait.
When the “big money” finishes its battle and fires an impulse candle — that’s when we join the stronger side.
📊 Fear & Greed Index is slowly recovering:
from 10–11 last week → ~25 today.
🔑 Key CRYPTOCAP:BTC levels:
▪️ Resistance: $103K
▪️ Support: $84K
⚠️ Below $77K — the road toward $50K opens wide.
🎄 With holidays ahead, activity will likely drop even more.
For now — we observe, not trade.
🤔 What do you expect next for #Bitcoin: breakout or another leg down?
______________
◆ Follow us ❤️ for daily crypto insights & updates!
🚀 Don’t miss out on important market moves
🧠 DYOR | This is not financial advice, just thinking out loud

BTC at a Key HTF Decision Zone — Continuation vs ReclaimBitcoin is currently trading right at the major daily breakdown level around 78,000–79,000 after the sharp sell-off from the 84k–88k region.
This area represents a make-or-break zone where the market is likely to resolve the next directional move.
From a higher-timeframe perspective, the structure still leans bearish, but price is now sitting at a level where both continuation and a counter-trend recovery remain possible, depending on acceptance.
Scenario 1 – Bearish Continuation (currently favored by structure)
The breakdown from the larger descending structure is treated as valid and accepted.
Price fails to reclaim the 78–79k zone and continues to trade below it.
What would confirm this path:
Daily closes below 78,000–78,500
Weak bounces with declining volume
No strong bullish reversal candle on the daily timeframe
Failure to reclaim 79,500–80,000 on retests
Downside levels to watch:
74,460 – 74,400 → first major support (prior daily low / HTF reaction zone)
58,800 – 58,900 → key historical demand & psychological level
52,500 – 52,700 → extended downside target if broader risk-off continues
In this scenario, any bounce into resistance is treated as corrective, not trend-changing.
Scenario 2 – Reclaim & Relief Recovery (counter-trend, conditional)
Price successfully reclaims the 78–79k breakdown level and shows acceptance above it.
This would invalidate immediate downside momentum and open the door for a short-term recovery.
What needs to happen for this scenario:
Strong daily reclaim and close above 79,500–80,000
Follow-through buying volume
Formation of a clear higher low at current levels
Momentum stabilizing or showing bullish divergence
Upside levels in case of a reclaim:
84,000 – 88,000 → prior resistance / recovery target
92,000 – 96,000 → higher-timeframe consolidation zone
100k+ → only relevant if structure fully flips (not the base case)
A single wick or brief reclaim is not enough — price must accept and hold above resistance to shift the bias.
Final Thoughts
At the moment, the bearish continuation toward 74.4k remains the more probable path based on structure and momentum.
However, 78–79k is the line in the sand. A high-volume reclaim of this zone would quickly change the short-term outlook and force a reassessment.
Until then, patience and confirmation remain key.
