BTC & USDT.D - Who Follows Who?The eternal question in crypto, does Bitcoin lead USDT.D, or does USDT.D dictate Bitcoin’s moves?
At the moment, both charts are approaching critical inflection points.
CRYPTOCAP:BTC is retesting the $90,000 support, while CRYPTOCAP:USDT.D is nearing the 6.4% resistance.
As long as BTC holds above $90K and/or USDT.D remains capped below 6.4%, the bulls can still take over, paving the way for another impulsive rally across the crypto market.
But if these levels break… we may be in for a deeper correction before the next leg up.
So, who will make the first move? 🧩
⚠️ Disclaimer: This is not financial advice. Always do your own research and manage risk properly.
📊All Strategies Are Good; If Managed Properly!
~Richard Nasr
Btc-trend

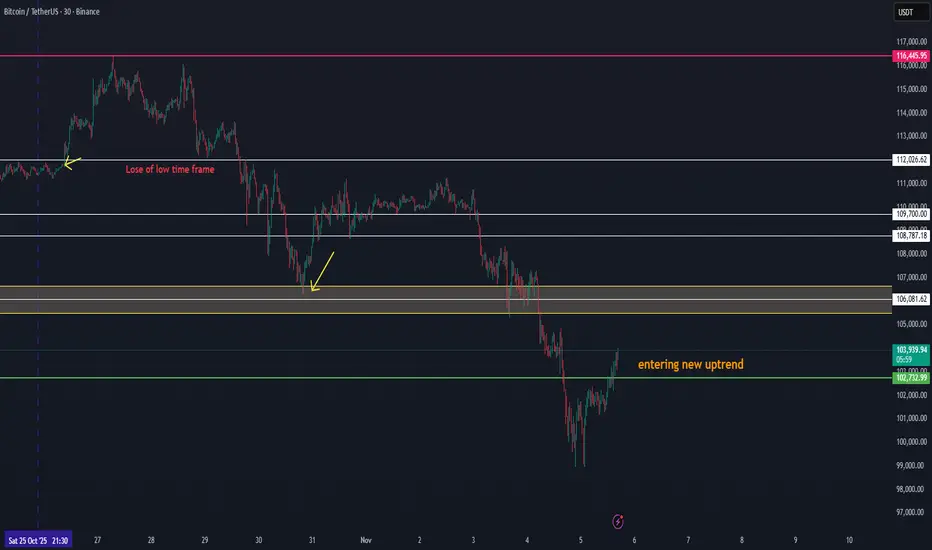
BTC Showing Early Signs of a New Uptrend Volume FormationBTC Showing Early Signs of a New Uptrend Volume Formation
Bitcoin is beginning to show new uptrend volume structure after a long corrective phase. This current movement around the 103K zone could be the first confirmation of renewed bullish momentum forming after the 110K area breakdown.
Here’s the technical context:
🔹 Structure: BTC has established a short-term higher low and is now attempting to build a new rising channel.
🔹 Volume Confirmation: The growing buy volume around 103K suggests early accumulation — this could mark the start of a new volume phase.
🔹 Targets: A sustained move above 103.8K–104.2K may confirm continuation toward 105K+, which would act as the first key resistance and validation of renewed market strength.
💡 Outlook:
If BTC maintains its current momentum and volume continues to rise, this could be the first stage of a new uptrend, with 105K+ as the initial upside target and potential re-entry toward the broader 110K recovery structure later.
BTC/USDT — Volume Strength Returns, Eyes on 110K+ RecoveryBTC/USDT — Volume Strength Returns, Eyes on 110K+ Recovery 🚀
Bitcoin is showing renewed momentum as it re-enters the volume+ zone, signaling stronger market participation after recent consolidation. The move above the low time frame structure confirms short-term strength and suggests a potential continuation to the upside.
Currently, BTC is holding steady around $108.9K, maintaining support within the accumulation range. If momentum continues, a breakout toward $110K+ looks increasingly likely, aligning with short-term recovery signals.
📊 Technical Overview:
Volume Zone: $108K–$109K
Short-Term Target: $111K
Main Resistance: $122.5K
Bias: Positive momentum forming above low time frame
A strong hourly close above $109K would further confirm the shift in trend strength, potentially opening the next leg higher toward $111K–$122K.
📈 Outlook: Bullish short-term structure forming

BTC - The Head and Shoulders of the Year?Bitcoin is shaping one of the most powerful reversal patterns traders could ask for: the inverse head and shoulders. After holding the ascending channel’s lower bound and bouncing from the key structure zone, BTC is signaling that bulls may soon take over.
Here’s what stands out on the chart:
🟢 Bullish Channel: Price continues to respect the rising channel, maintaining its long-term bullish outlook.
🛡️ Structure Zone: The $110,000 – $113,000 region is acting as a crucial pivot, flipping from support to resistance.
🔄 Inverse Head and Shoulders: A textbook reversal setup is forming, with the neckline aligning perfectly with structure.
🚀 Bullish Breakout: A confirmed break above this neckline could trigger the next major impulse move, putting BTC back on track toward higher channel targets.
Bulls need a clean daily close above the neckline for full confirmation — until then, the setup is in play but not yet validated.
📌 Will this become the pattern of the year that propels Bitcoin to new highs?
This is for educational purposes only, not financial advice. Always manage your risk before entering any trade.
📚 Stick to your trading plan regarding entries, risk management, and trade execution.
Good luck!
All Strategies Are Good; If Managed Properly!
~Richard Nasr

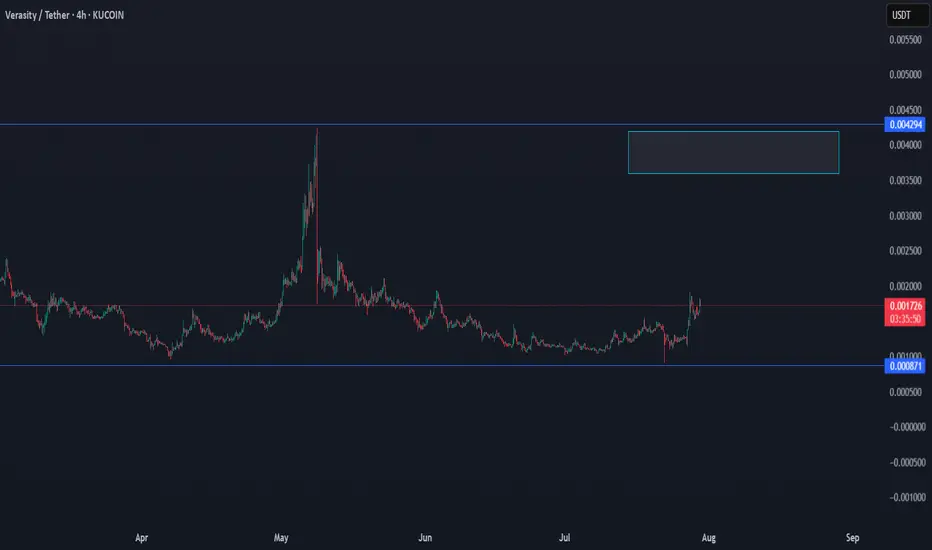
VRA/USDT THE RETURN TO KEY LEVELVra has good chance to return to the key level, since the last data shows a growth in the volume.
BTC NEW VOLUME TREND 122KThis is a small time frame update, where BTC can try to target 22K again in the coming time frames. Since the last 15H breakdown volume, BTC can enter new uptrend volume
From the box level, there is a good chance for a new uptrend.

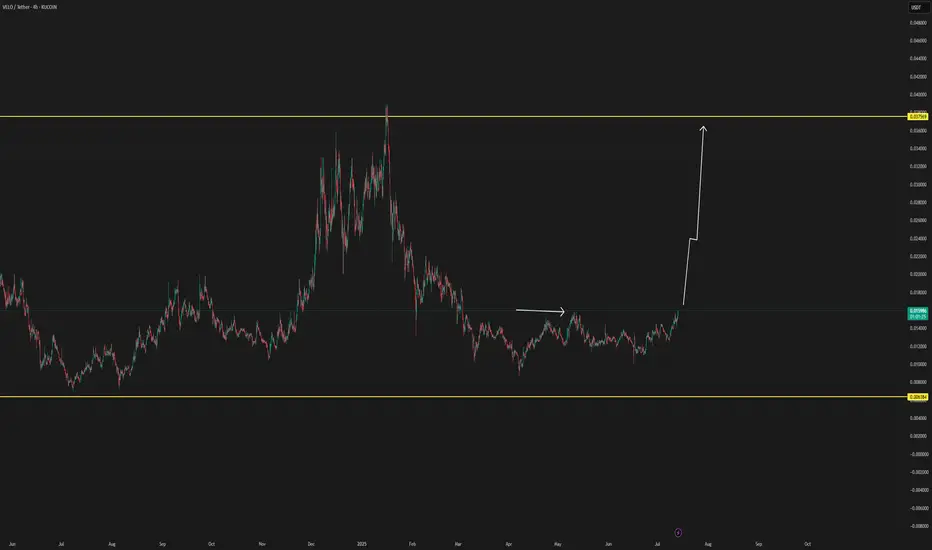
BREAK 2.0 upcoming for VELO/USDTVELO/USDT has high chance to break in the coming hours, more updates later when there is more confirmations below this update
Market SIGNALS SHOW THAT BTC CAN FALL TO 85K USDMarket follow-up study shows that there is a good chance BTC can fall to 85K in the coming time period. The market cycle seems to end the green trend and to enter a new red zone.
Time will show what really can happen with BTC.
The market can make a fake trend, with a trend fall on a high time frame.
The crash can also happen on the main markets.
This is not trading advice, trade always only depending on your plan.

BTC - New Impulse Soon!Hello TradingView Family / Fellow Traders. This is Richard, also known as theSignalyst.
📈 BTC has been bullish, trading within the rising channel marked in orange. 🟧
In a typical trend, corrections are usually bearish. 🔻
However, in BTC’s case, the correction phases marked in red are flat — a strong signal that the bulls are in control 💪 and not allowing the bears to trigger a classic pullback.
As long as BTC holds within the rising orange channel, we expect the next impulse phase to kick off soon 🚀 — aiming for the $115,000 round number. 🎯
This move will be confirmed once BTC breaks above the current flat correction zone marked in red. ✅
📚 Always follow your trading plan regarding entry, risk management, and trade management.
Good luck!
All Strategies Are Good; If Managed Properly!
~Rich

BTC - Bulls Charging... However!Hello TradingView Family / Fellow Traders. This is Richard, also known as theSignalyst.
As per our last analysis (attached on the chart), BTC rejected the blue trendline support and has been bullish in the medium term. 📈
However, the overall sentiment remains bearish, as BTC is still trading within the falling channel marked in red. 📉
For the bulls to take over long term and initiate the next impulsive wave, a break above the $91,000 major high in blue is needed. 🔵
Meanwhile, BTC may still retest the blue trendline — where we’ll be looking for new short-term longs. 🎯
📚 Always follow your trading plan regarding entry, risk management, and trade management.
Good luck!
All Strategies Are Good; If Managed Properly!
~Rich

BTC make or break zone!As per our last BTC analysis, it has been bullish this week, trading within the rising channel marked in red.
For the bulls to take over and start the next impulse toward the $95,000 round number, a break above the last major high at $87,400 is needed.
Meanwhile, if BTC breaks below the last major low marked in red at $81,200, further downside toward the $75,000 support would be expected.

BTC Correction Nearing Key Support – What’s Next?Bitcoin has been in a corrective phase over the past two days, retracing from recent highs and approaching critical support levels. Let’s break down the current market structure and identify potential trade opportunities based on confluences from multiple technical indicators.
Key Support and Resistance Levels:
1. ) Golden Pocket Zone – $95,535 to $94,994
The 0.618 Fibonacci retracement is a widely recognised level where strong reactions often occur.
This level aligns with a previous consolidation zone, making it a key demand area for potential long entries.
A bounce from here could indicate that bulls are regaining strength.
2.) Deeper Support – 0.786 Fib, Monthly Order Block, and Yearly Open (~$93,576)
If the golden pocket fails, the next key area of interest is around $93,576.
Here, we see confluence with:
The 0.786 Fibonacci retracement, often the last strong retracement before a reversal.
A monthly order block, which has previously acted as a strong support area.
The yearly open, a crucial psychological and technical level that often holds significance throughout the year.
3.) Next Major Support if Yearly Open Fails – $88,000 to $86,000 (Swing Low & Weekly Support Zone)
If price drops below the yearly open with confirmation of bearish momentum, I would look for the next buying opportunity at the swing low or weekly support zone, highlighted in the yellow box around $88,000 to $86,000.
This area holds strong confluence as a higher timeframe support level, making it an attractive zone for potential accumulation.
4.) Resistance Levels – Open Price and Psychological Barrier at $100K
$97,700 – This is the weekly open resistance level. If BTC struggles to reclaim this level, it could indicate further downside.
$100K – A major psychological resistance where sellers could step in. Breaking and holding above this level would be a strong bullish signal.
Trade Setups Based on Current Structure:
1.) Long Trade Setup – Golden Pocket Zone ($95,535 - $94,994)
Entry: Between $95,535 and $94,994 (Golden Pocket Zone)
Stop Loss: Below $93,500 to protect against further downside
Take Profit 1: $97,700 (weekly open resistance)
Take Profit 2: $100K (psychological resistance)
2.) Deeper Long Setup – If 0.618 Fib Fails ($93,576 - Yearly Open Zone)
Entry: Around $93,576 (0.786 Fib + Monthly Order Block + Yearly Open)
Stop Loss: Below $92,000
Take Profit 1: $97,700
Take Profit 2: $100K
3.) Alternative Long Setup – If Yearly Open Breaks ( FWB:88K - $86K Zone)
Entry: Around $88,000 to $86,000 (Weekly Support Zone)
Stop Loss: Below $85,000
Take Profit 1: $93,500 (yearly open retest)
Take Profit 2: $100K
Final Thoughts:
Bitcoin’s current structure suggests a healthy correction within a larger uptrend. The golden pocket ($95,535 - $94,994) remains a key level for potential long entries, while a failure to hold here could see price testing the $93,576 region. However, if price drops below the yearly open and confirms bearish momentum, the next major buying opportunity lies at the Swing Low or Weekly Support Zone at $88,000 - $86,000.
New Free Indicator – Multi Timeframe 8x MA Support Resistance Zones
I’ve just released a free indicator called Multi Timeframe 8x MA Support Resistance Zones, which is now live and ready to use! This indicator provides dynamic support and resistance zones based on multiple moving averages across different timeframes, helping you identify key areas for potential trade setups with better precision.
Feel free to check it out, give it a try, and let me know your feedback! 🚀

BTC is looking like more down, but a great buy opportunity Head and shoulders for BTC was invalidated recently leaving a short term play that looks like some more downside than up, for the very short term in any case. It looks like the green trend line was broken of late. Typically when there's a break, the price action comes back down to buffet on it for a short while before taking off agian. Let's see what happens, it looks like a great buying opportunity though. Cycles in green semi circles also pervail to there being more down than up to go. Follow and share for more.


BTC/USDT NEW ENTERY TO 65k+BTC has a signal long-term breakdown trend but is still able to make a new entry to 65K again since the trend still has not made the confirmation of the breakdown trend.
Can BTC have a new volume that will bring BTC to 65K again?
This is exactly what we will follow in the coming time frames.
The best studies are made with the moment live data follow.
At this moment the data shows there is a good possibility, to confirm this we should follow the trend with time since it can change.
The key is to change with the trend and to expect nothing from ourselves, only what the data shows.
The momentum data shows positive BTC from 59k

NEW UPTREND LOOKS IN PROCESSING FOR BTC - BACK 68K?BTC seems to have entered a new uptrend, which could be good news for most % altcoins.
BTC seems today to enter a new processing of uptrend which can be confirmed in the coming hours with a high chance back to 68K

BTC NEW INCREASE VOLUMEFor the low time frame BTC showing a positive trend which can allow BTC to break soon up 72K

BTC - Are You Ready?📈Hello TradingView Family / Fellow Traders. This is Richard, also known as theSignalyst.
📈 BTC has been overall bullish, trading within the rising channel in blue.
Currently, BTC is undergoing a correction phase and it is currently approaching the lower bound of the channel.
Moreover, it is retesting a structure in red.
🏹 Thus, the highlighted blue circle is a strong area to look for trend-following buy setups as it is the intersection of the red structure and lower blue trendline acting as a non-horizontal support.
📚 As per my trading style:
As #BTC approaches the blue circle zone, I will be looking for bullish reversal setups (like a double bottom pattern, trendline break , and so on...)
📚 Always follow your trading plan regarding entry, risk management, and trade management.
Good luck!
All Strategies Are Good; If Managed Properly!
~Rich

KAS NEW INCREASE VOLUMEDepending on the low time frame KAS shows new increase in volume trend which could be confirmed in the coming time frames.

BTC ON WAY TO 68KThis is a small time frame update with the possibility we are going to see BTC soon to $68
BTC should hold the 61K level with confirmation.
For day traders , BTC can change more times per day per time frame up and down.
This update is more for trend choice trend.
This update is a trend view and finance advice.

BTC DAILY UPDATE TIME FRAMEBTC NEW daily Time frame update.
BTC seems to enter a new green time frame trend for the low time frame.
This time frame expects shows for the low time frame green view for BTCUSD.
This is not a long-term view but a low-time frame daily view which could change when the trend gains a new range.
BTCUSDT changes with time frames UP and DOWN the key is to be consistent and to manage the risk for daily traders. There is no guarantee in the markets, in the end, the trend can go all sides. good study(system) and the right risk management give it an edge.

BIG PLAN about BTCAlthough it is thought that we have left the bear market and entered the bull market, BTC does not yet seem to have achieved its normal correction level at the required percentage.
When we examine the LP and OTH focused fib retracement ranges based on the Rising Wedge phenomenon related to the Bear Flag formation we are in, it becomes clear that the correction has not been fully realized.
Currently, our strongest support level appears to be the 50-week simple moving average, which runs parallel with the Rising Wedge support trend.
When SMA 50 breaks, we can expect a very deep decline.
