Bearish reversal off pullback resistance?GBP/JPY is rising towards the pivot and could reverse to the 1st support, which is a pullback support.
Pivot: 94,255.27
1st Support: 80,712.26
1st Resistance: 106,846.29
Disclaimer:
The opinions given above constitute general market commentary and do not constitute the opinion or advice of IC Markets or any form of personal or investment advice.
Any opinions, news, research, analyses, prices, other information, or links to third-party sites contained on this website are provided on an "as-is" basis, are intended to be informative only, and are not advice, a recommendation, research, a record of our trading prices, an offer of, or solicitation for, a transaction in any financial instrument and thus should not be treated as such. The information provided does not involve any specific investment objectives, financial situation, or needs of any specific person who may receive it. Please be aware that past performance is not a reliable indicator of future performance and/or results. Past performance or forward-looking scenarios based upon the reasonable beliefs of the third-party provider are not a guarantee of future performance. Actual results may differ materially from those anticipated in forward-looking or past performance statements. IC Markets makes no representation or warranty and assumes no liability as to the accuracy or completeness of the information provided, nor any loss arising from any investment based on a recommendation, forecast, or any information supplied by any third party
BTC-USD

BTCUSD H4 | Potential Bearish ReversalBased on the H4 chart analysis, we can see that the price has rejected off our sell entry level at 94,989.50, which is a pullback resistance that is slightly above the 50% Fibonacci retracement.
Our stop loss is set at 97,969.25, which is a pullback resistance, that is slightly above the 127.2% Fibonacci extension.
Our take profit is set at 89,857.71, which is a pullback support that aligns with the 50% Fibonacci retracement.
High Risk Investment Warning
Stratos Markets Limited (

Bullish bounce off for Bitcoin?The price has bounced off the pivot and could rise to the 1st resistance, which acts as a multi-swing high resistance.
Pivot: 87,847.82
1st Support: 86,753.29
1st Resistance: 90,258.97
Disclaimer:
The opinions given above constitute general market commentary and do not constitute the opinion or advice of IC Markets or any form of personal or investment advice.
Any opinions, news, research, analyses, prices, other information, or links to third-party sites contained on this website are provided on an "as-is" basis, are intended to be informative only, and are not advice, a recommendation, research, a record of our trading prices, an offer of, or solicitation for, a transaction in any financial instrument and thus should not be treated as such. The information provided does not involve any specific investment objectives, financial situation, or needs of any specific person who may receive it. Please be aware that past performance is not a reliable indicator of future performance and/or results. Past performance or forward-looking scenarios based upon the reasonable beliefs of the third-party provider are not a guarantee of future performance. Actual results may differ materially from those anticipated in forward-looking or past performance statements. IC Markets makes no representation or warranty and assumes no liability as to the accuracy or completeness of the information provided, nor any loss arising from any investment based on a recommendation, forecast, or any information supplied by any third party

BTCUSD H4 | Bullish BounceMomentum: Bearish
The price is falling towards the buy entry, which is a pullback support.
Buy entry: 87,553.62
Pullback support
Stop loss: 82,022.06
Swing low support
Take profit: 92,947.82
Pullback resistance
High Risk Investment Warning
Stratos Markets Limited (tradu.com/uk ), Stratos Europe Ltd (tradu.com/eu ):
CFDs are complex instruments and come with a high risk of losing money rapidly due to leverage. 70% of retail investor accounts lose money when trading CFDs with this provider. You should consider whether you understand how CFDs work and whether you can afford to take the high risk of losing your money.
Stratos Global LLC (tradu.com/en ): Losses can exceed deposits.
Please be advised that the information presented on TradingView is provided to Tradu (‘Company’, ‘we’) by a third-party provider (‘TFA Global Pte Ltd’). Please be reminded that you are solely responsible for the trading decisions on your account. Any information and/or content is intended entirely for research, educational and informational purposes only and does not constitute investment or consultation advice or investment strategy. The information is not tailored to the investment needs of any specific person and therefore does not involve a consideration of any of the investment objectives, financial situation or needs of any viewer that may receive it. Past performance is not a reliable indicator of future results. Actual results may differ materially from those anticipated in forward-looking or past performance statements. We assume no liability as to the accuracy or completeness of any of the information and/or content provided herein and the Company cannot be held responsible for any omission, mistake nor for any loss or damage including without limitation to any loss of profit which may arise from reliance on any information supplied by TFA Global Pte Ltd.

BTCUSD SELL SETUPPOSSIBLE SELL SETUP BTCUSD
SL ABOVE SUPPLY ZONE
TP 1 BELOW DEMAND ZONE
TP 2 OPEN USE PROPER RISK MANAGEMENT
FOLLOW YOUR TRADING PLAN !!!!
SIMPLE BTCUSD TRADING PLAN
1️⃣ Timeframe
15m or 1H only
2️⃣ Indicators
200 EMA → trend
50 EMA → entry
RSI (14) → confirmation
3️⃣ BUY RULES
✅ Price above 200 EMA
✅ Pullback to 50 EMA
✅ RSI above 50
✅ Bullish candle
➡️ Then BUY
4️⃣ SELL RULES
✅ Price below 200 EMA
✅ Pullback to 50 EMA
✅ RSI below 50
✅ Bearish candle
➡️ Then SELL
5️⃣ Risk Rules
Risk 1% per trade
Always use Stop Loss
Target = 2× Stop Loss (1:2)
6️⃣ Management
At 1:1, move stop to breakeven
Do nothing else
7️⃣ Golden Rules
❌ No stop loss = no trade
❌ No emotions
❌ No overtrading
ONE LINE RULE
If all rules aren’t met → NO TRADE

Bullish bounce off?BTC/USD has bounced off the pivot, which is a pullback support, and could rise to the 1st resistance.
Pivot: 85,215.19
1st Support: 83,544.88
1st Resistance: 89,917.16
Disclaimer:
The opinions given above constitute general market commentary and do not constitute the opinion or advice of IC Markets or any form of personal or investment advice.
Any opinions, news, research, analyses, prices, other information, or links to third-party sites contained on this website are provided on an "as-is" basis, are intended to be informative only, and are not advice, a recommendation, research, a record of our trading prices, an offer of, or solicitation for, a transaction in any financial instrument and thus should not be treated as such. The information provided does not involve any specific investment objectives, financial situation, or needs of any specific person who may receive it. Please be aware that past performance is not a reliable indicator of future performance and/or results. Past performance or forward-looking scenarios based upon the reasonable beliefs of the third-party provider are not a guarantee of future performance. Actual results may differ materially from those anticipated in forward-looking or past performance statements. IC Markets makes no representation or warranty and assumes no liability as to the accuracy or completeness of the information provided, nor any loss arising from any investment based on a recommendation, forecast, or any information supplied by any third party

BTCUSD H4 | Bearish ContinuationMomentum: Bearish
Price has rejected from the sell entry, which is acting as pullback resistance. It is also trading below the Ichimoku cloud, adding significant confluence and strength to this level.
Sell entry: 89,761.64
Pullback resistance
Stop loss: 94,934.32
Pullback resistance
Take profit: 82,105.45
Swing low support
High Risk Investment Warning
Stratos Markets Limited (tradu.com ), Stratos Europe Ltd (tradu.com ):
CFDs are complex instruments and come with a high risk of losing money rapidly due to leverage. 70% of retail investor accounts lose money when trading CFDs with this provider. You should consider whether you understand how CFDs work and whether you can afford to take the high risk of losing your money.
Stratos Global LLC (tradu.com ): Losses can exceed deposits.
Please be advised that the information presented on TradingView is provided to Tradu (‘Company’, ‘we’) by a third-party provider (‘TFA Global Pte Ltd’). Please be reminded that you are solely responsible for the trading decisions on your account. Any information and/or content is intended entirely for research, educational and informational purposes only and does not constitute investment or consultation advice or investment strategy. The information is not tailored to the investment needs of any specific person and therefore does not involve a consideration of any of the investment objectives, financial situation or needs of any viewer that may receive it. Past performance is not a reliable indicator of future results. Actual results may differ materially from those anticipated in forward-looking or past performance statements. We assume no liability as to the accuracy or completeness of any of the information and/or content provided herein and the Company cannot be held responsible for any omission, mistake nor for any loss or damage including without limitation to any loss of profit which may arise from reliance on any information supplied by TFA Global Pte Ltd.

BTCUSD - Down, DownBitcoin completed a corrective wave A and has resumed its downward move.
The decline is most likely heading toward the 80k area.
The move lower is expected to be choppy, so targets remain approximate.
Primary target: 80,500
Intermediate target: 86,100
---
Please subscribe and leave a comment.
You’ll get new information faster than anyone else.
---

BTCUSD H1 | Bullish Reversal SetupMomentum: Bearish
Price is currently falling towards the buy entry, which acts as a pullback support zone.
Buy Entry: 84,871.36
Pullback support
Stop Loss: 82,083.07
Swing-low support
Take Profit: 89,161.04
Pullback resistance
Slightly below the 61.8% Fibonacci retracement level
High Risk Investment Warning
Stratos Markets Limited (tradu.com ), Stratos Europe Ltd (tradu.com ):
CFDs are complex instruments and come with a high risk of losing money rapidly due to leverage. 70% of retail investor accounts lose money when trading CFDs with this provider. You should consider whether you understand how CFDs work and whether you can afford to take the high risk of losing your money.
Stratos Global LLC (tradu.com ): Losses can exceed deposits.
Please be advised that the information presented on TradingView is provided to Tradu (‘Company’, ‘we’) by a third-party provider (‘TFA Global Pte Ltd’). Please be reminded that you are solely responsible for the trading decisions on your account. Any information and/or content is intended entirely for research, educational and informational purposes only and does not constitute investment or consultation advice or investment strategy. The information is not tailored to the investment needs of any specific person and therefore does not involve a consideration of any of the investment objectives, financial situation or needs of any viewer that may receive it. Past performance is not a reliable indicator of future results. Actual results may differ materially from those anticipated in forward-looking or past performance statements. We assume no liability as to the accuracy or completeness of any of the information and/or content provided herein and the Company cannot be held responsible for any omission, mistake nor for any loss or damage including without limitation to any loss of profit which may arise from reliance on any information supplied by TFA Global Pte Ltd.

BTCUSD H4 | Bullish Bounce Off Pullback SupportMomentum: Bearish
The price is reacting off the buy entry, which is acting as pullback support.
Buy Entry: 92,439.84
Pullback support
Stop Loss: 89,010.49
Pullback support
50% Fibonacci retracement
Take Profit: 98,827.85
Pullback resistance
50% Fibonacci retracement
High Risk Investment Warning
Stratos Markets Limited (tradu.com ), Stratos Europe Ltd (tradu.com ):
CFDs are complex instruments and come with a high risk of losing money rapidly due to leverage. 70% of retail investor accounts lose money when trading CFDs with this provider. You should consider whether you understand how CFDs work and whether you can afford to take the high risk of losing your money.
Stratos Global LLC (tradu.com ): Losses can exceed deposits.
Please be advised that the information presented on TradingView is provided to Tradu (‘Company’, ‘we’) by a third-party provider (‘TFA Global Pte Ltd’). Please be reminded that you are solely responsible for the trading decisions on your account. Any information and/or content is intended entirely for research, educational and informational purposes only and does not constitute investment or consultation advice or investment strategy. The information is not tailored to the investment needs of any specific person and therefore does not involve a consideration of any of the investment objectives, financial situation or needs of any viewer that may receive it. Past performance is not a reliable indicator of future results. Actual results may differ materially from those anticipated in forward-looking or past performance statements. We assume no liability as to the accuracy or completeness of any of the information and/or content provided herein and the Company cannot be held responsible for any omission, mistake nor for any loss or damage including without limitation to any loss of profit which may arise from reliance on any information supplied by TFA Global Pte Ltd.

BTCUSD H4 | Bearish Drop OffMomentum: Bearish
The price has reacted off the sell entry, which acts as a pullback resistance.
Sell entry: 92,009.75
Pullback resistance
Stop loss: 94,934.32
Pullback resistance
Take profit: 84,615.55
Pullback support
High Risk Investment Warning
Stratos Markets Limited (tradu.com ), Stratos Europe Ltd (tradu.com ):
CFDs are complex instruments and come with a high risk of losing money rapidly due to leverage. 70% of retail investor accounts lose money when trading CFDs with this provider. You should consider whether you understand how CFDs work and whether you can afford to take the high risk of losing your money.
Stratos Global LLC (tradu.com ): Losses can exceed deposits.
Please be advised that the information presented on TradingView is provided to Tradu (‘Company’, ‘we’) by a third-party provider (‘TFA Global Pte Ltd’). Please be reminded that you are solely responsible for the trading decisions on your account. Any information and/or content is intended entirely for research, educational and informational purposes only and does not constitute investment or consultation advice or investment strategy. The information is not tailored to the investment needs of any specific person and therefore does not involve a consideration of any of the investment objectives, financial situation or needs of any viewer that may receive it. Past performance is not a reliable indicator of future results. Actual results may differ materially from those anticipated in forward-looking or past performance statements. We assume no liability as to the accuracy or completeness of any of the information and/or content provided herein and the Company cannot be held responsible for any omission, mistake nor for any loss or damage including without limitation to any loss of profit which may arise from reliance on any information supplied by TFA Global Pte Ltd.

THIS TESLA / BTC FRACTAL - IS A MAPThis is an expanded view of today's chart (posted earlier). I wanted to offer a broader context. On this "channel", I'm trying to focus on Tesla & related charts. Since I'm not posting anymore Tesla (single asset) charts, until a new all time high has been reached, I thought I would continue to pose questions in the meantime. Like "what is a fractal, mathematically?"...to encourage you to pull the curtain to the side and see the wizzard behind the curtain.
This isn't OZ, this is a digital casino, that has a casino agenda. If you don't know WHAT that is, and HOW that works, then should you really be investing your money. Until newbies figure that out & learn what is truly governing price action...I will try and provide some maps and share some of my *basic trading ideas with you. Most of all encourage you to educate yourselves and LEARN TA!
For those of you that have & will private message me with requests for shortcut secrets to success, I will ONLY say this.
1-Pick 1 asset
2-Start learning TA now, and apply it ONLY to your 1 asset
3-Study it's price action for 10,000 hrs (about 5 yrs full time)
4-Realize that the same patterns are repeating across all assets.
For those of you that are too busy or unmotivated to study:
If you dont want to work for your money, then how can you expect your money to work for you?
May the Trades be with you.

Bearish momentum to extend?Bitcoin (BTC/USD) is rising towards the pivot which acts as a pullback resistance and could reverse to the 1st support.
Pivot: 94,255.27
1st Support: 80,712.26
1st Resistance: 106,846.29
Disclaimer:
The opinions given above constitute general market commentary and do not constitute the opinion or advice of IC Markets or any form of personal or investment advice.
Any opinions, news, research, analyses, prices, other information, or links to third-party sites contained on this website are provided on an "as-is" basis, are intended to be informative only, and are not advice, a recommendation, research, a record of our trading prices, an offer of, or solicitation for, a transaction in any financial instrument and thus should not be treated as such. The information provided does not involve any specific investment objectives, financial situation, or needs of any specific person who may receive it. Please be aware that past performance is not a reliable indicator of future performance and/or results. Past performance or forward-looking scenarios based upon the reasonable beliefs of the third-party provider are not a guarantee of future performance. Actual results may differ materially from those anticipated in forward-looking or past performance statements. IC Markets makes no representation or warranty and assumes no liability as to the accuracy or completeness of the information provided, nor any loss arising from any investment based on a recommendation, forecast, or any information supplied by any third party.

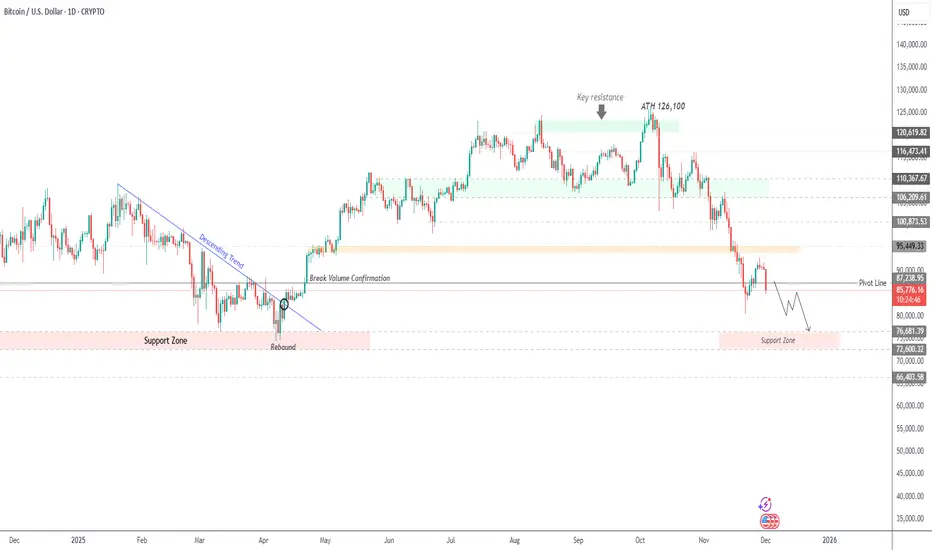
BITCOIN | Bearish Continuation Below 87,240Bitcoin – Technical Outlook
Bitcoin, the world’s largest cryptocurrency by market capitalization, extended its decline on Monday as broader risk-off sentiment weighed on the market at the start of December.
BTC dropped sharply to an intraday low of $85,595, marking its fourth consecutive day of losses since November 27. It was last seen trading near $85,842, down 5.88% over the past 24 hours.
Technical Analysis
Bitcoin continues to show strong bearish momentum, with the broader structure favoring continuation toward 76,680 and 72,600.
A sustained break below this zone would expose deeper downside targets toward 66,400.
The market has been in a clear downtrend from 87,240, with bearish pressure intact as long as price trades below this pivot level.
A recovery requires a decisive move back above resistance zones, but the current trend strongly favors sellers.
Pivot Line: 87,240
Support: 76,680 · 72,600 · 66,400
Resistance: 95,440 · 100,800
BTCUSD H4 | Potential Bullish ReversalMomentum: bearish
The price is falling towards the buy entry which acts as an overlap support.
Buy entry: 89,034.03
Overlap support
Stop loss: 81,966.16
Pullback support
Take profit: 104,866.08
Overlap resistance
Slightly above the 61.8% Fibonacci retracement
High Risk Investment Warning
Stratos Markets Limited (tradu.com ), Stratos Europe Ltd (tradu.com ):
CFDs are complex instruments and come with a high risk of losing money rapidly due to leverage. 70% of retail investor accounts lose money when trading CFDs with this provider. You should consider whether you understand how CFDs work and whether you can afford to take the high risk of losing your money.
Stratos Global LLC (tradu.com ): Losses can exceed deposits.
Please be advised that the information presented on TradingView is provided to Tradu (‘Company’, ‘we’) by a third-party provider (‘TFA Global Pte Ltd’). Please be reminded that you are solely responsible for the trading decisions on your account. Any information and/or content is intended entirely for research, educational and informational purposes only and does not constitute investment or consultation advice or investment strategy. The information is not tailored to the investment needs of any specific person and therefore does not involve a consideration of any of the investment objectives, financial situation or needs of any viewer that may receive it. Past performance is not a reliable indicator of future results. Actual results may differ materially from those anticipated in forward-looking or past performance statements. We assume no liability as to the accuracy or completeness of any of the information and/or content provided herein and the Company cannot be held responsible for any omission, mistake nor for any loss or damage including without limitation to any loss of profit which may arise from reliance on any information supplied by TFA Global Pte Ltd.

Bullish rise??Bitcoin (BTC/USD) has reacted off the pivot and could potentially rise to the 1st resistance.
Pivot: 89,628.69
1st Support: 86,150.76
1st Resistance: 96,168.75
Disclaimer:
The opinions given above constitute general market commentary and do not constitute the opinion or advice of IC Markets or any form of personal or investment advice.
Any opinions, news, research, analyses, prices, other information, or links to third-party sites contained on this website are provided on an "as-is" basis, are intended to be informative only, and are not advice, a recommendation, research, a record of our trading prices, an offer of, or solicitation for, a transaction in any financial instrument and thus should not be treated as such. The information provided does not involve any specific investment objectives, financial situation, or needs of any specific person who may receive it. Please be aware that past performance is not a reliable indicator of future performance and/or results. Past performance or forward-looking scenarios based upon the reasonable beliefs of the third-party provider are not a guarantee of future performance. Actual results may differ materially from those anticipated in forward-looking or past performance statements. IC Markets makes no representation or warranty and assumes no liability as to the accuracy or completeness of the information provided, nor any loss arising from any investment based on a recommendation, forecast, or any information supplied by any third party.

Bearish momentum to conninue?Bitcoin (BTC/USD) has rejected off the pivot which acts as a pullback resistance and could drop to the pullback support.
Pivot: 89,628.69
1st Support: 81,683.82
1st Resistance: 93,927.62
Disclaimer:
The opinions given above constitute general market commentary and do not constitute the opinion or advice of IC Markets or any form of personal or investment advice.
Any opinions, news, research, analyses, prices, other information, or links to third-party sites contained on this website are provided on an "as-is" basis, are intended to be informative only, and are not advice, a recommendation, research, a record of our trading prices, an offer of, or solicitation for, a transaction in any financial instrument and thus should not be treated as such. The information provided does not involve any specific investment objectives, financial situation, or needs of any specific person who may receive it. Please be aware that past performance is not a reliable indicator of future performance and/or results. Past performance or forward-looking scenarios based upon the reasonable beliefs of the third-party provider are not a guarantee of future performance. Actual results may differ materially from those anticipated in forward-looking or past performance statements. IC Markets makes no representation or warranty and assumes no liability as to the accuracy or completeness of the information provided, nor any loss arising from any investment based on a recommendation, forecast, or any information supplied by any third party.

Bitcoin 2026History doesn’t repeat like a record player — but it rhymes.
By tracking patterns critically (not fatalistically), we can:
1. Spot early warnings of past mistakes.
2. Identify where old models fail or not.
3. Make more informed choices about the future.
I'll make 12 updates ahead and we will find out how this patterns works in case of btc/usd.
Key Questions to Test Over 12 Months
Do halving cycles still drive price action, or has the market “priced it in”?
Does BTC is still just a “risk tech” (correlated with Nasdaq)?
Core Metrics to Track Monthly
a) Price & Volatility
BTC/USD closing price (monthly average).
30‑day volatility (standard deviation of daily returns).
Compare to past cycles (2013, 2017, 2021 peaks/bottoms).
b) On‑Chain Activity
Active addresses (network usage).
Exchange inflows/outflows (signaling accumulation vs. selling).
Hash rate (miner confidence).
c) Macroeconomic Context
U.S. inflation rate and Fed policy (interest rates, QT/QE).
Global liquidity conditions (M2 money supply, T‑bill yields).
Risk‑on/risk‑off sentiment (S&P 500, gold, USD index).
d) Regulatory & Adoption Shifts
New crypto regulations (U.S., EU, Asia).
Institutional adoption (spot ETF flows, corporate treasury allocations).
Tech updates (Bitcoin protocol changes, Lightning Network growth).
Meanwhile we will focus on charts.
The information and publications are not meant to be, and do not constitute, financial, investment, trading, or other types of advice or recommendations.

Bearish momentum to continue?Bitcoin (BTC/USD) is reacting off the pivot which is a pullback resistance and could reverse to the 1st support.
Pivot: 89,178.40
1st Support: 81,214.21
1st Resistance: 93,070.41
Disclaimer:
The opinions given above constitute general market commentary and do not constitute the opinion or advice of IC Markets or any form of personal or investment advice.
Any opinions, news, research, analyses, prices, other information, or links to third-party sites contained on this website are provided on an "as-is" basis, are intended to be informative only, and are not advice, a recommendation, research, a record of our trading prices, an offer of, or solicitation for, a transaction in any financial instrument and thus should not be treated as such. The information provided does not involve any specific investment objectives, financial situation, or needs of any specific person who may receive it. Please be aware that past performance is not a reliable indicator of future performance and/or results. Past performance or forward-looking scenarios based upon the reasonable beliefs of the third-party provider are not a guarantee of future performance. Actual results may differ materially from those anticipated in forward-looking or past performance statements. IC Markets makes no representation or warranty and assumes no liability as to the accuracy or completeness of the information provided, nor any loss arising from any investment based on a recommendation, forecast, or any information supplied by any third party.

Bitcoin Time-Channel CyclesYellow = 1064d expansion
Green = 658d mean node
Blue = 364d compression
This chart documents a repeating BTC time-channel structure built from prior cycle highs and lows. The goal here is not to force a price prediction, but to show that Bitcoin has been respecting a consistent rhythm in time and slope across multiple market regimes. When the previous major ATL is used as the anchor, the next macro expansion phase has repeatedly aligned with a ~1064-day duration. That expansion window is displayed as the larger corridor, and it has now shown up cleanly from the 2015 ATL into the 2017 ATH, from the 2018 ATL into the 2021 ATH, and again from the 2022 ATL into the 2025 ATH..
Inside each 1064-day expansion corridor, a secondary time node appears at roughly 658 days, which is the golden-ratio contraction of the full expansion cycle. What’s notable is that price has not been randomly positioned at this midpoint in time. Instead, it has repeatedly migrated back to the mean of the rising channel near the 658 day mark, acting like a structural equilibrium reset within the broader uptrend. This “mean hit” behavior is visible across cycles and is one of the main reasons to watch time geometry alongside price geometry. After the mean-hit, the market has historically rotated into the final leg of the expansion phase before completing the cycle high.
Following each macro high, the bearish compression phase has clustered around ~364 days, shown as the blue corridor. These reset windows are materially shorter than the expansion windows, which matches the observed tendency for bullish advances to build over years while bearish phases compress into faster, more volatile declines. The expansion to compression ratio is close to 3:1, reinforcing the idea that the market “inhales” slowly and “exhales” quickly in time. The important takeaway is that the model is not asking price to obey a specific number; it’s showing how price has behaved inside repeating time-based corridors, with the mean of the channel acting as a magnet around the 658 day node.
This framework is shared as a structural study, not a guarantee. Markets can mutate, and no historical symmetry is permanent. However, when a time-channel sequence repeats cleanly across multiple cycles, it becomes a useful way to frame expectation, especially for identifying where equilibrium touches and regime shifts are statistically more likely to occur. If this rhythm continues to hold, future cycle windows can be mapped the same way, with the emphasis placed on time-based decision zones and mean reactions rather than on any single price target.

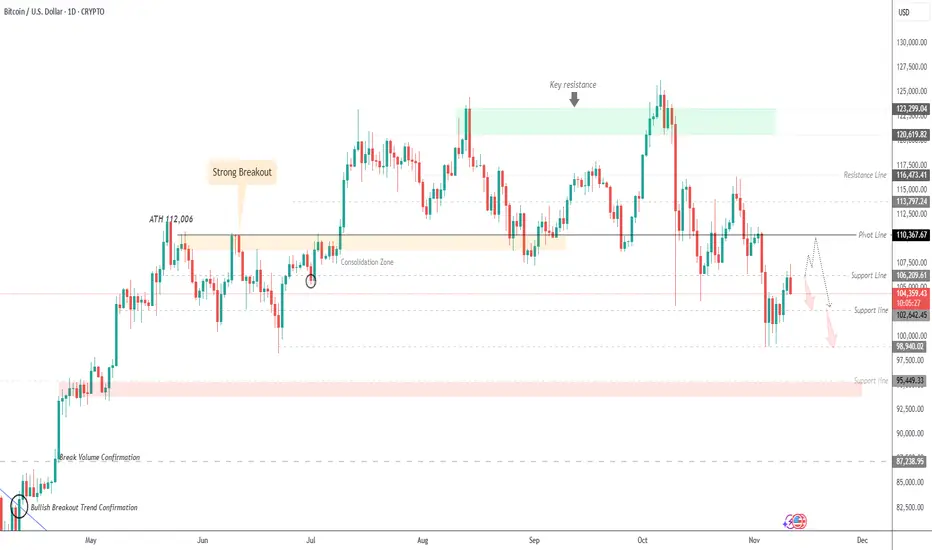
Geopolitical Shock Hits Bitcoin | Traders Eye 106.20K Key Level BITCOIN (BTCUSD) | Overview
China Accuses U.S. of Seizing $13B in Bitcoin as Tensions Escalate.
A long-running Bitcoin mystery from 2020 has resurfaced — this time involving a geopolitical twist.
China has accused the United States of secretly taking control of 127,000 stolen Bitcoins, valued at roughly $13 billion, in what could become one of the most controversial crypto disputes to date.
The allegation has added fresh strain to the already tense relationship between the two largest global powers, fueling uncertainty in both crypto and broader risk markets.
Technically:
Bitcoin shows signs of bearish momentum, with price action likely to retest 102.64K.
A confirmed break below this level could extend the decline toward 98.94K and 95.50K.
However, if the price closes a daily candle above 106.20K, it would signal renewed bullish momentum, targeting 110.36K, and potentially 113.80K on further strength.
Pivot Line: 106.20K
Resistance: 110.36K · 113.80K · 116.40K
Support: 102.64K · 98.95K · 95.50K
Outlook:
Bitcoin remains bearish while below 106.20K, with downside potential toward 102.64K – 98.95K.
A confirmed daily close above 106.20K would shift momentum to bullish, opening the way toward 110.36K – 113.80K
previous idea:
Could the bearish momentum continue?Bitcoin (BTC/USD) is rising towards the pivot, which is a pullback resistance and could reverse to the 1st support which acts as a pullback support.
Pivot: 99,744.03
1st Support: 88,246.12
1st Resistance: 107,447.45
Disclaimer:
The opinions given above constitute general market commentary and do not constitute the opinion or advice of IC Markets or any form of personal or investment advice.
Any opinions, news, research, analyses, prices, other information, or links to third-party sites contained on this website are provided on an "as-is" basis, are intended to be informative only, and are not advice, a recommendation, research, a record of our trading prices, an offer of, or solicitation for, a transaction in any financial instrument and thus should not be treated as such. The information provided does not involve any specific investment objectives, financial situation, or needs of any specific person who may receive it. Please be aware that past performance is not a reliable indicator of future performance and/or results. Past performance or forward-looking scenarios based upon the reasonable beliefs of the third-party provider are not a guarantee of future performance. Actual results may differ materially from those anticipated in forward-looking or past performance statements. IC Markets makes no representation or warranty and assumes no liability as to the accuracy or completeness of the information provided, nor any loss arising from any investment based on a recommendation, forecast, or any information supplied by any third party.

BTCUSD H1 | Bearish Continuation SetupMomentum: Bearish
The price has rejected the sell-entry zone, confirming it as a valid pullback resistance level.
Sell Entry: 99,535.24
Pullback resistance
Stop Loss: 101,191.20
Pullback resistance
Take Profit: 94,301.22
Pullback support
100% Fibonacci projection
High Risk Investment Warning
Stratos Markets Limited (tradu.com ), Stratos Europe Ltd (tradu.com ):
CFDs are complex instruments and come with a high risk of losing money rapidly due to leverage. 70% of retail investor accounts lose money when trading CFDs with this provider. You should consider whether you understand how CFDs work and whether you can afford to take the high risk of losing your money.
Stratos Global LLC (tradu.com ): Losses can exceed deposits.
Please be advised that the information presented on TradingView is provided to Tradu (‘Company’, ‘we’) by a third-party provider (‘TFA Global Pte Ltd’). Please be reminded that you are solely responsible for the trading decisions on your account. Any information and/or content is intended entirely for research, educational and informational purposes only and does not constitute investment or consultation advice or investment strategy. The information is not tailored to the investment needs of any specific person and therefore does not involve a consideration of any of the investment objectives, financial situation or needs of any viewer that may receive it. Past performance is not a reliable indicator of future results. Actual results may differ materially from those anticipated in forward-looking or past performance statements. We assume no liability as to the accuracy or completeness of any of the information and/or content provided herein and the Company cannot be held responsible for any omission, mistake nor for any loss or damage including without limitation to any loss of profit which may arise from reliance on any information supplied by TFA Global Pte Ltd.
