BTC 1H Analysis – Key Triggers Ahead | Day 6💀 Hey , how's it going ? Come over here — Satoshi got something for you !
⏰ We’re analyzing BTC on the 1-hour timeframe .
👀 On the 1-hour timeframe, Bitcoin rebounded from $114,200 after heavy whale buying. It broke through the $115,530 zone and moved toward its resistance at $117,600, but was rejected twice by strong seller tickers in that area. It is now moving toward its current support levels .
🎮 Key Fibonacci zones to watch are the 0.5 and 0 levels. A breakout of these areas can trigger potential long or short entries, making them valuable as breakout triggers .
⚙️ The important RSI pivot level is 44.87; losing this level could lead to a further correction .
🕯 Trading volume and transaction count are rising, suggesting the possibility of another “Bitcoin season.” Large institutions have been buying at the lows, increasing their positions each time. ETF data has turned highly positive, indicating strong recovery potential and attracting more risk capital .
🔔 There are two alert zones: one at $117,500 and another at $116,000. Setting alerts here can help you better track price behavior .
📊 USDT.D has broken above its range box , A break of the current zone could allow Bitcoin to push higher .
🖥 Summary : After its recent pump, Bitcoin is facing resistance from seller tickers and is trying to break through this zone. As long as BTC stays above $116,000, there is potential for another attempt to set a new high .
❤️ Disclaimer : This analysis is purely based on my personal opinion and I only trade if the stated triggers are activated .
Btc2

Small MC crypto BTC2.0 Swing Trade $BTC2Potential opportunity for a nice swing trade at approximately $0.65. The stock seems to be forming a Cup and Handle pattern, which is a classic technical analysis formation. In a Cup and Handle, the price chart resembles the shape of a tea cup with a handle. It's considered a bullish continuation pattern, suggesting that after a previous uptrend, there might be a consolidation (the 'cup') followed by a smaller pullback (the 'handle') before another potential upward movement.
This pattern often indicates a period of accumulation and can be a signal for a potential bullish trend. Keep an eye on the developments, and if everything aligns, it could be a great chance for a profitable short-term trade. Enjoy exploring the possibilities in the market, and happy trading, lads!

BTC 2.0 PREDECTION From $0,10 TO NEW ATH $1.59 - 2023Thank you for taking the time to review our update. It's essential to emphasize that the following information is not intended as trading advice,
The max supply same as BTC 21M and the TA trends will make this coin able to break .
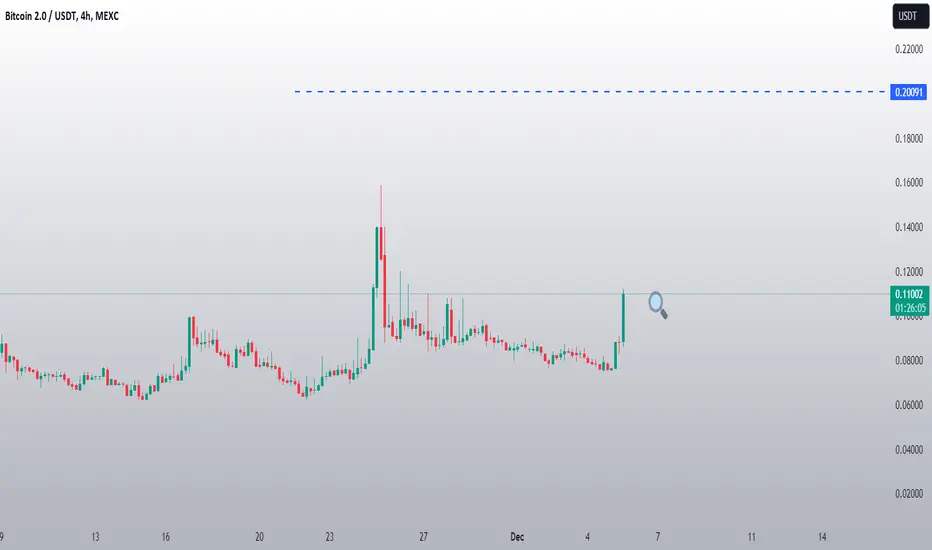
BTC 2.0 demonstrating significant changes in trading volume, representing a new cryptocurrency with inherent high-risk However, if BTC 2.0 manages to sustain a value of $0.08 or higher, there is the potential for upward momentum and a potential break on low time frame.
We expect that BTC 2.0 is able to gain from the target $0,10 to $1.59 in 2023
Our low time frame with the first TARGET $0,20 and main update.
#Nottradingadvice
#For day traders take always profits when market increase

NEW VOLUME BREAK FOR BTC2-USDTThank you for reading this update.
Depending on our new study we see that BTC2 has a good chance of volume increase.
This updates depending on day trade, And the market should confirm with time the right market way.
There is more coins that are increasing on the same time frame, but BTC2 seems to make new range with the possiblity of new break.
#Nottradingadvice
#For day traders take always profits when market increase
#Expect noting from the markets, but follow what it shows.