Bitcoin at Key Support – Correction Complete or Another Drop!?Bitcoin( BINANCE:BTCUSDT ) has continued its correction in recent days due to the following key reasons:
1. U.S. Government Shutdown Risk: Political deadlock over the federal budget deadline (January 30) has triggered a "risk-off" sentiment in global markets, pushing investors away from volatile assets like Bitcoin.
2. Trade Tensions and Tariff Threats: Trump's threats of 100% tariffs on Canadian imports have strengthened the U.S. dollar ( TVC:DXY DXY), acting as a headwind for Bitcoin and contributing to broader market declines.
3. ETF Outflows and Market Fundamentals: Net outflows of about $6.1B from Bitcoin spot ETFs over the past three months, combined with on-chain realized losses for holders and leveraged position liquidations, have intensified selling pressure.
4. Geopolitical Tensions in the Middle East: Escalating conflicts, including risks around Iran and oil( FX_IDC:USDBRO ) supply disruptions, have amplified global uncertainty and risk aversion, leading to further sell-offs in cryptocurrencies as investors seek safer assets.
Let’s dive into the technical analysis of Bitcoin on the 1-hour timeframe to see how it’s performing. Stay tuned!
As I expected in the previous idea , Bitcoin followed the anticipated bullish and bearish movements, reaching its targets (Targets Done).
Currently, Bitcoin is moving near a support zone($86,420-$83,820) and has also created a new CME Gap($89,205-$88,385) with the start of this trading week.
From an Elliott Wave perspective, it appears that Bitcoin has completed its main wave 5 near the support zone($86,420-$83,820) and support line, so we can now expect a corrective wave.
Additionally, we can observe a negative Regular Divergence (RD-) between two consecutive valleys.
I expect that after a correction, Bitcoin will resume its upward movement and potentially reach the first target of $88,667. With strong bullish momentum, we could see Bitcoin move even higher in the short term.
Note: Bitcoin, like other dollar-denominated assets, is influenced by various factors, including political statements and news. Therefore, it’s crucial to manage risk carefully and stay prepared for any scenario. Make sure to keep an eye on updates.
I’d love to hear your thoughts on Bitcoin. Do you think the downward trend will persist, and how far do you expect it to drop?
First Target: $88,667
Second Target: $89,401
Third Target: $90,231
Stop Loss(SL): $85,527(Worst)
Cumulative Long Liquidation Leverage: $86,450-$85,600
Cumulative Short Liquidation Leverage: $88,890-$88,400
💡 Please respect each other's opinions and express agreement or disagreement politely.
📌Bitcoin Analysis (BTCUSDT), 1-hour time frame.
🛑 Always set a Stop Loss(SL) for every position you open.
✅ This is just my idea; I’d love to see your thoughts too!
🔥 If you find it helpful, please BOOST this post and share it with your friends.
Btcanalysis

BTC Forecast Update – January 14, 2026 (EN - 26.01.2026)Good day, folks!
As promised, here is my updated view of the market.
Daily-chart snapshot
The range-bound phase is over: buyers have accumulated positions and launched an attack.
What I expect next
• After a breakout and solid close above USD 98 400, I’m looking for a three-week accumulation cycle. During this pause, longs will partially take profit while re-loading for the next push toward USD 113 500.
• A decisive assault on the USD 122 500 target is very likely.
• Based on the likely news flow, speculative positions will probably be trimmed by autumn, opening the door to a deep year-end correction.
• Longer-term, I still see an objective at USD 103 400.
Tactics right now
Today’s spike will almost certainly stall around the current level. This is an ideal zone to lock in gains and watch from the sidelines until fresh confirmation appears.
My broader stance on BTC and rates was laid out in earlier posts on dominance—see the linked ideas.
What I love about markets (and math) as a die-hard techie is their cyclicality. That’s exactly what we’re witnessing on this chart.
Key check-in dates: late February, late May, July–August.
P.S. English translation of my 14-Jan-2026 outlook.
NFA. DYOR.
#BTC #SinnSeed
As of 26 Jan 2026, the targets remain unchange

“Bitcoin 4H – Market Structure Shift and High-Probability Reacti1. Market Structure Overview
Higher-timeframe context:
BTC previously made a bullish BOS (break of structure) from the left, driving price aggressively into the 97k supply area.
At the top:
Price formed a distribution range (yellow box) with:
Multiple rejections at highs
Bearish CHoCH / PCHSE → early signal of trend weakness
This confirms a local trend reversal from bullish → bearish.
2. Breakdown & Momentum Shift
The sharp red move is a decisive bearish displacement, not a pullback.
Key signs:
Clean break below range low
No immediate bullish reaction
Bearish candles with follow-through
This validates the bearish BOS and shifts short-term control to sellers.
3. Liquidity & Support Zone (Yellow Area)
The support zone ~90,000–88,800 is critical:
Prior demand
Equal lows / resting liquidity
Previous bullish CHoCH area
Price is currently sweeping liquidity into this zone, which is healthy for a bounce if buyers defend it.
4. Target & Retracement Logic
Current idea illustrated on chart:
Down → Sweep liquidity → Retrace
Expected reaction:
Bounce from 88.8k–90k
Retracement toward 93.3k–94k (target point marked)
That target aligns with:
Prior support → resistance flip
4H imbalance / inefficiency
Logical bearish mitigation zone
5. Bullish vs Bearish Scenarios
🔵 Bullish Reaction (Counter-trend)
Valid only if:
Strong reaction from 88.8k–90k
Bullish displacement + CHoCH on lower TF (15m–1H)
Target: 93k–94.6k
This would be a relief rally, not trend reversal.
🔴 Bearish Continuation (Higher Probability)
If:
Support fails cleanly
No impulsive bullish response
Then next downside liquidity sits around:
87.5k
Possibly 85k if panic expands
6. Key Levels to Watch
Level
Significance
97k
Major HTF supply
94.6k–93.3k
Retracement / short entry zone
90k–88.8k
Critical demand & liquidity
87.5k
Next downside magnet
7. Bias Summary
HTF bias: Bearish
Current phase: Liquidity sweep into demand
Best trade ideas:
Short on retracement into 93–94k
Cautious long scalp only if structure flips at suppor1. Market Structure Overview
Higher-timeframe context:
BTC previously made a bullish BOS (break of structure) from the left, driving price aggressively into the 97k supply area.
At the top:
Price formed a distribution range (yellow box) with:
Multiple rejections at highs
Bearish CHoCH / PCHSE → early signal of trend weakness
This confirms a local trend reversal from bullish → bearish.
2. Breakdown & Momentum Shift
The sharp red move is a decisive bearish displacement, not a pullback.
Key signs:
Clean break below range low
No immediate bullish reaction
Bearish candles with follow-through
This validates the bearish BOS and shifts short-term control to sellers.
3. Liquidity & Support Zone (Yellow Area)
The support zone ~90,000–88,800 is critical:
Prior demand
Equal lows / resting liquidity
Previous bullish CHoCH area
Price is currently sweeping liquidity into this zone, which is healthy for a bounce if buyers defend it.
4. Target & Retracement Logic
Current idea illustrated on chart:
Down → Sweep liquidity → Retrace
Expected reaction:
Bounce from 88.8k–90k
Retracement toward 93.3k–94k (target point marked)
That target aligns with:
Prior support → resistance flip
4H imbalance / inefficiency
Logical bearish mitigation zone
5. Bullish vs Bearish Scenarios
🔵 Bullish Reaction (Counter-trend)
Valid only if:
Strong reaction from 88.8k–90k
Bullish displacement + CHoCH on lower TF (15m–1H)
Target: 93k–94.6k
This would be a relief rally, not trend reversal.
🔴 Bearish Continuation (Higher Probability)
If:
Support fails cleanly
No impulsive bullish response
Then next downside liquidity sits around:
87.5k
Possibly 85k if panic expands
6. Key Levels to Watch
Level
Significance
97k
Major HTF supply
94.6k–93.3k
Retracement / short entry zone
90k–88.8k
Critical demand & liquidity
87.5k
Next downside magnet
7. Bias Summary
HTF bias: Bearish
Current phase: Liquidity sweep into demand
Best trade ideas:
Short on retracement into 93–94k
Cautious long scalp only if structure flips at suppor

Bitcoin Hits PRZ — Short-Term Reversal in PlayBitcoin( BINANCE:BTCUSDT ), as I expected in the previous idea , continued its bearish trend and reached its target (full target).
Currently, Bitcoin is approaching a support zone ($90,590-$89,310) and is within the Potential Reversal Zone (PRZ) , near the Cumulative Long Liquidation Leverage($89,920-$88,760) and the support line.
From an Elliott Wave perspective, it seems that Bitcoin is completing wave 5, and this wave 5 may conclude within the Potential Reversal Zone (PRZ) .
Additionally, we can observe a positive Regular Divergence between(RD+) two consecutive valleys, indicating potential bullish momentum.
I expect that Bitcoin will experience a short-term bullish move and potentially rise at least to the $91,597. This upward movement could act as a pullback to the broken support lines.
First Target: $91,597
Second Target: Cumulative Short Liquidation Leverage($92,630-$91,988)
Stop Loss(SL): $89,117(Worst)
New CME gap: $93,060-$92,940
CME gap: $88,720-$88,120
Cumulative Short Liquidation Leverage: $94,389-$93,325
What’s your view on Bitcoin?
💡 Please respect each other's opinions and express agreement or disagreement politely.
📌Bitcoin Analysis (BTCUSDT), 1-hour time frame.
🛑 Always set a Stop Loss(SL) for every position you open.
✅ This is just my idea; I’d love to see your thoughts too!
🔥 If you find it helpful, please BOOST this post and share it with your friends.

Bitcoin Drops as Trade War & Geopolitical Risks EscalateBitcoin( BINANCE:BTCUSDT ), as I expected in the previous idea , has moved as anticipated and reached its first target (full target).
Currently, after a fake breakout above the resistance zone($94,970-$92,910), Bitcoin has fallen back below it, and this decline has come with strong momentum.
The reasons behind Bitcoin’s recent drop include concerns about a trade war between the U.S. and Europe, particularly threats from Trump imposing new tariffs on Europe over Greenland. Another factor is the potential escalation of tensions in the Middle East, which can make investors more cautious about high-risk assets.
Additionally, the recent global market declines, including the drop in indices like the S&P 500 index( FX:SPX500 ), which I had predicted , have also contributed to the bearish sentiment.
Furthermore, delays in the passing of the CLARITY Act in the U.S. and Coinbase’s withdrawal of support have added a negative sentiment to the crypto market.
From an Elliott Wave perspective, it seems that Bitcoin is currently completing wave 4, and we should expect a potential move toward the support lines. There is also a possibility that wave 5 may be truncated due to the strong momentum of wave 3.
I expect Bitcoin to decline from the Potential Reversal Zone(PRZ) and move toward the support lines.
Cumulative Long Liquidation Leverage: $91,720-$91,200
Cumulative Long Liquidation Leverage: $89,920-$88,760
Cumulative Short Liquidation Leverage: $96,340,125-$96,020
Cumulative Short Liquidation Leverage: $94,360-$93,300
First Target: Support lines
Second Target: $91,833
Third Target: Potential Reversal Zone(PRZ)
Stop Loss(SL): $94,433(Worst)
CME gap: $88,720-$88,120
What’s your view on Bitcoin?
💡 Please respect each other's opinions and express agreement or disagreement politely.
📌Bitcoin Analysis (BTCUSDT), 1-hour time frame.
🛑 Always set a Stop Loss(SL) for every position you open.
✅ This is just my idea; I’d love to see your thoughts too!
🔥 If you find it helpful, please BOOST this post and share it with your friends.

Bitcoin Enters Greed at Major Resistance—Bull Trap or Breakout!?Bitcoin ( BINANCE:BTCUSDT ) is currently trading near a key resistance zone($102,000-$97,900), overlapping with a Potential Reversal Zone (PRZ) and the 100_SMA(Daily), which makes this area technically sensitive.
The Bitcoin Fear & Greed Index has finally entered the Greed zone after several weeks, suggesting improving sentiment—but also raising caution from a contrarian perspective.
Bitcoin appears to be attempting a breakout above the $95,000 level, which is a major psychological and technical trading zone. However, this breakout has not been supported by strong volume, which weakens its reliability.
From an Elliott Wave perspective, Bitcoin seems to be in the final stages of completing the main Wave C. The internal structure of this Wave C resembles an Expanding Ending Diagonal, a pattern that often appears near the end of corrective or terminal moves.
One of the main external risks for Bitcoin and other risk-on assets is the potential escalation of geopolitical tensions in the Middle East, which could intensify in the coming days and increase market volatility.
As long as Bitcoin fails to stabilize and hold above the $102,000 level, there is still a strong possibility that the recent rally over the past few weeks is corrective in nature, rather than the start of a new impulsive uptrend. In that case, Bitcoin could resume a deeper pullback.
First Target: $94,023
Second Target: Cumulative Long Liquidation Leverage: $93,520-$92,580
Stop Loss(SL): $100,823/$102,143(Worst)
CME gap: $94,790-$94,415
CME gap: $88,720-$88,120
Cumulative Long Liquidation Leverage: $87,125-$86,000
What’s your view on Bitcoin?
Has Bitcoin already started a new bullish trend, or should we still expect another corrective move?
💡 Please respect each other's opinions and express agreement or disagreement politely.
📌Bitcoin Analysis (BTCUSDT), Daily time frame.
🛑 Always set a Stop Loss(SL) for every position you open.
✅ This is just my idea; I’d love to see your thoughts too!
🔥 If you find it helpful, please BOOST this post and share it with your friends.

BTC Daily AnalysisBased on Ichimoku data, there are two levels (81987 and 103633). it shows tendency to move toward 103633. When price breaks one of these levels, the analysis will be updated.

“BTC/USD: Structure Shift From Accumulation to Expansion”Market Structure
Overall structure:
After a sharp sell-off from the prior highs (left side), Bitcoin has transitioned into a range / accumulation phase, then recently broke upward from consolidation.
The series of higher lows marked by the black arrows suggests bullish structure building since late December.
2. Key Zones
🔴 Resistance Zone (≈ 100k – 104k)
This is a major supply zone where price was aggressively rejected before.
Strong selling pressure previously entered here → expect:
First test = rejection likely
Multiple tests = higher chance of breakout
The dotted mid-line inside the zone is a reaction level, not a clean breakout area.
🟡 Support Zone (≈ 88k – 90k)
Former resistance → now acting as support (role reversal).
Price recently:
Broke above it
Pulled back
Held → bullish confirmation
This zone is critical for maintaining the bullish bias.
3. Current Price Action
Price pushed impulsively to ~96–97k (strong bullish momentum).
The purple path suggests a healthy pullback:
This would likely be a bullish retracement, not weakness.
As long as price holds above the support zone, the trend remains intact.
4. Likely Scenarios
✅ Bullish Continuation (Higher Probability)
Pullback into 90k–92k
Buyers step in (bullish candle / volume)
Push toward 100k+
Possible:
First rejection
Then consolidation
Break into resistance zone
📈 Target: 100k – 104k
⚠️ Bearish / Invalid Scenario
Clean 4H close below ~88k
Would indicate:
Failed breakout
Return to range
That could open downside toward 85k–82k
5. Momentum & Volatility Insight
The smooth blue curves indicate volatility compression → expansion.
Expansion happened upward → bias remains bullish until structure breaks.
Sharp moves followed by shallow pullbacks = trend strength, not exhaustion (yet).
6. Trading Takeaway (Not Financial Advice)
Bias: Bullish while above support
Best risk area: Support retest (90k zone)
Worst place to enter: Mid-range (95k–97k)
Key decision point: Reaction at 100k resistance

BTC Intraday – Context UpdateAfter yesterday's decline, the price is now trading at 91,150.
From here, I am watching for a potential continuation of the decline to 90,300-90,000, where there is a zone of strong reaction.
This zone will be key:
-No buyer reaction and pressure → the decline may continue.
-Buyer acceptance and reaction → potential intraday long context, only with confirmation.
At this stage, this is a contextual reflection, not a signal to execute.
Bias follows structure — execution follows confirmation.
Stay tuned for updates as the structure develops.

Bitcoin — Bearish Bias Intact as Price Pressures Interim SupportAs explained in my previous analyses, my medium-term bias on Bitcoin remains bearish, with 75k as the minimum zone I expect to be reached before any meaningful and sustainable bullish reversal can take place.
Looking at the chart:
- After the drop to November lows toward 80k, BTC once again entered a consolidation phase
- This range has been capped by a clear resistance zone around 95k
- Following the latest rejection from that resistance, price rolled over and is now trading just above the interim support area at 89,500–90,000
This puts the market at an important decision point.
⚖️ Two Medium-Term Bearish Scenarios
At this stage, I am working with two possible paths, both ultimately pointing toward the same downside objective.
1️⃣ Support Holds — Final Push Before Deeper Drop
- Bulls manage to defend the 89.5k–90k support
- A corrective rebound follows
- Price could even push above 100k
- This move would, in my view, represent a final distribution phase
➡️ followed by a broader decline toward the 75k target zone
2️⃣ Support Breaks — Direct Continuation Lower
A clean break below the interim support
This would significantly increase the probability of
➡️ a direct move lower toward 75k, without another major upside attempt
📌 Bottom Line
Until price proves otherwise, I remain bearish on BTC.
The market is currently sitting at a level where structure, not opinion, will decide the next move. Whichever scenario plays out, risk management and patience remain key. 🚀

Bitcoin / U.S. Dollar (BTCUSD) – Bullish Pullback into Demand ZoMarket Structure
Primary trend: Bullish
Price previously moved inside a well-defined ascending channel, forming higher highs and higher lows.
The recent move down is a pullback, not a confirmed trend reversal.
📉 Current Price Action
Price has broken below the ascending channel, signaling short-term bearish momentum.
The pullback is now entering a major demand zone (red shaded area).
This zone previously acted as:
Accumulation
Base for impulsive bullish move
Liquidity absorption area
🟥 Demand / Support Zone
Key demand: ~86,600 – 88,100
This is a high-probability reaction zone.
Buyers are expected to defend this area strongly.
🟩 Resistance / Upside Target
Target area: ~94,400 – 94,500
This aligns with:
Prior swing high
Liquidity resting above equal highs
Your marked TARGET POINT
📊 Trade Setup (As Drawn)
Bias: Buy from demand
Entry zone: 86,600 – 88,100
Stop loss: Below ~86,500
Take profit: 94,400+
Risk–Reward: Very favorable (≈ 1:3)
⚠️ Invalidation
A strong close below ~86,500 would:
Break bullish market structure
Turn demand into resistance
Open downside toward 84,000 – 82,000
🧠 Summary
✔ Bullish trend intact
✔ Pullback into HTF demand
✔ Liquidity target above highs
❗ Wait for bullish confirmation (engulfing / pin bar / BOS) before entry

Bitcoin Roadmap — Short-Term Bounce Before ContinuationAs I expected in the previous idea , Bitcoin ( BINANCE:BTCUSDT ) started to decline from the upper line of the ascending channel and reached its targets (full target).
Bitcoin is currently near the support zone($90,960-$89,220) around the lower line of the ascending channel and the Cumulative Long Liquidation Leverage($89,125-$88,670).
From an Elliott Wave perspective, it appears that Bitcoin has completed a zigzag corrective pattern at the top of the ascending channel, and we should now expect a corrective wave. However, this corrective wave might still include a temporary upward movement.
Considering the increasing tensions in global affairs, especially between Russia and the U.S. in recent hours, and the conditions of the S&P 500 index ( FX:SPX500 ), we can still expect a bearish trend for Bitcoin.
I expect that after a short-term bullish movement in the coming hours, Bitcoin will once again begin to decline. This decline could involve breaking the lower line of the ascending channel, the support zone, and filling the CME gap($88,720-$88,120).
We can first look for a long position, and if we find a trigger, we can take a short position.
What do you think about Bitcoin in the short term? I’d love to hear your thoughts!
Cumulative Long Liquidation Leverage: $87,125-$86,000
Cumulative Short Liquidation Leverage: $92,620-$92,040
Cumulative Short Liquidation Leverage: $94,630-$93,920
Cumulative Short Liquidation Leverage: $98,480-$96,970
💡 Please respect each other's opinions and express agreement or disagreement politely.
📌Bitcoin Analysis (BTCUSDT), 1-hour time frame.
🛑 Always set a Stop Loss(SL) for every position you open.
✅ This is just my idea; I’d love to see your thoughts too!
🔥 If you find it helpful, please BOOST this post and share it with your friends.

BTC Analysis: Rising Channel Resistance & Volume Divergence
1. Reaching Ascending Channel Resistance
Looking at the turquoise Ascending Channel on the chart, the current price has reached the top of the channel (resistance line).
In technical analysis, the upper boundary of an ascending channel acts as a strong resistance zone. Unless there is a strong breakout (overshoot), the price tends to revert to the channel's median or bottom. Therefore, selling pressure (profit-taking) is likely to dominate in this area.
2. Bearish Volume Divergence
The most critical signal is indicated by the white arrow on the volume indicator.
Phenomenon: The price continues to make Higher Highs, but the volume is making Lower Lows.
Implication: This is a classic 'Bearish Divergence' signal, indicating that the buying momentum driving the rise is becoming exhausted. It suggests a lack of "fuel" to sustain the rally, meaning a trend reversal is highly probable in the near term.
3. Volume Profile & Support Retest Required
Pay attention to the gray Volume Profile on the left and the yellow box.
POC (Point of Control) Reversion: The longest bar in the volume profile (white line, approx. 87.8k) represents the 'High Volume Node' where trading was most active. Due to the rapid price increase, it is highly likely that the price will retrace to this zone to fill the low-volume areas and retest support.
Box Top Support Confirmation: It is not yet clear if the top of the yellow consolidation box (approx. 90k) has successfully flipped into support after the breakout. Therefore, a healthy correction down to the 90k–88k range (indicated by the red line) is expected.
4. Liquidity Zones
Although the chart shows an uptrend, the dense yellow liquidity zone formed just below at 91.8k is likely to act as a magnet pulling the price down.
Therefore, it is reasonable to expect a short-term pullback to around 91,800 USDT. The market will likely decide whether to resume the uptrend or decline further after sweeping the liquidity in this area.
5. Coinbase Premium
The Coinbase Premium has been rising for the past 4-5 days, but it remains in negative territory.

BTC on US open and US ISM ServicesWatching US Open and the US #ISM services data closely...
Expecting that New York fakedumps towards ~$91k, and 30 minutes later US ISM services slightly miss (lower then expected) and pumps up the market...
Patience is key...
#Trading #Bitcoin #CryptoMarket #StockMarket

Bitcoin Stuck in a Holiday Range — CME Gap Below?During the Christmas period, Bitcoin ( BINANCE:BTCUSDT ) didn’t exhibit strong momentum and has been moving within a range.
Bitcoin is currently near the resistance zone($90,960-$90,090) and the Cumulative Short Liquidation Leverage($91,840-$90,920).
From an Elliott Wave perspective, it appears that Bitcoin has completed the Double Three Correction(WXY).
I expect that given the weekend and generally lower trading volume at this time, Bitcoin may struggle to break the resistance zone($90,960-$90,090) and could begin to decline, potentially filling the CME Gap($88,720-$88,120). If BTC breaks the support lines, we can expect further declines to the support zone($87,050-$86,420).
Note: Additionally, two important trading levels to watch for Bitcoin are $90,300 and $87,830.
What are your thoughts? Do you think Bitcoin will continue its trend into 2026, or should we prepare for a correction? I’d love to hear your opinion!
Cumulative Long Liquidation Leverage: $87,110-$86,020
First Target: Support lines
Second Target: Support zone($87,050-$86,420)
Stop Loss(SL): $91,880
Points may shift as the market evolves
💡 Please respect each other's opinions and express agreement or disagreement politely.
📌Bitcoin Analysis (BTCUSDT), 1-hour time frame.
🛑 Always set a Stop Loss(SL) for every position you open.
✅ This is just my idea; I’d love to see your thoughts too!
🔥 If you find it helpful, please BOOST this post and share it with your friends.

Quick Bitcoin analyseBitcoin is testing the $90.3k S/R level again, but this time we're seeing 4h candles closing above the EMA200. If this level holds, I expect a clean break toward $95k and $100k after (local high of HTF trading area). Once $90.3k is confirmed as support, everything will pump.
CRYPTOCAP:ETH 4h time frame:
ETH moved into a new trading area between ~$3050 and ~$3250 and is around the mid of the range atm...
No fomo... Wait for confirmations to scalp around the mid... But when it comes back to the lower range around ~$3050 (and bounce on EMA200 on the 4h), Major Highcaps will pump... Keep an eye on that level... ✍️

BTC BUY ALERT
📌 Trade Plan:
🔓 Entry: 89000
❌ Stop Loss: 88500
🎯 Target: 90000
🔥 BTC BUY ALERT – 89,000 Zone
Buyers stepping in strong! Momentum building toward 90,000.
Clean setup, high-probability entry, perfect risk-reward.
⚠️ Trade with discipline. Educational purpose only.

BTC will pump a lil or not?As you can see the green resistance line is broken and BTC is sitting on it and trying to make it a support line. But nothing is sure yet! if the 4-hour chart price close on top of the green line, there will be a good chance for a lil long profit till the red zone, followed by a BIG STRONG SHORT at the red zone down to hell !!! also don't forget about the daily candle which gonna close in 2 hours if you want a lil long profit. But it gonna be a really high risk long because as you can see we have already kissed the resistance line 3 times and even broke down the red bullish trendline. so BE VERY CAREFULL! I personally prefer a low leverage short from here rather than being greedy on that lil risky long profit.

#BTC #BTCUSD #BTCUSDT #BITCOIN #Update #Analysis #Eddy#BTC #BTCUSD #BTCUSDT #BITCOIN #Update #Analysis #Eddy
Warning: Bitcoin is ready for the next wave of decline. As I have been warning for months that Bitcoin will fall below $30,000, now is the time for it to happen.
My analysis and prediction for Bitcoin in 2026 and 2027 will be as follows.
We will enter 2026 with a tiring suffering and end 2025.
We will have the accumulation towards the end of 2026 and the main growth of Bitcoin will occur in 2027.
As shown in the previous chart, on the monthly timeframe, the 2 candles that I have marked on the chart are similar to the last 2 candles of Bitcoin in the last 2 months.
I have marked for you the important areas of demand on the higher timeframes.
This analysis is based on a combination of different styles, including the Dow and Wyckoff theories, as well as market structure.
Get the necessary confirmations to enter the trade from this analysis based on your strategy and style.
Don't forget about risk and capital management.
You are responsible for trading and I am not responsible for your failure to comply with risk and capital management.
💬 Note: This is just a possibility and this analysis, like many others, may be violated. Given the specific circumstances of Bitcoin, it cannot be said with certainty that this will happen and this is just a view based on the style and strategy of ICT with other analytical styles, including the liquidity style.
Be successful and profitable.
Review the result of my previous analysis on Bitcoin:

BTC | BUY TRADE SETUP ANALYSISBTCUSD BUY SETUP.
Bitcoin is holding a key demand zone and showing signs of short-term strength on the lower time frame. If buyers maintain control, a push toward the upside target is possible.
Buy Zone: 85900 - 86200
Stop Loss: 85000
Target: 87000
This setup is based on price action and structure, with clearly defined risk and a logical invalidation level. Always wait for confirmation and manage risk properly.
If this idea adds value, like & follow for more crypto market updates and chart insights.

BTC/USD 4-hour Analysis I 12/181. Price Structure & Trend Analysis
Main Trend: The chart shows a strong downward movement from the $93,200 area down to a low near $85,200. Currently, the price is in a consolidation phase following this sharp drop.
Current Price: BTC is trading around $86,812 (according to the real-time data on the chart).
Candlestick Patterns: We see short-bodied candles with long wicks on both sides, indicating market indecision at this short-term bottom.
2. Volume Profile Analysis
Your chart displays key zones using the Fixed Range Volume Profile:
VAH zone (Value Area High): Around $87,800 - $88,000. This acts as immediate resistance. A breakout above this zone would signal a clearer recovery.
POC zone (Point of Control): Around $86,214. This is the level with the highest traded volume in the current range. The fact that price is holding above the POC is a slightly bullish sign, suggesting buyers are attempting to defend this level.
VAL zone (Value Area Low): Around $85,600. This is the crucial support floor. If a 4-hour candle closes below this zone, BTC could seek lower support levels (towards the $84,000 area).
3. Key Levels to Watch
Resistance:
$88,766: The yellow horizontal line; a strong former supply zone.
$90,209: The black horizontal line (a major psychological level).
$93,206: The previous peak where the sell-off originated.
Support:
$86,200: The current POC area.
$85,200: The most recent swing low. A break below this would turn market sentiment extremely bearish.
4. Outlook & Strategy
The market is currently in a "wait-and-see" mode. After a heavy drop, prices usually need time to move sideways to absorb selling pressure.
Bullish Scenario: If the price closes a 4h candle above $88,000 (breaking VAH), BTC could rally toward the $90,200 region.
Bearish Scenario: If price loses the $86,000 mark, selling pressure may return to test deeper support at $84,000 - $84,300.
Note: This analysis is based on technical data; the crypto market is highly volatile. You should combine this with macro news for more accurate decision-making.

Bitcoin Pullback to Resistance — Next Drop Loading?As I expected , Bitcoin( BINANCE:BTCUSDT ) has begun its decline from the resistance zone($94,850-$93,000) and has reached its target.
Currently, Bitcoin is moving near the resistance zone($90,900-$90,100), the Cumulative Short Liquidation Leverage($91,840-$90,110), and other resistance lines.
From an Elliott Wave perspective, it appears that Bitcoin has completed its five-wave downward sequence and is now in the process of forming the corrective waves upward, likely within the resistance zone($90,900-$90,100).
Moreover, since the USDT.D% ( CRYPTOCAP:USDT.D ) has successfully broken the upper line of its falling wedge pattern, we can anticipate further increases in USDT.D%, which could put additional downward pressure on Bitcoin.
Additionally, considering that the S&P 500 index( SP:SPX ) is likely to resume a bearish trend, and given Bitcoin’s correlation with the SPX, a further decline in Bitcoin is not unexpected.
In conclusion, based on the above analysis, I expect that Bitcoin will at least test the support lines and, if those are broken, it may continue to decline toward the Cumulative Long Liquidation Leverage($87,000-$85,663). If the momentum of breaking these support lines is strong, we can expect even more significant downward movement.
Do you think Bitcoin can go below $87,000?
First Target: Support lines
Second Target: Cumulative Long Liquidation Leverage($87,000-$85,663)
Stop Loss(SL): $92,000(Worst)
Points may shift as the market evolves
💡 Please respect each other's opinions and express agreement or disagreement politely.
📌Bitcoin Analysis (BTCUSDT), 1-hour time frame.
🛑 Always set a Stop Loss(SL) for every position you open.
✅ This is just my idea; I’d love to see your thoughts too!
🔥 If you find it helpful, please BOOST this post and share it with your friends.

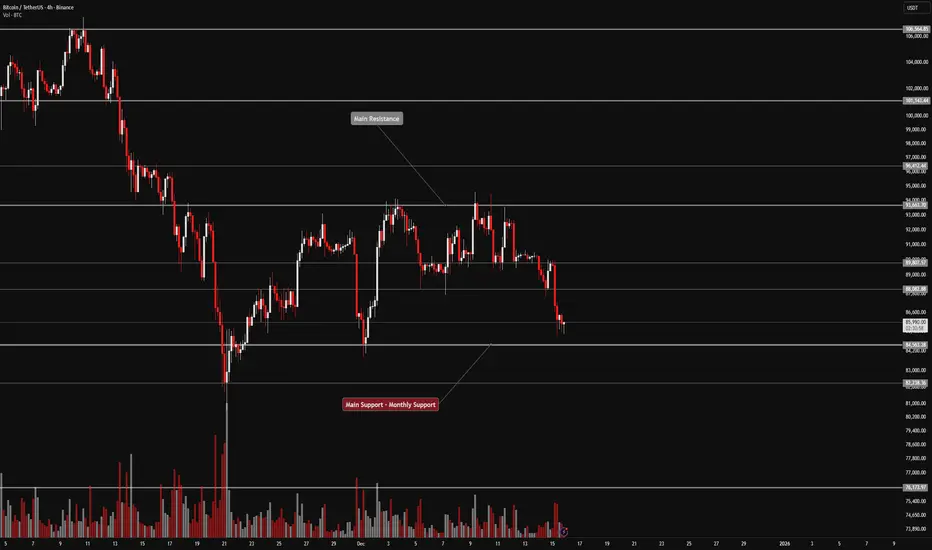
BTC 4H Range Structure With Key Breakout Levels🔥 Welcome To FireHoseReel !
Let’s dive into Bitcoin (BTC) analysis.
👀 BTC 4H Overview
Bitcoin is currently trading inside a 4-hour range, with resistance at $93,663 and support at $84,563. A breakout from this box could trigger a major move. Keep in mind that December holiday conditions, especially Christmas, are keeping overall market volume relatively low.
📊 Volume Analysis
After breaking $88,082, Bitcoin’s volume shifted into strong selling pressure, printing a large 4H sell-off candle. A renewed volume expansion could lead to another significant move and potentially push price out of this range.
✍️ BTC Trading Scenarios
🟢 Long Scenario:
A breakout above $88,082 with rising buy volume could activate a low-risk long setup (~0.25% risk). If buying pressure expands into higher timeframes, the next resistance levels are $89,807, $93,663, and $96,412.
🔴 Short Scenario:
A breakdown below the current support near $84,563, confirmed by increasing sell volume, could provide a solid short opportunity.
🧠 Protect your capital first. No setup is worth blowing your account. If risk isn’t controlled, profit means nothing. Trade with rules, not emotions.