BTC Scalp Sell/Short Setup (15M)The trend and structure are bearish, and Bitcoin is approaching a bearish origin point. If it fails to break through this origin, the low that created this bullish wave will be at risk.
With this in mind, we can prepare a position for Bitcoin with a risk-to-reward ratio of 1:2.
The last bullish wave on the lower timeframes also has a bearish CH.
Let’s see what happens.
For risk management, please don't forget stop loss and capital management
When we reach the first target, save some profit and then change the stop to entry
Comment if you have any questions
Thank You
Btcanalysis

BTCUSDT -- Is 98K a key level??BTCUSDT -- Is 98K a key level and we see another ATH or we already hit the top of this cycle?
I would like some insights from expert and experienced traders here.

BTC/USD: Anticipating Rejection from FVG and Short-Term DropRecent Trend: Following a period of upward movement (October 24th - 27th), the price experienced a sharp drop from its peak near $116,000, indicating a short-term structural break to the downside.
Fair Value Gap (FVG): The shaded gray box, labeled FVG, represents a zone of price inefficiency created during the aggressive drop (between approximately $112,000 and $113,000). The price is currently trading near the lower boundary of this FVG.
Consequent Retracement Levels (CRT):
CRT-L (around $113,600) is the highest level of the FVG structure.
CRT-H (around $109,200) is the next anticipated level of support and the target for the expected decline.
Proposed Price Action:
The primary curved arrow indicates the expectation that the price will move up into the FVG zone to "fill" or mitigate the inefficiency.
After reaching the FVG, the price is expected to reject the zone and resume its decline (indicated by the straight black arrow) towards the CRT-H support level at approximately $109,200.
Interpretation and Trading Bias
The analysis suggests a short-term bearish outlook for Bitcoin. The setup is based on the principle of price mitigating its imbalances (the FVG) before continuing the move that created that imbalance. The trade idea is to wait for the price to reach the FVG (the area of liquidity/resistance) before entering a short (sell) position targeting the CRT-H low.

Bitcoin Hits PRZ – Time for a Correction?As I expected yesterday , Bitcoin ( BINANCE:BTCUSDT ) did drop down to the Support zone($114,300-$113,000) at the lower line of the ascending channel and then started rising again today. Both Long and Short positions basically hit their Targets .
At the moment, Bitcoin is moving near a Resistance zone($118,740-$115,740) , the Potential Reversal Zone(PRZ) , and Cumulative Short Liquidation Leverage($118,224-$116,281) .
From an Elliott Wave perspective , it seems like Bitcoin is completing the microwave 4 of the microwave C of the main wave Y . There's a noticeable Negative Regular Divergence(RD-) between the last two peaks, which suggests some weakening momentum .
I expect that Bitcoin won't break through the Resistance zone($118,740-$115,740) easily and may fall back at least to the Support zone($114,300-$113,000) . If it drops below the 100_SMA(Daily) and 50_SMA(Daily) , we could see a deeper decline and possibly the CME Gap($113,495-$110,990) being filled.
Note: Another point to mention is that although the SPX500( TVC:SPX ) has been hitting new all-time highs as the new week began, BTC has shown a bit less correlation with it in the last day. So if the S&P 500 undergoes a correction, Bitcoin might actually see a sharper pullback, which is something to watch out for as a potential negative factor for Bitcoin.
Note: Also, keep in mind that tomorrow, some important U.S. economic indices will be released, which could also influence the market. So definitely factor that into your considerations.
Note: In general, the crypto market in the past couple of weeks has been heavily influenced by news around U.S.-China tariffs. Any headline can cause Bitcoin and other tokens to swing up or down, so keep an eye on those geopolitical headlines.
Cumulative Long Liquidation Leverage: $106,033-$104,090
Please respect each other's ideas and express them politely if you agree or disagree.
Bitcoin Analysis (BTCUSDT), 2-hour time frame.
Be sure to follow the updated ideas.
Do not forget to put a Stop loss for your positions (For every position you want to open).
Please follow your strategy and updates; this is just my Idea, and I will gladly see your ideas in this post.
Please do not forget the ✅' like '✅ button 🙏😊 & Share it with your friends; thanks, and Trade safe.
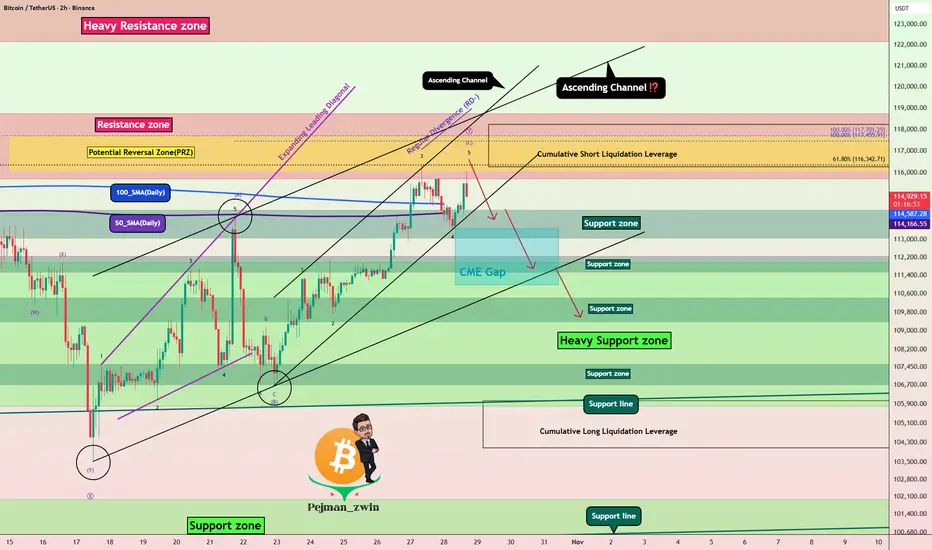
Bitcoin Rally Heating Up – Watch This Zone Carefully!As the new week kicked off, Bitcoin ( BINANCE:BTCUSDT ) started to climb, fueled by a pump in the S&P500 index ( SP:SPX ) and the creation of a gap in the S&P500 index.
It seems Bitcoin has successfully broken above the 100_SMA(Daily) and 50_SMA(Daily) , as well as a Resistance zone($114,300-$113,000) .
In fact, Bitcoin has also formed a new CME Gap($113,495-$110,990) due to this S&P500 Index -driven surge.
Right now, Bitcoin is approaching the next key Resistance zone($118,740-$115,740) , Potential Reversal Zone(PRZ) , the Cumulative Short Liquidation Leverage($117,577-$116,731) , and the upper line of an ascending channel .
From an Elliott Wave perspective , by breaking this Resistance zone($114,300-$113,000) , Bitcoin has entered a new phase of wave counting. It appears to be completing microwave 4 of the main wave C . Overall, the corrective structure seems to be a Zigzag Correction(ABC/5-3-5) with an expanding leading diagonal in main wave A .
I expect that in the coming hours, after a pullback to the broken Resistance zone($114,300-$113,000) and those moving averages , Bitcoin might rise again at least up to the Potential Reversal Zone(PRZ) . There's a possibility of forming a larger ascending channel, but since we haven't confirmed a second top, we can't rely on that channel just yet.
Note: In general, the crypto market in the past couple of weeks has been heavily influenced by news around U.S.-China tariffs. Any headline can cause Bitcoin and other tokens to swing up or down, so keep an eye on those geopolitical headlines.
Cumulative Long Liquidation Leverage: $113,625-$112,175
Cumulative Long Liquidation Leverage: $106,033-$104,090
Note: If Bitcoin falls below the moving averages and the Resistance zone($114,300-$113,000) again, we can expect further declines.
Please respect each other's ideas and express them politely if you agree or disagree.
Bitcoin Analysis (BTCUSDT), 2-hour time frame.
Be sure to follow the updated ideas.
Do not forget to put a Stop loss for your positions (For every position you want to open).
Please follow your strategy and updates; this is just my Idea, and I will gladly see your ideas in this post.
Please do not forget the ✅' like '✅ button 🙏😊 & Share it with your friends; thanks, and Trade safe.

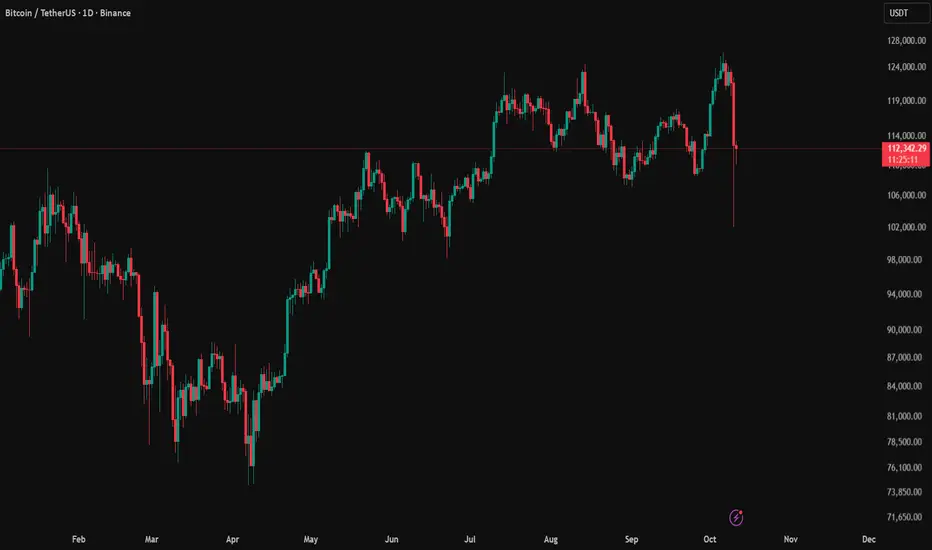
Is Bitcoin still bearish? (1D)In response to the question of whether Bitcoin is still bearish | the answer is yes.
After the drop, Bitcoin has reached a strong support zone, where it’s currently reacting and consuming lower supports. A rejection from the red zone is expected.
However, keep in mind that due to the high volume of short positions, the red zone might even experience a fakeout before the drop continues.
A daily candle closing above the invalidation level would invalidate this analysis.
For risk management, please don't forget stop loss and capital management
Comment if you have any questions
Thank You

Bitcoin Analysis 4 HoursBitcoin Time Frame 4 Hours
Currently between two 4-hour balances
Supports 114 and 112 and resistances 118 and 120
Liquidity ranges are characteristic
As long as we are above the green balance, we tend to rise, especially since the bearish balance (red) has not yet pulled back and for further correction and low liquidity hunt, we bet on a 4-hour candle below 111, so for now, there is more upside and pullback with buyer support in the market for resistances

Bitcoin Roadmap– Next Move Down Incoming?As I expected yesterday , Bitcoin ( BINANCE:BTCUSDT ) started rising from the Support zone($107,580-$106,700) and has now hit its Target at the Resistance zone($110,430-$109,380) .
Now the question is: will Bitcoin continue its short-term uptrend in the next few hours, or is it going to drop again? Stay with me to find out.
Bitcoin is trading near the Resistance zone($110,430-$109,380) , Potential Reversal Zone(PRZ) , and Cumulative Short Liquidation Leverage($111,613-$110,542) .
From an Elliott Wave perspective , it seems that Bitcoin is completing the wave C of an Expanding Flat Corrective Pattern(ABC/3-3-5) .
Given that the S&P 500 ( SP:SPX ) ( which has recently been correlated with Bitcoin ) is likely to drop when the U.S. market opens , I expect Bitcoin to resume its decline . This next drop might be the final push to break the Heavy Support zone($111,980-$105,820) .
What do you think? Can Bitcoin break that Heavy Support zone($111,980-$105,820) in the end or not? Let me know your thoughts!
Cumulative Long Liquidation Leverage: $106,606-$105,463
Please respect each other's ideas and express them politely if you agree or disagree.
Bitcoin Analysis (BTCUSDT), 15-minute time frame.
Be sure to follow the updated ideas.
Do not forget to put a Stop loss for your positions (For every position you want to open).
Please follow your strategy and updates; this is just my Idea, and I will gladly see your ideas in this post.
Please do not forget the ✅' like '✅ button 🙏😊 & Share it with your friends; thanks, and Trade safe.

BTC/USD: Testing Key Supply Zone; Expecting Rejection1. Market Context (Prior Movement)
The chart opens shortly after a sharp, significant downtrend from levels well above $118,000.
Following the crash, the price action has been primarily sideways to slightly choppy, consolidating the large prior move.
2. Key Structure: Supply Zone
The price recently saw a sharp, bullish candle that tested a new high in the consolidation but was immediately sold off. This peak region is highlighted by the teal box, which represents a Supply Zone (or Resistance Zone) between approximately $112,000 and $113,800.
This zone signifies where sellers previously stepped in forcefully, absorbing the demand and pushing the price down.
3. Current Price Action and Prediction
The price is currently retesting the lower boundary of this key Supply Zone.
The chart includes a bearish prediction (downward arrow) originating from the Supply Zone. This suggests an expectation that the zone will hold, leading to a rejection and a move back down.
The predicted downside target is the dotted line at approximately $109,233, which aligns with a previous area of support within the recent consolidation range.
In simple terms, the price is at a critical ceiling, and the expectation is a rejection leading to a pullback.

The Bitcoin bearish era has begun (1D)First of all, you should know that in our previous analyses, we had identified a large triangle. However, the market makers created another bullish wave, increasing the chart’s error margin (The scenario you see in the related ideas section.).
This sharp move indicates the beginning of new bearish branches! It is expected that with a pullback to the red zone, the correction will continue, and we will be involved in it for at least a few months.
Closing a daily candle above the invalidation level will invalidate this analysis.
For risk management, please don't forget stop loss and capital management
When we reach the first target, save some profit and then change the stop to entry
Comment if you have any questions
Thank You

Bitcoin Analysis Update, 1 Hour Time Framehi traders
Previous analysis link:
Well, the one-hour time frame moved exactly as I expected. Key resistance points were precisely defined, and the continuation of the move towards the hunt for two liquidity levels and support below these two liquidity levels is a good area for a trigger buy.
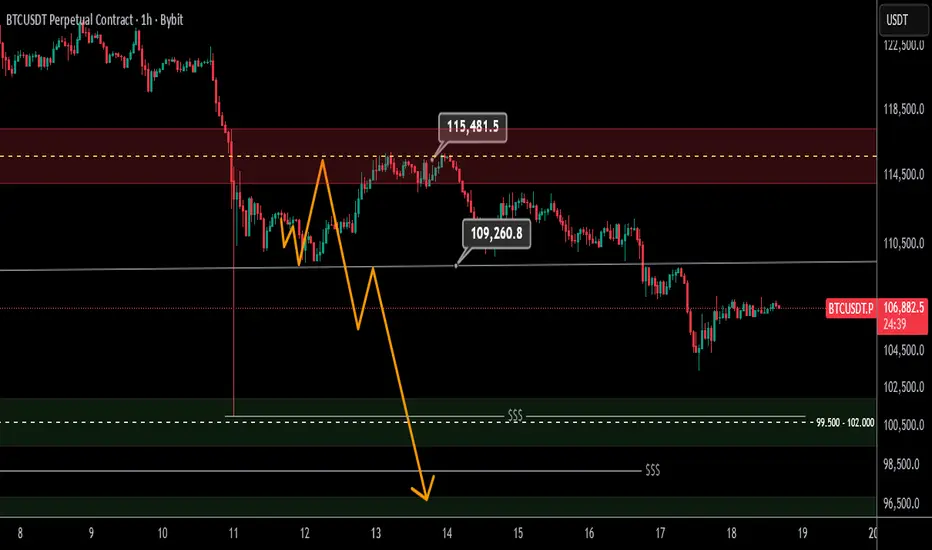
Bitcoin Daily AnalysisHi Traders
Bitcoin Daily Time Frame After Liquidity Hunt A multi-layered level is currently above its own Hunt line. The upper and lower liquidity points on the chart are characteristic and the condition for reaching the lower liquidity points is to close the daily candle below the Hunt line 109.260 in this case the support level below the liquidity is characteristic for Trigger Buy

BTC: Monthly FVG Retest Before New ATHCurrent Status: The price is around $104,447 and is currently in a strong corrective move after reaching a recent high.
All-Time High (ATH): The previous peak is marked near $126,311. This is the key long-term target.
Monthly Fair Value Gap (FVG): The blue box between approximately $95,000 and $98,000 is a "Monthly FVG". This area is expected to act as a magnet for the price to retrace to.
Projected Path: The analyst expects the price to drop further into the Monthly FVG (the $95k - $98k zone) before finding strong support. Following this test, a major rally is projected to push the price back up to hit the All-Time High near $126,311.
The main idea is a deep correction to a technical support level (FVG) followed by a bullish continuation to a new ATH.

Bitcoin Bearish Continuation from Daily FVGa bearish continuation setup on Bitcoin (BTC/USD) in the daily timeframe.
After a sharp rejection from the Daily Fair Value Gap (FVG) zone between roughly $114,000–$120,000, price shows strong bearish momentum. The large red candle indicates sellers’ dominance, and the marked downward arrow projects a potential move toward lower support zones around $108,000 and $105,000, which act as the next liquidity levels or demand areas.

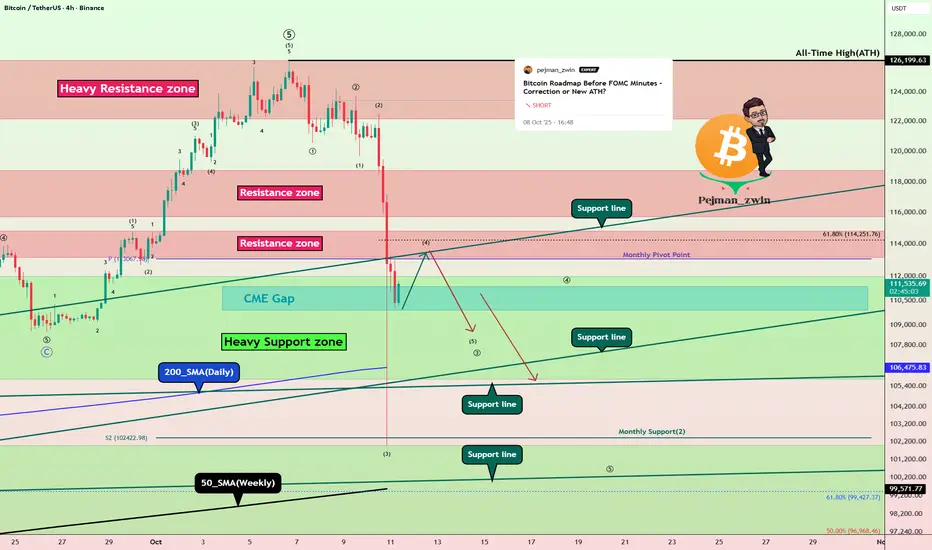
Bitcoin Roadmap: Is a Major Correction the Next Stop?As I expected from the previous analysis , Bitcoin did start to drop and hit its targets .
Now, with the news that the U.S. might impose a 100% tariff on China , we saw Bitcoin sharply sell off last night. Actually, as I mentioned in my previous ideas , the rally from about $109,000 to around $126,199(ATH ) (which was a new all-time high for Bitcoin) had relatively low volume. That was a sign that a correction might be on the way, and last night’s news just acted as a trigger to speed it up.
In fact, what took Bitcoin 10 days to climb was reversed in about 4 days , showing how strong the sellers are right now.
Educational tip: You can use volume candles on TradingView to see which candles had higher volume—the thicker the candle, the more significant the move.
Now, the big question: will Bitcoin keep dropping or bounce back?
Right now, it’s sitting near a cluster of Support lines and close to the daily 200_SMA(Daily) and the 50_SMA(Weekly) , as well as a Heavy Support zone($111,980-$105,820) . Last night’s drop was basically the first test of these supports .
Since it’s the weekend and volumes are usually lower, we don’t expect a huge downward move in the next 48 hours.
Bitcoin might do a pullback to the broken Resistance zone($114,820-$113,180) and then continue its drop.
According to Elliott Wave analysis , Bitcoin seems to be completing a microwave 4 of the main wave 3 .
I expect that after Bitcoin completes , we might see it continue downward and fill the CME Gap($111,355-$109,915) early in the next week.
So, do you think the major correction for Bitcoin has started or not? Let me know what you think!
Note: In case the Support lines break, there’s also a chance that we might see a Death Cross (where the 50-day moving average crosses below the 200-day moving average), which could signal further bearish momentum.
Note: Around the $108,000 level, we have huge buy orders stacked up, which might act as a significant support zone.
Please respect each other's ideas and express them politely if you agree or disagree.
Bitcoin Analysis (BTCUSDT), 4-hour time frame.
Be sure to follow the updated ideas.
Do not forget to put a Stop loss for your positions (For every position you want to open).
Please follow your strategy and updates; this is just my Idea, and I will gladly see your ideas in this post.
Please do not forget the ✅' like '✅ button 🙏😊 & Share it with your friends; thanks, and Trade safe.
After a strong downward movement, the price has formed a base anAfter a strong downward movement, the price has formed a base and is now showing signs of upward momentum. The chart suggests a long trade setup, with clear targets at 113,052 (Target 1) and 114,037 (Target 2), while maintaining a stop loss around 111,000.

Descriptions about the market! Read the caption!Given Mr. Trump's remarks and the unprecedented crash in cryptocurrencies, I must say this individual significantly harms markets, especially investors. Imposing a 100% tariff on Chinese goods essentially means "we want no trade with you," which is fundamentally unfeasible. The United States and China will undoubtedly negotiate. However, our main focus here is the financial market collapse. This decline isn’t merely about falling prices—it goes beyond that. The core issue is the loss of market trust and credibility. Once confidence is broken, it is difficult to restore and may take a long time.
In any case, I felt it was my duty to bring this up and remind you to stay composed. Never forget to use stop-losses in your trades and practice proper capital management.
If needed, you can always message me on this platform for advice.
NOTE: This post is This post is educational.
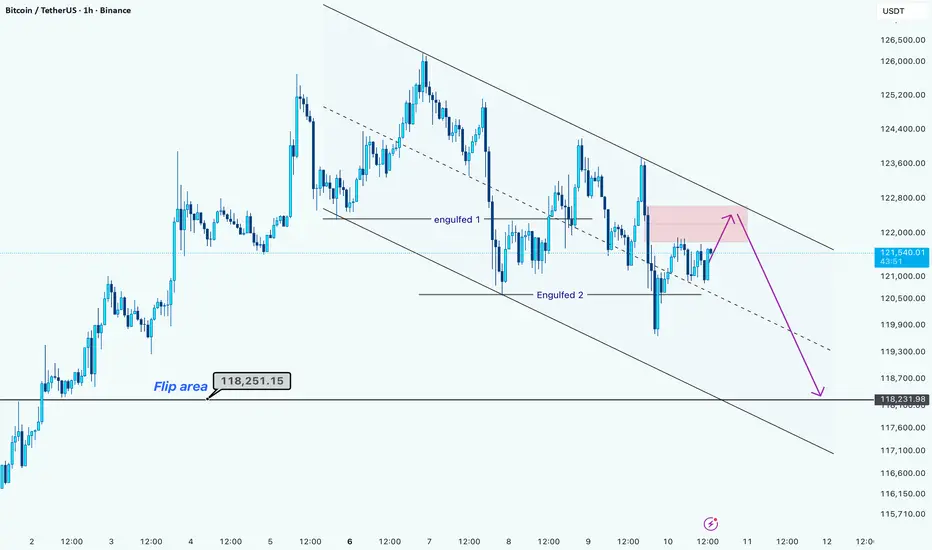
Bitcoin Facing Channel Resistance: Another Drop Ahead?Hello guys!
BTC is currently moving within a descending channel, showing consistent lower highs and lower lows, confirming a short-term bearish structure. The price continues to respect this channel, and until a clear breakout occurs, the downward bias remains intact.
Key Observations:
Two bearish engulfing (Engulfed 1 & Engulfed 2) have marked strong rejections from the upper boundary, reinforcing seller dominance at higher levels.
After the second engulfing, the price rebounded slightly, forming a minor pullback within the channel.
The upper boundary around $122,200–$122,500 is acting as dynamic resistance, aligning with the trendline.
Short-Term Expectation:
BTC could potentially push once more toward the upper boundary of the channel (around $122,200), where sellers may re-enter.
If the resistance holds, a continuation toward the $118,200–$118,300 support zone is expected, which aligns with the lower boundary of the channel and previous reaction levels.
Levels to Watch:
Resistance: $122,200 – $122,500
Support: $118,200 – $118,300
Breakout confirmation: A clean close above $122,500 could invalidate the bearish setup and open the way for a short-term bullish correction.
Bias: Bearish below $122,500
BTC → Correction phase before bullish expansionBTC/USD Report-Based Analysis
Bitcoin is currently in a corrective phase following a structured upward delivery. After showing strength early in the cycle, the market transitioned into a redistribution and consolidation zone, allowing liquidity to rebalance across both sides. This shift suggests that price is undergoing a short-term reaccumulation before the next impulsive move. The recent break of structure (BOS) indicates a temporary bearish delivery, designed to sweep liquidity below prior demand zones. Smart money appears to be collecting positions in discounted price areas, absorbing sell-side liquidity as volatility expands. The clean liquidity pockets under 116,000–114,000 levels highlight potential mitigation zones where larger participants may seek re-entry. The overall structure remains bullish on the higher timeframe. Once the current correction finalizes and liquidity is efficiently collected, BTC may resume its upward expansion, targeting premium zones near 125,000 and above. Momentum confirmation from volume and market flow will be essential for validating this transition back into a bullish delivery phase. In short, BTC is in a controlled correction, aiming to refine liquidity before reinitiating its bullish macro delivery cycle.

BTC/USD Bullish Reversal Setup from Demand Zonea potential bullish retracement setup on Bitcoin (BTC/USD) in the 1-hour timeframe. After a strong bearish move, price entered a highlighted demand zone, suggesting a possible short-term reversal. The projection shows a rebound from this support area toward Target 1 (118,472) and Target 2 (119,404), with a Stop Loss positioned below the recent swing low at 115,628.

BTC (SHORT)BINANCE:BTCUSDT
SHORT
Entry 123 900
SL 126 300
T1 117 500
Golden Advices.
********************
* Please calculate your losses before the entry.
* Do not enter any trade you find it not suitable for you.
* No FOMO - No Rush , it is a long journey.

BTC ( Long ) or (Spot)BINANCE:BTCUSDT
LONG & SPOT
Entry 117 800
SL 115 000
T1 131 700
Extra Targets 137 000 & 160 000 are optional
Golden Advices.
********************
* Please calculate your losses before the entry.
* Do not enter any trade you find it not suitable for you.
* No FOMO - No Rush , it is a long journey.

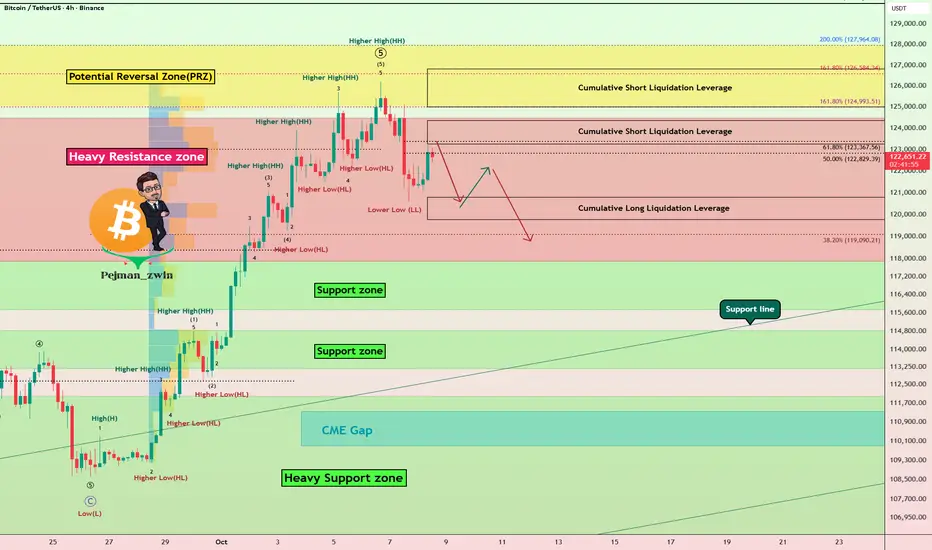
Bitcoin Roadmap Before FOMC Minutes – Correction or New ATH?Today, we have one of the most important macro events — the FOMC Meeting Minutes
Let’s quickly understand what it is and why it could shake the crypto market
What are FOMC Minutes?
They’re the detailed notes from the last Federal Reserve meeting, showing what members discussed about interest rates, inflation, and the economy.
Markets carefully read every line to find hints about future rate cuts or continued tightening.
Why does it matter for Bitcoin?
When the Fed turns dovish (hinting at lower rates), risk assets like Bitcoin usually rally But when the tone is hawkish (worried about inflation), investors move to cash or bonds, causing crypto to dip.
Let’s take a look at Bitcoin ( BINANCE:BTCUSDT ) on the 4-hour timeframe .
Before analyzing the chart, let’s quickly review what defines a strong uptrend :
1-Higher Lows(HL):
Each new low should form above the previous one, showing that buyers are stepping in earlier each time.
2-Higher Highs(HH):
Each new high should be higher than the last, confirming that bullish momentum is still in control.
3-Structure Respect:
The new low should not break below the previous high — if it does, it doesn’t necessarily mean the trend is over, but it indicates a weakening of the bullish structure.
Based on the points above, Bitcoin failed to form a new Higher Low(HL) during the past 24 hours, and the previous high was retested .
These signals indicate a loss of bullish momentum, suggesting that we might see at least a short-term correction from a technical perspective.
Bitcoin has already started to bounce back nicely from the Potential Reversal Zone (PRZ) and is currently trading in a Heavy Resistance zone($124,474-$117,900) .
In terms of Elliott Wave theory , it seems that with the formation of a Lower Low(LL) , Bitcoin has completed at least a series of impulsive waves , and we can now expect corrective waves .
I expect Bitcoin to drop to at least Cumulative Long Liquidation Leverage($120,779-$119,957) before the FOMC Meeting Minutes start and could continue to rise or correct depending on the tone of the FOMC Meeting Minutes .
Note: You should note that these days, Bitcoin has a higher correlation with the SPX500( SP:SPX ) index than before, so if there is a sudden movement in Bitcoin, one of the reasons could be a sudden movement in the SPX500.
Do you think this bullish move could lead to a new all-time high (ATH) for Bitcoin again!?
Cumulative Short Liquidation Leverage: $124,350-$123,244
Cumulative Short Liquidation Leverage: $126,813-$125,000
CME Gap: $111,355-$109,915
Please respect each other's ideas and express them politely if you agree or disagree.
Bitcoin Analysis (BTCUSDT), 4-hour time frame.
Be sure to follow the updated ideas.
Do not forget to put a Stop loss for your positions (For every position you want to open).
Please follow your strategy and updates; this is just my Idea, and I will gladly see your ideas in this post.
Please do not forget the ✅' like '✅ button 🙏😊 & Share it with your friends; thanks, and Trade safe.