BTC SHORT or LONG ?!Hi guys.
If price brake the RED TREND we have a bearish price for to TP.
But if price back and going to brake green trend we have bullish price and the tp is 30250 to 30450
my idea is short
Btcanalysis

BTC/USDT 1DAY UPDATE BY CRYPTO SANDERS !!Hello, welcome to this BITCOIN /USD update by CRYPTO SANDERS.
CHART ANALYSIS:- Bitcoin (BTC) After the uptrend, bitcoin reached the crucial $30K resistance level and failed to sustain above. However, after a short-term correction phase that resulted in a 14% drop, bitcoin found support at the 50-day EMA at $27.3K.
This has prompted another uptrend, which provides a positive signal for the overall outlook of the cryptocurrency, indicating that the bulls are in control. However, BTC is currently facing an important and decisive resistance level at the $30K price area and it is attempting to break out of it.
If successful, it could start a strong bullish rally towards the $40K price channel. On the other hand, if the price fails to overcome this crucial level, a double-top pattern will form, potentially leading to another bearish leg.
I have tried to bring the best possible outcome to this chart.
Hit the like button if you like it and share your charts in the comments section.
Thank you.

$BTC Daily UpdateCRYPTOCAP:BTC #BTC Struggling to hold HKEX:29 ,483 support, HKEX:29 ,199 support holding. 1D closed very good, a good follow thru can send to test HKEX:30 ,002.

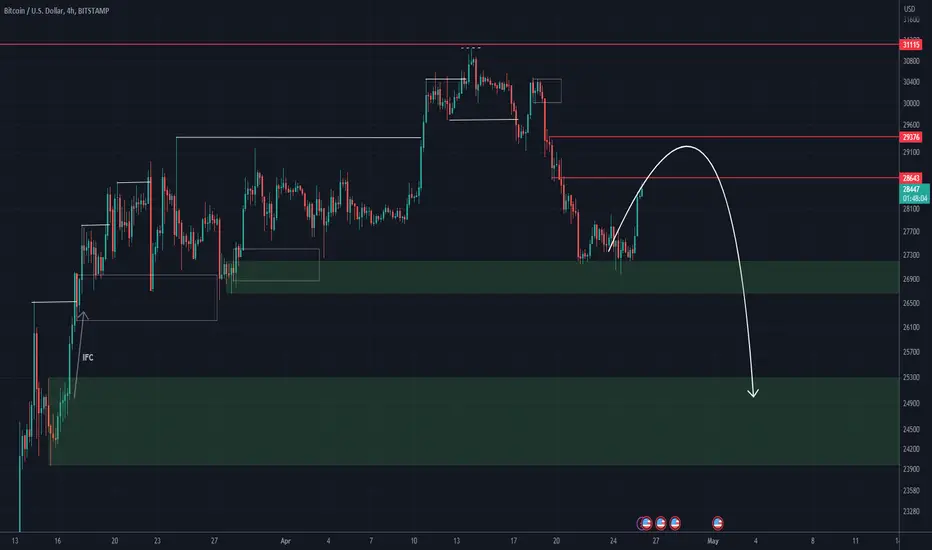
BTCUSDT Price PredictionAs we can see on the 4h chart a down spike that overshot the upper bollinger band has been followed by a deep correction which failed to reach the upper bollinger band.
A second sell off is expected to test the low of the spike and/or the lower bollinger band.
A conservative and safe target could be the level of structure along the way which has been shown by the yellow rectangle.

BTC/USD 1DAY UPDATE BY CRYPTO SANDERS !!Hello, welcome to this BITCOIN /USD update by CRYPTO SANDERS.
CHART ANALYSIS:- Bitcoin (BTC) There was a strong rebound on Wednesday, as markets reacted to the news that deposits at First Republic Bank fell by 100 billion last month.
BTC/USD rose to a peak of 29,121.97 earlier in today's session, following a low of 27,217.17 the day before.
This move has pushed Bitcoin to its highest point in the past seven days when it was trading above 30,000.
Overall, prices turned bullish as bulls rejected a breakout below long-term support near 27,000 on Tuesday.
The Relative Strength Index (RSI) also bounced off its own floor at 44.00 and is now tracking at 54.09.
The ceiling of 55.00 could act as a checkpoint for the bulls, and if they go beyond it, there is a strong possibility that BTC could climb to 30,000.
I have tried to bring the best possible outcome to this chart.
Hit the like button if you like it and share your charts in the comments section.
Thank you.

$BTC Daily UpdateCRYPTOCAP:BTC #BTC Not looking good on current 4H, HKEX:29 ,483 resisting, Current support at HKEX:28 ,781. Saved on last 1D close. HKEX:29 ,483 support needed to retest HKEX:30 ,002.


BTC will have another dropHi, dear traders. how are you ? Today we have a viewpoint to SELL/SHORT the BTC symbol.
For risk management, please don't forget stop loss and capital management
When we reach the first target, save some profit and then change the stop to entry
Comment if you have any questions
Thank You
$BTC long from hereBitcoin is resurging after the wall street turns red.
It has done a great job in acting as a safe heaven asset even leaving the gold behind.
BTC activity is picking up and if SPX goes below 4,000 level, we could see bitcoin back up above the 30k level.

#BTC next target is 34k!#BTC UPDATE
BTC is making this bullish flag pattern and is currently at the lower level of this pattern and is at 200MA support.
(Basic info about the pattern)
The bull flag pattern is a continuation chart pattern that facilitates an extension of the uptrend. The price action consolidates within the two parallel trend lines in the opposite direction of the uptrend, before breaking out and continuing the uptrend.
According to the pattern we can expect a 12% bounce after the break out of this pattern which is around 34k.
RSI is showing some bullish divergence moves in the short term.
Stay tuned I will keep updating
This chart is likely to help you make better trade decisions if it does consider upvoting it.
I would also love to know your charts and views in the comment section.
Thank you

BTC/USD 1DAY UPDATE BY CRYPTO SANDERS !!Hello, welcome to this BITCOIN /USD update by CRYPTO SANDERS.
CHART ANALYSIS:- Bitcoin (BTC) is on the brink of registering a downward crossover of its 10-day (red) and 25-day (blue) moving averages.
A recent downtrend, which today pushed BTC/USD to an intraday low of 27,192.03, has also led to an overall shift in market momentum.
This latest low in Bitcoin comes less than a day after the world’s largest cryptocurrency traded at a high of 27,979.98.
Overall, BTC is trading over 7% lower than at the same point last week, when the price was above 30,000.
In addition to the potential crossover of moving averages, the 14-day relative strength index (RSI) continues to hover close to a floor at 42.00.
At the time of writing, the index is tracking at 44.11, with BTC trading at 27,550.00.
I have tried to bring the best possible outcome to this chart.
Hit the like button if you like it and share your charts in the comments section.
Thank you.

Bitcoin: Little risk to the downsideJust a few percent below the current price is the 200 weekly average (green). The 111 MA also rises steeply and will provide additional support.
Possibly, the end of April and May will still be quite quiet with slightly falling or sideways running prices.
This calms the emotions in the market and provides fuel for further rising prices.
The Bitcoin SOPR continues to hover above 1. The value of 1 serves as support, which suggests a continued uptrend.

$BTC Daily UpdateCRYPTOCAP:BTC #BTC HKEX:27 ,994 resisting as of now, support at HKEX:27 ,478. Bullish engulfing on last 4H close, current 4H looks fine with 28 mins left to close, HKEX:26 ,650- HKEX:26 ,333 test possible if breaks HKEX:26 ,963. HKEX:28 ,298- HKEX:28 ,590 next resistance area to watch

BTC/USD 1DAY UPDATE BY CRYPTO SANDERS !!Hello, welcome to this BITCOIN /USD update by CRYPTO SANDERS.
CHART ANALYSIS:- Bitcoin (BTC) moved lower for a third consecutive session on Friday, as prices slipped below the 28,000 mark.
Following a high of 28,906.25 on Thursday, BTC/USD dropped to an intraday low of 27,855.96 earlier in the day.
As a result of this move, bitcoin fell to its weakest point since April 9, which was the last time price hit a floor of 27,800.
Since nearing this point, BTC bulls have reentered the market, and have pushed prices back above 28,000.
One of the catalysts for today’s drop came as the 14-day relative strength index (RSI) fell to a floor of its own at 46.00.
The index has marginally risen from this low and is tracking at 46.35 when writing.
I have tried to bring the best possible outcome to this chart.
Hit the like button if you like it and share your charts in the comments section.
Thank you.

Multiple BTC bearish patterns all pointing to 25K or worseWith our golden pattern (BTC rising broadening wedge from 15K) showing 22K as the last resistant and if we lose that well see new lows (12K , 9K)
Talked about other patterns in the video and spiced things adding VIX, ETH , NQ1 To the video
Strongly Recommend to Watch it untill the end.Lots of Information
Please consider supporting me with Boost,Follow,Share or comment! Appreciate the support

$BTC Daily UpdateCRYPTOCAP:BTC #BTC HKEX:28 ,298 resisting, on HKEX:27 ,994 support. Daily closed following up to bearish engulfing from Wednesday, Must regain HKEX:29 ,199 as support to resume previous climb.
