BTC Multi-Timeframe Trading PlanWeekly Timeframe (Macro Bias & Swing Context )
On 17 December 2025, I shared the BTC weekly chart and clearly outlined what was likely to unfold. Congratulations to those who followed the analysis.
Price is mirroring the 2022 breakout pattern → expecting accumulation and breakout by mid-2025, with 2026 as a potential cycle expansion phase.
I’ve now updated the BTC weekly chart with additional confluences, highlighting two key upcoming support zones:
Swing Zone (liquidity Sweep possibilities): 65k – 68k
Retracement Zone: 56k – 60k
Comparison: 2022 vs 2026 setups
The 2022 structure marked on chart shows BTC breaking out from a falling trendline post large retracement, leading to multi-month rally.
The 2026 comparative zone mimics that exact setup — short-term liquidity sweep below support, confluence with OB + retracement zone, then structural breakout.
Key Observations
Trend Bias: Bullish macro cycle — higher highs and higher lows.
Structure: Re-Accumulation phase above 50W EMA & long-term ascending trendline.
Important Levels:
Demand / OB Zone: 55K–60K
Strong Support: 70K–73K
Resistance/FVG: 88K–92K → 110K–125K
Weekly Bias:
→ Bullish Re-Accumulation.
→ Enter dips near 70K–73K; accumulate for 90K+ breakout.
Weekly Swing Route Map
Entry: On Retrace Zone to 68K–73K OR breakout close above 80K.
Stop Loss: Below 65K (key structural invalidation).
Targets:
TP1 = 90K (FVG fill)
TP2 = 110K+ (cycle expansion zone)
Hold Duration: 2–8 weeks.
Integrated Setup (Multi Time Frame)
Example
1️⃣ On 4H: Look for a liquidity sweep under 75K (fake out wick) and bullish engulfing to close back above 75.5K.
→ Enter partial long with tight SL (74.5K).
2️⃣ On 1D: Add position when daily candle closes above 78K (bullish structure confirmation).
3️⃣ On 1W: If weekly closes strong >$80K, hold remaining position for macro target 90K–110K.
Trade with cautious. Trade is involved RISKs. This is not a trading Signal, its pure technical analysis based on many confluences marked.
Follow our page for more updates on GOLD, NASDAQ and BTC
The Quantum Trading Mastery
Btcchart

BItcoin Short Term Analysis (4H)As we had already identified Bitcoin’s support zone in previous analyses, this area is still valid.
To assess Bitcoin in the lower timeframes, there are two possible scenarios:
One is that it starts moving upward from the current prices, and the other is that it revisits the green zone once more, forms a double bottom, and then moves toward the red target.
A daily candle closing below the invalidation level will negate this analysis.
For risk management, please don't forget stop loss and capital management
When we reach the first target, save some profit and then change the stop to entry
Comment if you have any questions
Thank You

Bitcoin Bullish Confirmation Above $119500 | Watch November MoveBitcoin is currently trading below a key resistance level of **$114,500**, and a **strong Monday closing on 13 October above this level** is crucial for confirming a short-term bullish recovery.
If BTC successfully closes above **$114,500**, the next important resistance will be around **$119,500**.
A **Monday closing on 20 October above $119,500** would confirm a temporary bullish structure, giving Bitcoin the strength to test higher levels toward the **$127,600 liquidity zone** in November.
Currently, major liquidity is sitting near **$124,600 and $127,600**, which might attract price movement before any major reversal begins.
The market has already taken liquidity around **$101,000**, trapping retail sellers — and now, it may move up to grab the **short-side liquidity** before the next larger downtrend begins.
⚠️ **Be patient and stay disciplined. Avoid long positions for now.**
Focus on the market’s move toward the top, and prepare for **short positions near the highs** to capture the **2026 bear market** — which is expected to last from **September to November 2026**.
📊 The market often manipulates both sides before showing the real direction. Watch levels carefully and trade with confirmation.
💬 **Follow me on TradingView** for more Bitcoin and Ethereum updates — and comment below which coin you’d like me to analyze next!

BTC/USD Bullish Reversal Setup from Demand Zonea potential bullish retracement setup on Bitcoin (BTC/USD) in the 1-hour timeframe. After a strong bearish move, price entered a highlighted demand zone, suggesting a possible short-term reversal. The projection shows a rebound from this support area toward Target 1 (118,472) and Target 2 (119,404), with a Stop Loss positioned below the recent swing low at 115,628.

Bitcoin (BTC/USD) - Bullish Breakout Alert : Targeting $130k ?🚀 Bitcoin (BTC/USD) - Bullish Breakout Alert: Targeting $130K+ in October 2025! 🚀
Hello Traders! In today's chart, I’ve analyzed Bitcoin’s recent movements. As of October 8, 2025, BTC is trading above $123,500, showing an 8.6% surge last week. Following September’s 5.35% gain, the market is in a bullish mood, aligning with the historical "Pumptober" trend.
What to Watch on the Chart:
Double Bottom Pattern: Two troughs formed near $113,000, signaling a bullish reversal. The neckline resistance at $117,300 has been broken, with the next target at $122,000-$125,000.
Symmetrical Triangle Breakout: A breakout from a two-month descending channel has occurred, indicating a sharp upside move, potentially up to $138,000.
Moving Averages: Both the 50-day MA ($118K) and 200-day MA ($115K) are rising, providing strong support. RSI at 65 is in the bullish zone but not overbought.
Volume Trend: ETF inflows ($175M+ last month) and increasing institutional buying volume suggest sustainability, potentially pushing BTC to $130K-$135K.
Prediction: If $124K holds, the target by the end of October is $131,500 (6-8% upside). Worst case, support at $118K-$120K may be tested. Long-term: $150K+ is possible in 2025 due to ETF and halving effects.
Risk: A US government shutdown or macro volatility could lead to a 5-10% dip. Always DYOR and use stop-loss!
Share your thoughts in the comments – bullish or cautious? Like & share if helpful! 📈 #Bitcoin #BTC #CryptoAnalysis #TradingView

BTC/USDT Bullish Channel – Eyes on $130K Targets🔍 Key Observations:
Trend Direction: Bullish
Price is moving consistently within an upward sloping channel, suggesting a strong and steady uptrend.
Current Price: ~$124,353
Price is near the lower boundary of the channel, indicating a possible bounce opportunity to ride the trend higher.
Targets:
Target 1: $128,001
Target 2: $130,100
These are potential resistance zones or profit-taking levels if the bullish move continues.
Structure:
The marked zig-zag path suggests anticipated higher highs and higher lows, in line with a typical channel-based bullish continuation.

BTCUSD RISKY 4H SHORTPrice broke out of bearish trendline but formed resistance at $110600. Price printed a bearish engulfing pattern following Positive US jobs data. A potential two tops or double tops formed. A potential reversal to at least $105000.

BTC / USD 1hr 110K INC!BTC/USD – 1H Chart Analysis
📝 Trend Overview:
BTC is showing signs of a bullish reversal, forming higher highs and higher lows, supported by the broadening bottom pattern. This formation often signals accumulation and precedes breakout moves. The market has now bounced three times from the demand zone, reinforcing its validity as a strong support.
📍 Key Technical Zones:
Demand Zone:
103,201.46 – 104,197.07
Price has tested this zone multiple times and bounced, indicating strong buying interest.
☑️ Supply Zone:
110,098.80 – 111,330.54
Significant historical resistance. If BTC reaches this zone, expect strong selling pressure.
📥 Fair Value Gaps (FVGs):
1H FVG: 105,746.93 – 106,157.49
Aligned with the Fibonacci Golden Pocket (0.618–0.786) retracement, increasing confluence.
4H FVG: 107,337.85 – 107,738.15
Key level for potential breakout or rejection.
✅ Targets:
TP1: 1H FVG zone (~106k)
TP2: 4H FVG zone (~107.5k)
TP3: Supply zone (~110k–111k)
❌ Invalidation:
Break and close below the demand zone would invalidate the bullish bias short term.
📊 Volume Profile & OBV:
Volume Profile (Right Side):
High activity zones between 105k–107k show areas of interest for both bulls and bears.
📊 OBV (On-Balance Volume):
Currently consolidating, which suggests accumulation and potential for a breakout once volume picks up.
🧠 Summary:
BTC has regained bullish momentum following multiple rejections from the demand zone and the formation of a broadening bottom. If the price confirms a higher low at or above 104,925, expect a move towards the 106k and possibly the 110k region. Monitor price action at the FVGs for reactions and profit-taking opportunities.
(NOTE: This is a spot trade - Leverage at your own risk and research)

BTC/USDTwhat's the ultimate bear market signal?
it's the 50-week ema.
if CRYPTOCAP:BTC is above or reclaims the 50w ema it's bull mode. stay long
if CRYPTOCAP:BTC breaks below and can't reclaim it bear market vibes exit and wait.

BTC/USDT#BTC's possible bottom is in.
- took support on a long-term weekly trendline.
-bounced off the 50-week Ema support.
-W.D. Gann's 14th march reversal date

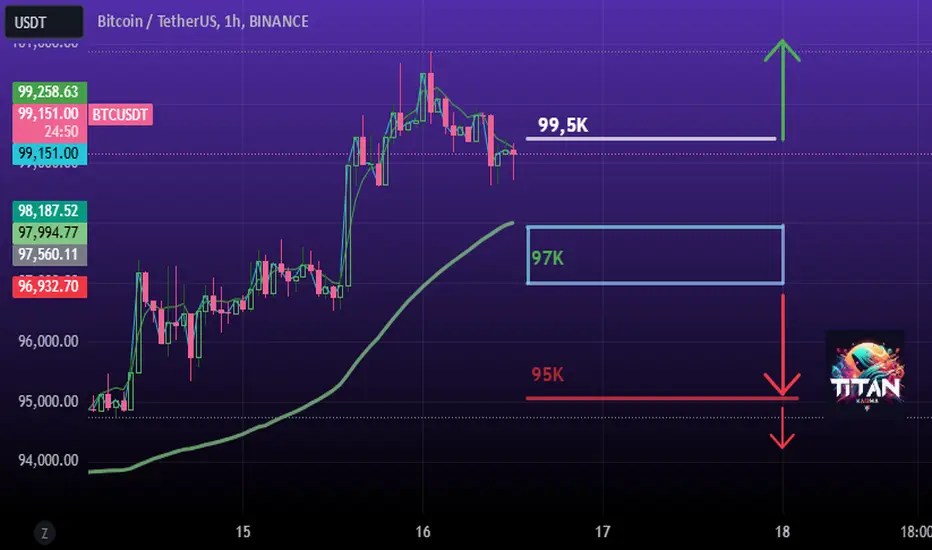
BTC - Third Touch Possible Move BTC has well consolidation done now if third touch happen it would break the support and next move would be near 91000-92000, alternative scenario if breakout happen that means market did not respect to 3rd touch then we can see market near 99000-100000

Thought about BTC chart analysisBelow is a structured, step-by-step technical analysis of the shared BTC/USDT chart (on a 30-minute timeframe) along with a possible short-term (next 12 hours) outlook. Please note this is not financial advice but rather a technical perspective for informational purposes.
1. Identify the Overall Context
Timeframe: The chart is set to the 30-minute interval, indicating short-term price action and intraday volatility.
Current Price Region: BTC appears to be trading in the mid/upper 98,000 range (as shown on the screenshot).
Recent Movement: Price fell sharply from around 102,000–103,000 down to approximately 97,000, and then recovered slightly to the 98,000–99,000 zone.
2. Key Indicators Visible
Bollinger Bands (Purple Area)
Bands are relatively wide, suggesting increased volatility.
Price is near or below the middle band, indicating slight bearish pressure in the short term.
Moving Averages
There appear to be at least two commonly used MAs:
A shorter-term MA (possibly 50-period) in yellow/orange.
A longer-term MA (possibly 200-period) in blue.
The price has fallen below the shorter-term MA, which can be a short-term bearish signal.
The price is hovering around or slightly under the longer-term MA (the 200 MA in blue), which typically acts as a stronger support or resistance.
Volume Profile (SVP HD Up/Down)
Shows volume-by-price bars on the right side.
Notable high-volume nodes around 99,000–100,000, suggesting a strong interest level where price may consolidate or reverse.
Another cluster of volume near 97,000, possibly acting as short-term support if price revisits that zone.
Volume Bars (Below the Chart)
A significant spike in volume during the sharp move downward from ~102,000 to ~97,000.
Post-drop volume appears moderate, suggesting some stabilization but not an aggressive recovery.
3. Short-Term Momentum Evaluation
Price Action Relative to Moving Averages
Trading below the 50-period MA often indicates short-term weakness.
If the price fails to reclaim the 50 MA, the market may remain under bearish pressure for the next few candles (each candle = 30 minutes).
Bollinger Band Position
If candles close near or below the lower Bollinger Band, oversold bounces are likely but not guaranteed.
If candles remain compressed below the midpoint of the bands, it tends to confirm near-term bearish or sideways sentiment.
Possible Divergence Signals
Without direct MACD/RSI data on the screenshot, we rely on the advanced divergence indicator “MIS Adv Div.” If it’s showing bullish divergence (not fully clear from the image), there could be a short-term bounce. If it’s showing bearish continuation, the downward trend may persist.
4. Support and Resistance Levels
Immediate Resistance
Around 99,000–99,500: This area aligns with the lower side of a high-volume zone and the short-term MA.
Around 100,000–101,000: A psychologically significant level and also near the previous swing highs and volume node.
Immediate Support
Around 97,000: Where price found an initial bounce on the large sell-off.
Around 95,000: The next potential zone if 97,000 breaks.
5. Short-Term (Next 12 Hours) Price Outlook
Likely Scenario (Sideways to Slight Rebound)
The price may range between 97,000 (support) and 99,500 (local resistance).
If buyers step in at 97,000 again, expect a mild recovery toward the 99,000–100,000 region.
Bullish Breakout
If BTC reclaims the 99,500–100,000 zone with strong buying volume, it could target 100,500–101,000 next.
Watch for a 30-min candle close above the 50 MA to confirm potential upside momentum.
Bearish Continuation
If price fails to hold 97,000, a deeper retracement to 95,000 or lower may occur.
Sustained trading below the 200 MA would reinforce near-term bearish momentum.
Bitcoin (BTC/USDT) Analysis. BTC appears to be trading within an ascending channel. The chart shows a bullish medium-term structure.
The price is currently testing the lower trendline support within the channel.
A crucial support area is marked between $94,000 – $92,000 (green area). This is a crucial level for a bounce.
Any break below this support could invalidate the channel and lead to further upward pressure.
Resistance lies around $100,000 – $102,000 (orange area), which has been tested multiple times.
A breakout above this level could spark a bullish push towards the upper trendline of the channel or new highs.
For updates on other coins or personalized insights, feel free to reach out via DM.
@Peter_CSAdmin

Btc key levelesBtc key levels.
You want the price to stay above the heavy resistance and keep that as support.
Each level can reject to a new low or offer support and push the price up, or act as resistance and push it down a level.

Btc chart if this holds supportBtc chart if this holds support and trend continues.
Each level can reject to a new low. You want the breakout resistance to become support and that most likely will push Btc to sub target1 and target1.
If this will work out for you don`t ask me how I know :)) just tip me (I need to pay bills).

The greatest chart in Btc historyThe greatest chart in Btc history.
All key levels from 2020 till this day :)

Btc chart - circlesBtc chart done using circles.
The emoticons represent price targets, the red arches act as support and resistance once the price enters the area.

Btc long chartBtc long chart
Price is at breakout resistance. Any of the targets can reject to lower values.
If the bullish trendline is broken, usually the price value goes down.

No Words! BTC In DrawingsMajors scenarios.
Just one next LL, and BTC is done, bearish turn. Hongkong ETFs approval on Monday, hopefully next week give greens

BTC Rejected of Macro .618, Now What?So if we look at last cycles on Bitcoin and apply Fibonacci from bull cycle to bear market bottom, we have bear rallies to 0.618-0.66 area and then we reject and dump hard until halving and real bull cycle starts. We have seen the same, I had this plan since November. In my opinion most likely scenario now is slow bleed to the downside (not saying we won't have small bounces). February-March we go down and we have a huge buy opportunity for BTC and alts around 34-28k area. I'll start buying at 34 and will add to 28. I don't think we will close any daily candle below 28k.
This is just my opinion, for more you can visit: cryptoaliens.io

Phsychology number of price for bitcoin 40.000$*-Technical Analysis 📈
at price 27.000$ breaked and wont back to 27.000$ for start trend to 40.000$
*Trade (Buy) 📊
31.700$
*-Stop Loss 🔴
29.500$
*-Take Profit 🎯
40.000$
*-Risk Management 🚧
5%
👨🎓 Experience and Education: Our trading team has five years of experience in financial markets, especially cryptocurrencie

Bitcoin Weekly Overview With Possible 35K Touch!Bitcoin went and grabbed the liquidity of a weekly candle (at its top) and now its consolidating .could see 1 more liquidity grab to the upper side then starts to go to our first target 35.
also discussed about Continuation of this bullish move in the video.
Thanks for your support

Bitcoin Will Continue Consolidating And LiquidatingBitcoin still has liquidity to the both side to take, we could see another sweep to both upside and downside. with this much liquidity we might continue our consolidation untill a decrease in liquidity happens to make a major move.
Thanks for watching
