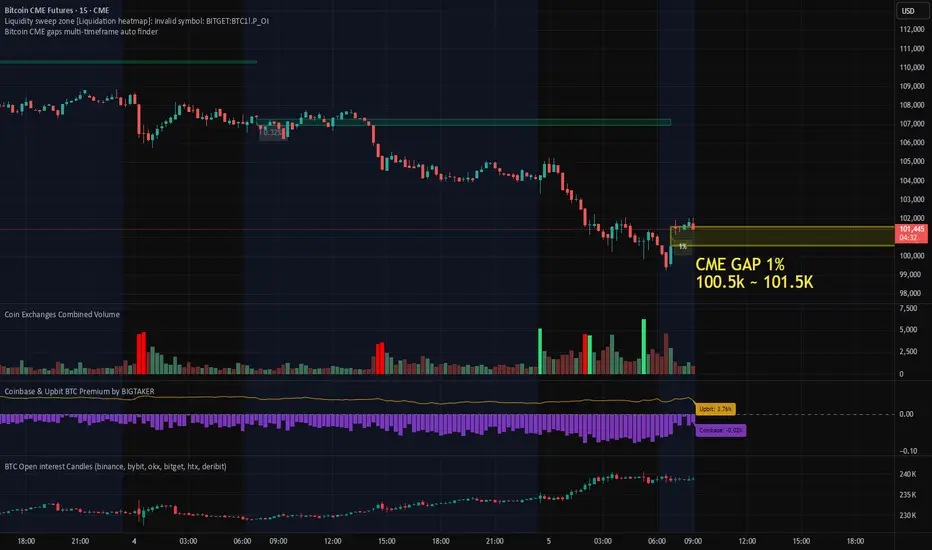
1% Bitcoin CME Gap Formed, Futures Market Data AnalysisThis morning, a ~1% gap formed on the Bitcoin CME futures chart.
Given that the gap occurred after a sharp decline, it’s important to consider the possibility of both a gap fill and a retest of recent lows in the short term.
The Coinbase Premium remains in negative territory, though it has shown slight improvement compared to yesterday, suggesting that U.S. spot selling pressure has somewhat eased.
In addition, Open Interest has increased, with data indicating a rise in short positions.
This suggests that selling pressure has been building during the recent decline, which may lead to a period of heightened short-term volatility and consolidation before the gap is fully filled.
Summary:
CME Gap Range: Approximately 1%
Market Structure: Short-term downtrend followed by consolidation
Coinbase Premium: Still negative, but slightly improved
Open Interest: Increasing (inflow of short positions)
📍In the short term, it is crucial to monitor whether the price enters the gap fill zone and retests the recent lows, while maintaining support at 98K, which remains a key short-term level.
Btccme
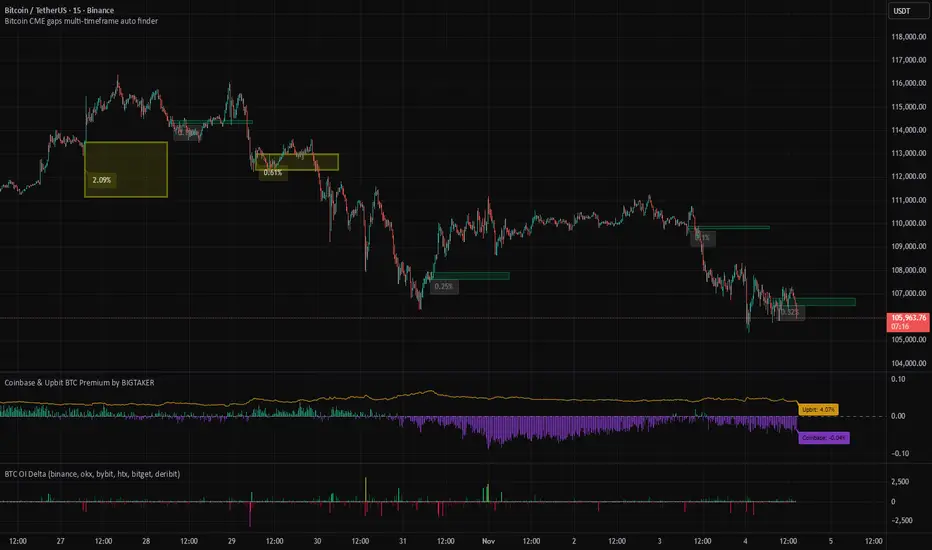
How to use bitcoin CME gap auto finder indicator on tradingview📊 Bitcoin CME Gap Auto Detection and Visualization Indicator
The Pine Script-based indicator Bitcoin CME gaps multi-timeframe auto finder is a TradingView tool designed for cryptocurrency traders and investors to automatically identify and visualize Bitcoin CME (Chicago Mercantile Exchange) futures market gaps across multiple timeframes.
The Bitcoin CME futures market often creates price gaps after weekends or holidays when trading resumes. These gaps typically represent market imbalances, and many traders believe that price levels where gaps occur are likely to be revisited in the future.
This concept is known as the "Gap Fill" theory, where such gaps are considered key price zones that may act as support or resistance levels.
Traditionally, manually identifying these gaps requires checking multiple timeframes and verifying weekend/holiday sessions, which is both tedious and time-consuming.
Indicator Link: Bitcoin CME gaps multi-timeframe auto finder
🔑 Key Features of the Indicator
Automated Gap Detection: Saves traders the time and effort of manually searching for and marking gaps.
Cross-Exchange Synchronization: CME gap boxes are displayed in sync on other Bitcoin charts such as BTCUSDT, BTCUSDT.P, and BTCUSD.
Multi-Timeframe Analysis: Displays gaps simultaneously across various timeframes (5m, 15m, 30m, 1h, 4h, 1D), providing multiple market perspectives.
Visual Clarity: Clearly highlights gap zones, with major gaps emphasized for quick trader recognition.
Strategic Trading Support: Provides essential information for developing and executing gap fill-based trading strategies.
CME Gap History: Allows users to review all past CME gaps formed in historical candles.
Alert Functionality: Sends real-time notifications when new gaps are detected, helping traders respond promptly to market changes.
⚙️ Main Functions and Usage
This indicator provides a wide range of customizable input options, allowing traders to adapt it to their specific analytical needs.
CME Gap Settings:
CME Symbol for Gaps: Specifies the symbol used to fetch CME futures data. The default is “BTC1!” (Bitcoin CME Futures).
Minimum gap percentage (%): Sets the minimum price movement recognized as a gap, allowing users to filter out minor fluctuations and focus on significant ones.
Display Timeframes:
Enables or disables gap visualization for each timeframe (5m, 15m, 30m, 1h, 4h, 1D). Users can activate only the timeframes they prefer to analyze.
Box Colors:
Customizable colors for each timeframe and gap direction (upward/downward), allowing easy visual distinction between gap types.
Box Extension Lengths (Bars):
Sets the number of bars the gap box extends to the right for each timeframe.
This visually illustrates how gap zones can remain relevant as future support/resistance levels.
Label Settings:
Show labels: Toggles the display of percentage labels for gaps.
Label position: Adjusts where the label appears inside the box.
Label text size: Controls the label font size.
Highlight Settings:
Highlight gap % (>=): Emphasizes gaps larger than a specified percentage, providing visual alerts for major gaps.
Highlight label text color: Sets the text color for highlighted gap labels.
Highlight box color: Defines the color for highlighted gap boxes.
Highlight box border width: Adds adjustable border thickness to highlighted gap boxes, making significant gaps stand out even more.
Alert Settings:
Enable Alerts: Toggles alert activation when gaps occur.
Alert Timeframe: Choose specific timeframes for receiving alerts or enable alerts for all timeframes.
🚀 How It Works
The indicator retrieves CME futures data (BTC1!) and compares the previous bar’s close/high/low with the current bar’s open across multiple timeframes to identify gaps.
It is specifically designed to detect gaps that occur when the market reopens after weekends or holidays.
Once a gap is detected, the indicator draws a box to visually mark it on the chart.
If the gap size exceeds the user-defined threshold, the box is emphasized using a highlight color and thicker border for greater visibility.
💡 Trading Strategies and Applications
Support and Resistance Identification:
CME gap zones often act as strong support or resistance levels.
Unfilled gaps may indicate potential price return zones, serving as signals for possible reversals or trend continuation.
Gap Fill Strategy:
Many traders believe that gaps tend to be filled eventually.
This indicator can help identify potential entry and exit points for gap fill trades.
For example, after a downward gap, traders might consider entering a long position when the price begins to recover toward the upper boundary of the gap and close the trade once the gap is filled.
Market Sentiment Analysis:
The size and frequency of gaps can reflect strong market movements or uncertainty.
Large gaps often indicate intense buying or selling pressure, and highlighted gaps help quickly identify these significant market events.
Multi-Timeframe Confirmation:
When gaps occur simultaneously across several timeframes, it underscores the importance of that price zone.
For instance, if a gap appears on both the 1-hour and 4-hour charts, traders should pay close attention to potential price reactions at that level.
Opportunity Detection via Alerts:
By enabling alerts, traders can monitor market changes in real time and act immediately when new gaps form — particularly useful for short-term or high-frequency strategies requiring fast decisions.
🚨 Cautions
Gap fills are not guaranteed: While gaps often tend to be filled, not all of them will, and some may take a long time.
Time zone configuration: Since the CME operates in specific trading hours, make sure the indicator’s GMT+9 timezone matches your local trading setup on TradingView.
Avoid using in isolation: Combine this indicator with other technical tools (e.g., moving averages, RSI, volume indicators) to enhance reliability and accuracy.
※ If you found the Bitcoin CME gap auto finder indicator helpful, please give it a like and follow.
Bitcoin – The Hinge of $108K: CME Gaps Define the Path.⊣
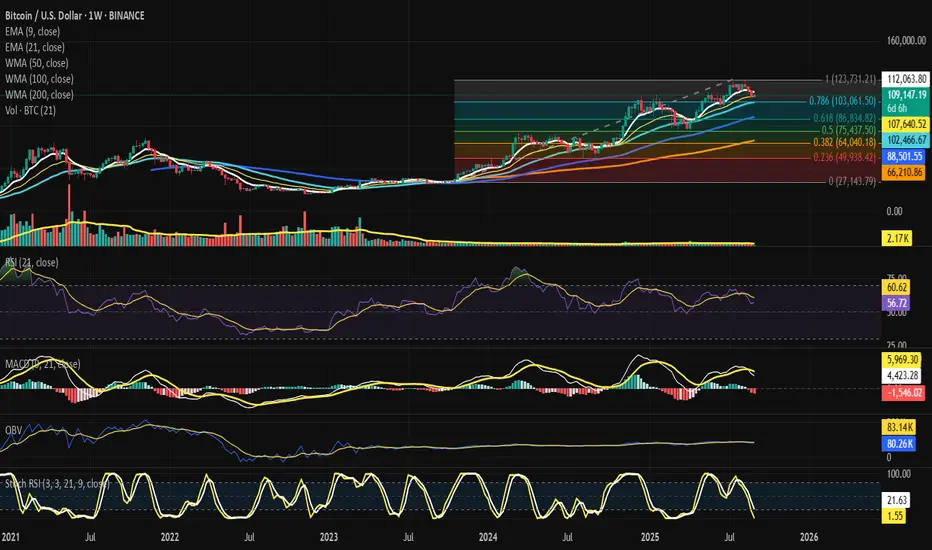
⟁ BTC/USD – BINANCE – (CHART: 1W) – (Sep 01, 2025).
◇ Analysis Price: $108,883.16.
⊣
⨀ I. Temporal Axis – Strategic Interval – (1W):
▦ EMA9 – $112,010.99:
∴ Price trades below EMA9, confirming weekly short-term weakness;
∴ Acts as dynamic resistance aligned with rejection candles;
∴ Bulls require a weekly close > EMA9 to regain strength.
✴️ Conclusion: EMA9 = first ceiling for recovery.
⊢
▦ EMA21 – $107,616.51:
∴ Price currently rests just above EMA21;
∴ EMA21 aligns with tactical support after EMA9 loss;
∴ Confluence with local structure reinforces as battle line.
✴️ Conclusion: EMA21 = current pivot, decisive for weekly trend.
⊢
▦ WMA50 – $102,456.32:
∴ Converges with Fib 0.786 ($103,061);
∴ Forms heavy support cluster;
∴ Break below exposes deeper retracement zones.
✴️ Conclusion: WMA50 + Fib 0.786 = structural shield.
⊢
▦ WMA100 – $88,496.32:
∴ Mid-term support level, far from spot;
∴ Safety net below Fib 0.618 ($86,834);
∴ Historical pivot in previous cycles.
✴️ Conclusion: WMA100 = mid-term structural base.
⊢
▦ WMA200 – $66,208.23:
∴ Ultimate macro support far below current action;
∴ Defines secular trend;
∴ Bears unlikely to reach without systemic capitulation.
✴️ Conclusion: WMA200 = macro foundation.
⊢
▦ RSI (21, close 9) – 56.57 / 60.59:
∴ RSI above 50 = positive bias, but descending from prior highs;
∴ Momentum weakening, approaching neutrality;
∴ No bullish divergence formed yet;
✴️ Conclusion: RSI fading, still positive but fragile.
⊢
▦ MACD (9,21,9) – Line: 4,394.48 / Signal: 5,963.54 / Histogram: –1,569.06:
∴ Bearish crossover confirmed;
∴ Histogram negative, momentum shifting bearish;
∴ Weekly timeframe signals mid-term risk.
✴️ Conclusion: MACD = bearish transition underway.
⊢
▦ OBV + EMA9 – OBV: 83.14K / EMA9: 80.26K:
∴ OBV above EMA9, reflecting prior accumulation;
∴ No expansion, flattening trajectory;
∴ Suggests distribution/neutral flows.
✴️ Conclusion: OBV steady but not supportive.
⊢
▦ Stoch RSI (3,3,21,9) – K: 1.09 / D: 21.48:
∴ In deep oversold (<20);
∴ Early cross attempt between K and D;
∴ Relief rally possible, not yet confirmed.
✴️ Conclusion: Oversold condition signals potential bounce.
⊢
▦ Fibonacci Retracement (0 = 27,143 -> 1 = 123,731):
0.786 -> $103,061 (≈ WMA50);
0.618 -> $86,834 (≈ WMA100);
0.500 -> $75,437;
0.382 -> $64,040;
0.236 -> $49,938.
✴️ Conclusion: $103k region = confluence fortress; loss exposes $86k.
⊢
🜎 Strategic Insight - Technical Oracle:
∴ The weekly structure is compressed between EMA9 ($112K) above and EMA21 ($107.6K) below, defining a narrow battlefield;
∴ Momentum tools diverge: RSI (56.6) still positive yet fading, while MACD confirms a bearish crossover, and Stoch RSI drifts in oversold territory;
∴ The confluence fortress at $103K (Fib 0.786 + WMA50) stands as the decisive defense; its loss would unlock the mid-cycle retracement path toward $86K (Fib 0.618 + WMA100);
∴ OBV above EMA9 indicates prior accumulation, but its flattening betrays absence of new inflows.
✴️ Conclusion: The weekly oracle confirms structural fragility: upside recovery demands a close >$112K, while downside destiny pulls toward ($103K if $107.6K) fails.
⊢
▦ CME Gap Analysis:
⌖
∴ CME daily chart highlights an open gap region in the ($112K -> $114K) zone - (from recent downside break);
∴ Historically, CME gaps tend to close with high probability, especially within 1–3 weeks;
∴ Current price ($109.4K) rests below this gap, leaving upside magnetism;
✴️ Conclusion: CME gap above acts as a gravitational pull; if price stabilizes >$108K, probability favors retrace into ($112 / $114K).
⊢
▦ Lower Gaps (Unresolved):
∴ Historical CME structure also leaves unfilled gap at ($103 / $104K) - (aligned with Fib 0.786 + WMA50 from weekly);
∴ This acts as downside magnet if $108K support fails;
∴ Market may oscillate between these dual magnets: ($103 / $104K) below, ($112 / $114K) above.
✴️ Conclusion: Dual CME gaps frame near-term battlefield; direction depends on structural defense of $108K.
⊢
𓂀 Stoic-Structural Interpretation – (BTC/USD + CME) - (Sep 01, 2025):
∴ Structure of Spot: Bitcoin clings to the Fib 0.382 ($108K), where the weekly EMA21 ($107.6K) marks the hinge of destiny. Above, the barrier of EMA9 ($112K) looms, resisting all relief. Below, the WMA50 + Fib 0.786 ($103K) stands as the fortress, the last shield before deeper descent;
∴ Structure of CME: The futures chart reveals the voids - an unclosed gap above ($112–114K) and another below ($103–104K). These voids are gravitational wells, pulling price toward their closure. Spot and CME converge: what the candle structure outlines, the gaps confirm.
∴ Momentum of Will: Indicators bear the stoic seal of decline. RSI fades from strength, MACD crosses bearish, and OBV flattens, whispering of distribution. Yet the Stoch RSI oversold breathes the faint promise of reprieve - not salvation, but respite.
∴ Fate of Flow: On-chain discipline shows no panic, whales remain silent; it is structure, not capitulation, that bends the market’s will. Thus, the battlefield is defined not by chaos but by the calm inevitability of compression between supports and voids.
✦ Structure Thus:
∴ Hold above $108K -> the path opens to the CME gap above ($112 / $114K), a short-term redemption;
∴ Fail below $107K -> the market is drawn into the CME gap below ($103 / $104K), aligning with the weekly fortress.
✴️ Conclusion: Bitcoin stands suspended between two voids - a promise above, a threat below. The stoic essence demands patience: fate will be decided by which gap the structure surrenders to first.
⊢
· Cryptorvm Dominvs · MAGISTER ARCANVM · Vox Primordialis ·
· Dominivm Cardo Gyratio Omnivm · Silence precedes the next force. Structure is sacred ·
⊢
BTC CMECRYPTOCAP:BTC CME :
If it couldn't break the channel it will be drop to 95k or fib 0.382.
so it's better to be careful guys.

Bitcoin reversal confirmed ?!Bitcoin reversal confirmed ?! 👀
I would like to present you some charts with important levels and relevant patterns.
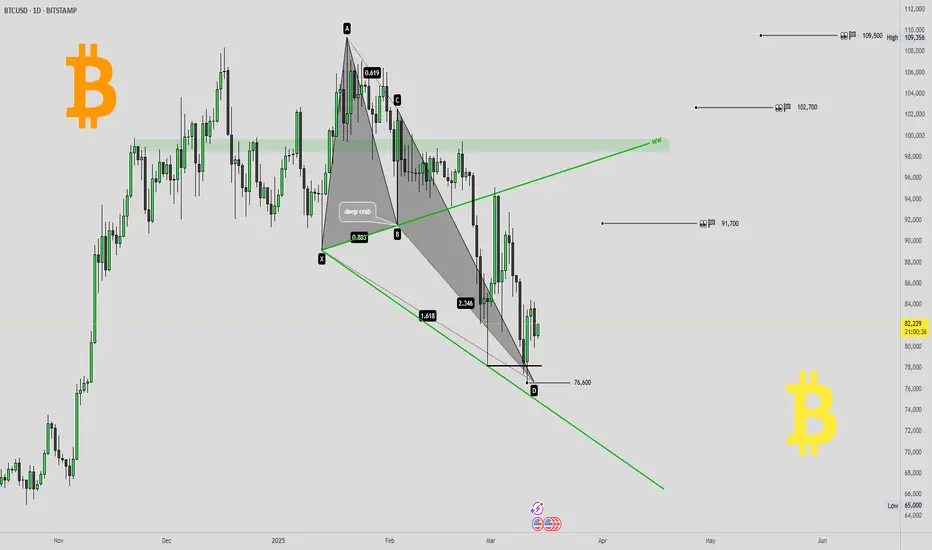
🖥daily-chart (BITSTAMP) and 💡everything important in the chart 👀
💥Here in the daily chart (BITSTAMP)
- a Deep-Crab harmonic with
- a WolveWave
and the daily-chart of the
🔥Daily MA200 re-test 👀
- gap fill
- support-line 2022 and 2024 TOPs
👉 BITCOIN roadmap/outlook (from 27th february 2024) 💡
🎯 If you like this idea, please leave me a 🚀 and follow for updates 🔥⏰
Furthermore, any criticism is welcome as well as any suggestions etc. - You're also very welcome to share this idea.
Have a nice evening & successful trading decisions 💪
M_a_d_d_e_n ✌
NOTE: The above information represents my idea and is not an investment/trading recommendation! Without any guarantee & exclusion of liability!
Bitcoin: The CME Futures PREMIUM, New All-Time High ConfirmedOk, you got me, I will reveal my secrets to you. I only do this because I love you and I want to give you true value. Great content that you can truly trust because it is based on real market data. Just watch!
» Bitcoin CME Futures price: $104,425 (BOOM!)
» Bitcoin BTCUSDT Spot price: $103,600 (Checkmate)
There is a premium on Bitcoin futures price. This means the market is bullish, plain and simple. You can bet your house, a hotel and your wife on the fact that Bitcoin will soon hit a new All-Time High.
The signals are in.
You can fight me in the comments section or you can simply agree and follow me.
Namaste.

A New ( But small ) Bitcoin CME Gap has arrivedDue to price rise in Bitcoin over the weekend, we have just opened up a new Bitcoin CME Gap.
ALL previous Gaps are Filled.
CME GAPS ALWAYS GET FILLED
So, we may see PA return to fill this gap.
the only time Gaps do not get filled is when in a Major Bull Run
We are not in one yet.
These are excellent places to put buy orders.

Bitcoin CME Gaps Wars UPDATEThat Gap that opened up so quickly over the weekemd...Nearly Full
I cannot wait to see which direction PA goes when we hit the Bottom of the Gap at around 85700
On a Short tem, PA has hit Support..........All eyes on the Gap

BTC CME GAPS (4H)Bitcoin has two gaps on the CME chart.
The first gap has been filled. There’s another gap at $77,000, and it remains to be seen whether this gap will be filled before the price moves higher or if it won’t be filled anytime soon.
Currently, it's the end-of-year holiday season, trading volume has decreased, and we are observing dumps and pumps within a range-bound movement.
For risk management, please don't forget stop loss and capital management
Comment if you have any questions
Thank You

Let's update our #Bitcoin #CME 1D chart;Let's update our #Bitcoin #CME 1D chart;
If you remember, I last shared a chart on 24.07.2024 that there could be a 30% decline on the Bitcoin side and that a Bullish formation structure would start from these levels.
In the meantime, I have always voiced the danger of the gap it leaves behind as it rises.
While filling the gap, it left a new gap at the same level (in the 60k band). We can consider this positive as it remains above.
We can say that the decline is not yet complete and we could see another decline of around 12% from the current level due to the pullback.

Bitcoin CME Gaps get filled normalyALWAYS look at the CME chart
BITCOIN CME GAPS
The Daily chart shows us one that is still open and down to 58900
For me, this is HIGHLY likely to get filled
So, SPOT BUY order placed at 59K ( not advice, just what I have done ) - Lets see if it gets filled.
What this highlights is simply that the CME is a Major player now. Look at the previous gaps that have been filled
It has the LARGEST share of FUTURES trades in the 'Bitcoin environment", overtaking Binance earlier in the year.
It HAS the power and it WILL use it.
We just have to play along, be smart and understand that most of the time, GAPS get filled. Knowing this can give you very good buying opportunities.
Just be careful when the bull run hits....they may get left behind till the Bear market hits...THEN the Gaps can give us ideas of retracement levels to come.
Lets see how thins plays out

BTC CME ANALYSISThis is the CME chart where we can see the Bitcoin GAPs.
In the range of 66360 - 64190 we have a GAP that may be filled.
We have also had a bearish CH and the price has reached supply.
If the gap fills up, it's a good time to look for buy/long trades

Bitcoin 1 hour chart CME Gap to be Filled.#Bitcoin 1 hour CME Gaps chart
Could not post this the other day was was away but Here you go
We created a CME Gap on 22 March
This is noe being Filled, as it must or the CME ( Chicago Mercantile Exchange CME) losses money on its Futures trading.
80% of the Time, GAPS get filled.
Set a limit Buy order at 63K and the chances are it will get filled.
So far, since 2021, every gap has been filled. End of.

BTC CME GAP- Just posting to monitor the new gap.
- Not an Analysis.
- This new gap can be taken back fast or can be taken back later at next bear market.
- The Legend of the Gap.
Happy Tr4Ding !

BTC CME gaps to be filled We are entering an important zone ➡️ above previous high and around 0.5fib...
Let's wait and see if we support or lose the R/S line. When lose, I close my long CRYPTOCAP:BTC position and start to look for short setups... If we support, we will continue 🐨
Be alert...
#trading #bitcoin

BTC WITH ELLIOT WAVE, CME GAP, AND FIBONACCIBTC/USDT BTC1!
BTC WITH ELLIOT WAVE
NOW BTC IN CORRECTION WAVE
You can guys can choose
Long : we can entry in fibonacci cluster 19.210
Short : We wait BTC finish the wave B correction
BTC still drop again, because CORRECTION WAVE NOT FINISH
This my idea, hope can help you guys
Thanks before!


BTC CME FUTURES 3day 100ema/200ema Bear CrossBTC CME FUTURES
3day 100ema/200ema Bear Cross
A break of local lows on BTC I am looking for next leg down 14.6 / 13170 - then lower to fill all CME Futures gaps down to 9700

$BTC - CME Macro 3D Elliott Wave Update $BTC - Macro Chart. Ending diagonal is starting to print out on the larger TFs. The most harmonious chart I've found is on the 3D where you can imagine the curving towards the end of C. Lots of confluence for a bounce just around 17k, including a gap from late 2020, previous resistance all the way back in 2018 and more recently, a bounce from late 2020 once again.
fib extension with those numbers gives us a 1.618 target for wave iii around 125k. This is obviously all very hypothetical and will need to be re-evaluated once the bottom is found, if it hasn't been found already.
This is my main macro count. I have an alt count where the correction could span a few more years (this being only wave C of A).
Trade safe.

BTC Futures
BTC Futures 4HR Chart, we have 2 more hours for the next candle to close. Spot looks bullish but still waiting.

BTC CME an interesting patternLast night I was looking into BTC to short my position and my eyes bumped into this interesting pattern.
So whenever BTC made a gap in bearish wave/impulse. That wave ride upto 54-60% everytime.
I saw this 3 times already and this is happening now at the moment of writing too.
And what make it more interesting is which happened first time there are two gaps in a bearish impulse.
So if we calculate the 60% drop it get us a target of 12680 and the last gap of CME is at 9735 maybe a sudden wick and it will be closed.

$BTC CME - Gap Created. Good signs for a bounce, alts. I had a bias of BTC going back up to reclaim 35k at the very least before laying eyes on this chart.
From an EW perspective, we had previously drawn a shallow 2, and a deep wave 4.
Now if we dive into the subwaves of this wave 5, I feel like wave 3 could be finished and we need to go up and fill that gap to play out wave 4.
Safe trades to all.

BTC CME futures Analysis #BTC CME
$BTC Finally Big Gap filled at $26.625 - $24.100 . any last gap bottom at $19.110 - $18.395 area at the time thiz zone last peak support all time high BTC before . if we see the market potential visit and close the gap
