#BTC/USDT Let Bitcoin make a new ATH#BTC
The price is moving within a descending channel on the hourly timeframe. It has reached the lower boundary and is heading towards a breakout, with a retest of the upper boundary expected.
The Relative Strength Index (RSI) is showing a downward trend, approaching the lower boundary, and an upward bounce is anticipated.
There is a key support zone in green at 92445. The price has bounced from this level several times and is expected to bounce again.
The indicator is showing a trend towards consolidation above the 100-period moving average, which we are approaching, supporting the upward move.
Entry Price: 89286
First Target: 90011
Second Target: 91141
Third Target: 92445
Stop Loss: Below the green support zone.
Don't forget one simple thing: Money Management.
For any questions, please leave a comment.
Thank you.
Btcethusdt

#BTC/USDT is currently strongly bullish#BTC
The price is moving in a descending channel on the 1-hour timeframe. It has reached the lower boundary and is heading towards breaking above it, with a retest of the upper boundary expected.
We have a downtrend on the RSI indicator, which has reached near the lower boundary, and an upward rebound is expected.
There is a key support zone in green at 86900. The price has bounced from this level multiple times and is expected to bounce again.
We have a trend towards stability above the 100-period moving average, as we are moving close to it, which supports the upward movement.
Entry price: 87844
First target: 88166
Second target: 88596
Third target: 89133
Stop loss: Below the support zone in green.
Don't forget a simple thing: capital management.
For inquiries, please leave a comment.
Thank you.

#BTC/USDT is currently strongly bullish#BTC
The price is moving in a descending channel on the 1-hour timeframe. It has reached the lower boundary and is heading towards a breakout, with a retest of the upper boundary expected.
We are seeing a bearish trend in the Relative Strength Index (RSI), which has reached near the lower boundary, and an upward bounce is expected.
There is a key support zone in green at 88200, and the price has bounced from this level several times. Another bounce is expected.
We are seeing a trend towards stabilizing above the 100-period moving average, which we are approaching, supporting the upward trend.
Entry Price: 88900
First Target: 90000
Second Target: 91123
Third Target: 92300
Remember a simple principle: Money Management.
Place your stop-loss order below the green support zone.
For any questions, please leave a comment.
Thank you.

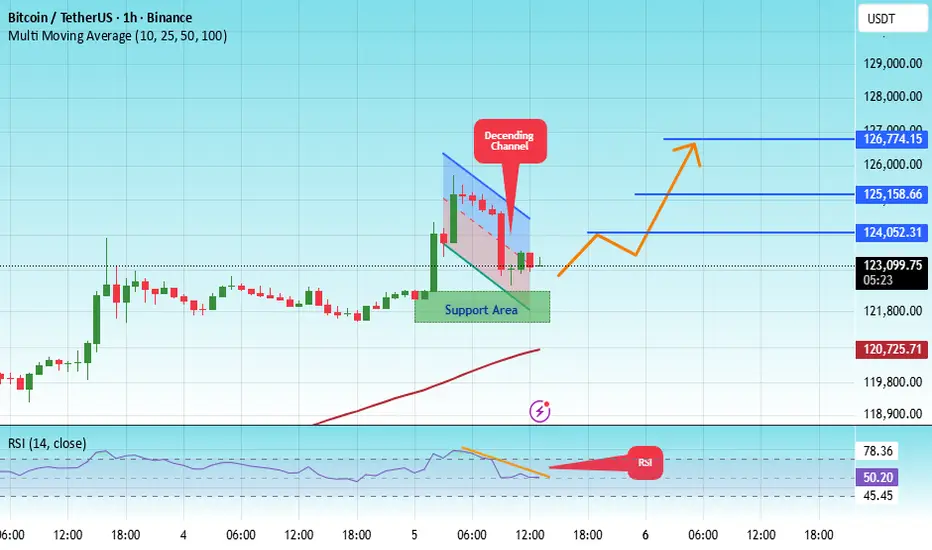
#BTC/USDT Let Bitcoin make a new ATH#BTC
The price is moving within a descending channel on the 1-hour frame, adhering well to it, and is heading for a strong breakout and retest.
We have a bearish trend on the RSI indicator that is about to be broken and retested, which supports the upward move.
There is a major support area in green at 121900, which represents a strong support point.
We are heading for consolidation above the 100 moving average.
Entry price: 123300.
First target: 124050.
Second target: 125160.
Third target: 126774.
Don't forget a simple matter: capital management.
When you reach the first target, save some money and then change your stop-loss order to an entry order.
For inquiries, please leave a comment.
Thank you.
#BTC/USDT Bullish Divergence on 1H, Low Risk Trade#BTC
The price is moving within a descending channel on the 1-hour frame, adhering well to it, and is poised to break it strongly upwards and retest it.
We have a bearish trend on the RSI indicator that is about to be broken and retested, supporting the upside.
There is a major support area in green at 108062, which represents a strong basis for the upside.
For inquiries, please leave a comment.
We are in a consolidation trend above the 100 Moving Average.
Entry price: 108450
First target: 108959
Second target: 109541
Third target: 110325
Don't forget a simple matter: capital management.
When you reach the first target, save some money and then change your stop-loss order to an entry order.
For inquiries, please leave a comment.
Thank you.

#BTC/USDT#BTC
The price is moving in a descending channel on the 1-hour frame and sticking to it well
We have a bounce from the lower limit of the descending channel, this support is at 66900
We have a downtrend, the RSI indicator is about to break, which supports the rise
We have a trend to stabilize above the moving average 100
Entry price 68800
First target 69764
Second target 71385
Third target 73266

#BTC/USDT#BTC
The price has broken the descending channel on the 12-hour frame upwards and is expected to continue
We have a trend to stabilize above the moving average 100 again
We have an upward trend on the RSI indicator that supports the rise by breaking it upwards
We have a support area at the lower limit of the channel at a price of 53000
Entry price 62000
First target 65240
Second target 69200
Third target 73600

#BTC/USDT#BITCOIN
Bitcoin is moving in a descending channel on the 4-hour frame and the price has reached a strong support area in green at $57,200
There are rising loads from the current support level but it needs upward momentum to be able to reach the targets
Entry price $58,000
First target $60,257
Second target $62,236
Third target $64,000
The pattern is canceled if the support level in green at $57,200 is broken
In that case, the price will be heading to $54,100, which is a strong support level

#BTC/USDT
#BTC
#BITCOIN
The price is moving in a descending channel on the 1-hour frame and is adhering to its borders well. The price reached the upper limit of the channel and closed above it, which supports the rise.
The price also touched the 100 moving average and is expected to rebound from it.
The price is now at $59,200, which is the entry price.
The first target is $60,000.
The second target is $61,200.
We have a downtrend on the RSI, but from

#BTC/ETH#BTC
#BITCOIN
The price is moving in a descending channel on the 4-hour frame and is adhering to its limits well, and the price has reached the upper limit of the channel
The price is now $22.40, which is the entry price
Targeting the $21.50 area, which is the lower limit of the channel
There is a strong resistance point at the upper limit of the channel that supports the decline
We have a trend-hop on the RSI indicator, but more declines are expected on it

#BTC/USDT#BTC
#BITCION
The price is moving in a descending channel on the 4-hour frame and is adhering to its limits well
The current price is $59,102. It is expected to fall to touch the lower limit of the channel at $57,700, which is the entry price
There is a strong support point at this level, green
Targeting the upper limit of the channel at $60,000
This boot supports the lower limit as we are still below the moving average 100
But what supports the rise after touching the lower limit is the presence of an upward trend on the RSI

#BTC/USDT#BTC
Bitcoin
The downward channel has been clearly broken on today's frame
It is expected to touch $48,000 before the recovery and rebound begins
We have a sell saturation on the RSI indicator
We have a trend to return above the moving average 100 again
We have a strong support extending from $48,000 to $50,000
A rebound is expected from that area targeting
First target 53,800
Second target 57,300

ETH vs BTC? It depends: See why!The TPI (Trend Probability Indicator) tells you if the trend of an asset-class or commodity is bearish or bullish.
It has values that range from -1 to +1, where -1 is bearish, and +1 is bullish.
Values between -0.2 - 0.2 are neutral, and we expect market to be ranging and mean reverting at that TPI score.
The TPI works on all timeframes above the 4H timeframe. I use it to manage a modern portfolio where I use longs and shorts. Here is how I try to mitigate my risk, and maximize my profits by for example reading when ETH will out/underperform BTC.


ETH/USDT 1DAY UPDATE BY CRYPTOSANDERSHello dear traders, we here new so we ask you to support our ideas with your LIKE and COMMENT, also be free to ask any question in the comments, and we will try to answer for all, thank you, guys.
ETH/USDT UPDATE:-ETH was supported by the ascending line (in green) again, and increased investor confidence prevented the price from closing below it. The chart currently shows no notable signs of bullish momentum as the sideways trend continues for a second week.
The first obstacle is to break $1,500. (in red). This resistance results from the descending line (in yellow) and the 100-day moving average line (in white) colliding. If the ETH can clear this hurdle, the path to $2000 will be clearer.
As long as Ethereum trades below $1,500, a retest of the green support is not ruled out. Closing below this level may take the asset to the next support level at $1,000.
Sorry for my English it is not my native language.
Hit the like button if you like it and share your charts in the comments section.
Thank you

#BTC/USDT 15MINUTE UPDATE Welcome to this quick BTC/USDT analysis.
I have tried my best to bring the best possible outcome in this chart.
BTC/USDT dump and retest down green zone
$28500,$28800 buying zone, and stop-loss $28000
and target $30300,$30700
Remember:-This is not a piece of financial advice. All investment made by me is at my own risk and I am held responsible for my own profit and losses. So, do your own research before investing in this trade.
Sorry for my English it is not my native language.
Do hit the like button if you like it and share your charts in the comments section.
Thank you...

#BTCUSD ❕ SUPPORT ZONEHello, dear traders welcome you to this BTC /USDT 30M chart analysis.
Hello dear traders, we here new so we ask you to support our ideas with your LIKE and COMMENT, also be free to ask any question in the comments, and we will try to answer for all, thank you, guys.
Bitcoin is trading above the liquidity level in the Support area.
Prices broke the downside limit on declining volume and went back up on rising volume.
Fixed above 50MA on 30m time frame.
I expect the price to turn down from the current triangle but reverse once it recovers above the support level.
Remember:-This is not a piece of financial advice. All investment made by me is at my own risk and I am held responsible for my own profit and losses. So, do your own research before investing in this trade.
Thanks for your time, we hope our work is good for you, and you are satisfied, we wish you a good day and big profits.
THANK YOU.

BTC/USDT 4HOUR UPDATE Welcom to this quick btc/usdt analysis.
I have tried my best to bring the best possible outcome in this chart .
btc is support 48.1k, and resistsnce and 49.5k. Resistance break and retest49.5k. above 52.8k today target.
Let,s see how the 4 hour closes.
i thing the price cam pump fore here .
if the breaks below the price 47.3k$
the chart will becouse inalid.
Sorry for my english it is not my native languages.
Do hit the like button if you like it and share your charts in the comments section.
Thank you...

Btc/usdt 4hour update Btc/usdt update.
Btc is bullish and day closing 48495$ and after retest 45600$ btc next target 53000$ ..
Thank you...

Btc/usdtBTC 4 hour short time analysis BTC resistance 45560 dollars resistance this break and support level 43800 dollars and 43 500 dollar Bitcoin!

