BTC Update: Chop, Chop, Chopping Wood. Don't get shaken out. BTC Update: Price is doing exactly what I was expecting after the prior expansion phase - chopping and grinding rather than resolving immediately. Despite the growing panic and bearish sentiment, the market has not seen a true downside flush yet. From a structural perspective, this still looks like a higher timeframe consolidation rather than a full trend breakdown.
On the weekly, BTC remains above major cycle support, and the recent weakness appears more corrective than impulsive. Historically, these types of ranges tend to resolve with one final liquidation move to reset positioning. I’m still watching for a sharp downside extension into the ~$70k region, which would represent a deeper test of higher timeframe demand and a more complete sentiment washout.
What stands out most right now is sentiment. Fear has escalated quickly relative to actual structural damage, which is typically what you see before a final flush, not after one. Until that move happens, I expect continued volatility and frustration as the market works through excess leverage.
Assuming a proper reset plays out, this would likely set the stage for a cleaner continuation higher into early next year. For now, patience is key - this phase is about letting the market finish its reset before the next sustained leg develops.
Btcidea

BTC/USDT Weekly AnalysisBitcoin is currently in a corrective phase after a strong weekly sell-off.
Price has a clear Weekly Fair Value Gap (FVG) sitting around the previous weekly high in the 95k–97.5k area.
📌 Technical idea:
Price could retrace back into the weekly FVG to rebalance inefficiency and grab liquidity above the previous weekly high.
After tapping that zone, a bearish reaction is expected.
Final target is the previous weekly low, where major liquidity rests.
📍 Key levels:
Weekly FVG zone: 95,000–97,500
Liquidity grab above previous weekly high
Target: previous weekly low around ~75,000
🎯 Bias: Bearish after mitigation

BTC Bullish Shark Pattern: DCB or Moon?BTC 1W – Bullish Shark forming. After the ‘total unload’ and a potential liquidity sweep into the 2022 lows (final D leg), I’m looking for the ultimate reversal that could launch the new epic parabolic leg toward 100k+ and a full‑blown altseason
Market stays bullish if this pattern fails to play out in the DCB zone

BTCUSDT - What's Next? Bullish is over???BTC Daily & 4H Outlook
Bitcoin is showing mixed signals across the 1D and 4H timeframes. On the daily chart, BTC failed to hold the strong support zone and has now officially flipped it into a resistance. The drop also swept liquidity down to the 80.600 area before rebounding from the daily OB, which gives us a temporary relief bounce. Right now, price is pushing upward and may retest the resistance/supply zone above.
If BTC rejects strongly from that resistance, the market could be in trouble again because the downside target reopens toward the 83k–86k region. This area becomes even more important when we look at the 4H chart, where we still have a key support between 85.650–85.000. This zone must hold—if it breaks, then 83k becomes likely, and a worst-case scenario returns us to the 80k sweep zone.
For BTC to reclaim momentum and shift into a bullish structure, the market needs to break out above the major supply at 93.240. A clean breakout and confirmation would show strength and could trigger the next leg toward 98k–100k. If that happens, we may also see a strong positive impact on altcoins.

BTC/USD: Testing Key Support (M/FVG) After Strong DowntrendKey Observations
Downtrend: The price has been moving lower, defined by the downward-sloping black trendline, indicating a period of bearish momentum.
Break of Structure (BOS): A "BOS" (Break of Structure) label is placed below a recent low, confirming the continuation of the bearish structure as the price moved lower.
Current Support Zone: The price is currently testing a significant support zone (the grey rectangular box) around the $96,000 - $98,500 area. This level appears to be a historical reaction zone.
Market Structure/Fair Value Gap (M/FVG): The support zone is also labeled as "M / FVG" (Likely Mitigation or Market Structure combined with a Fair Value Gap), suggesting this area holds significance for potential institutional/smart-money activity.
Future Scenarios (Projected Paths):
Scenario 1 (Black Arrow): The main projected path shows a potential bounce/reversal from the current support zone, aiming to push the price higher. This suggests a buy/long opportunity might be imminent if the support holds.
Scenario 2 (Curved Arrow): The alternative (and often less-likely, as it's secondary) projection suggests a continuation of the downtrend after a potential minor bounce or consolidation, indicating a break below the support zone and further declines.

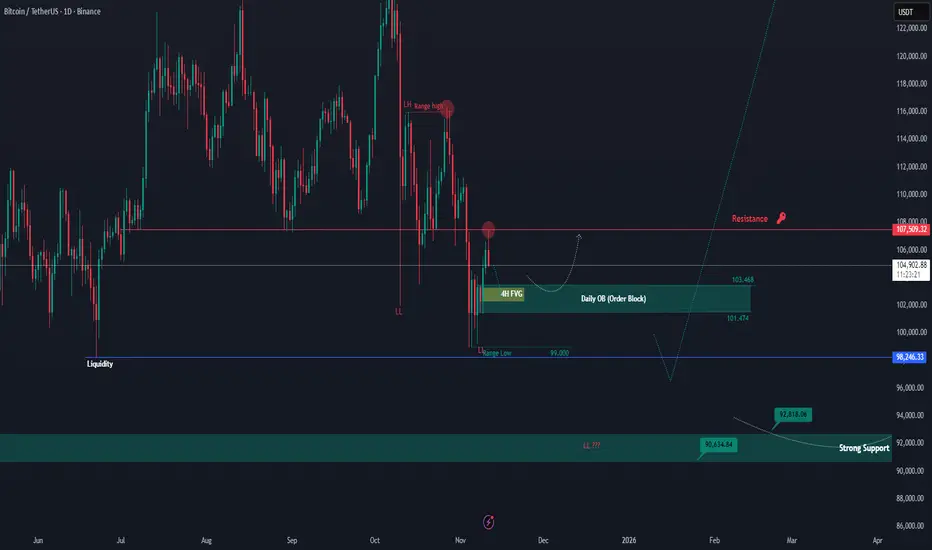
BTCUSDT – Retesting Key Levels After Resistance RejectionAs expected, BTC successfully closed above the $100K mark on the daily timeframe and moved up to retest the major resistance zone around $107,500. However, the price faced a clear rejection from this level, confirming that it remains a strong resistance area which Bitcoin must break to resume its upward momentum toward $110K–$112K.
Currently, BTC is showing signs of a potential pullback toward the Daily Order Block (OB) area near $103K–$101K. This zone will be crucial to watch — if the price reacts positively and rebounds, it could signal another push to retest the $107K resistance. On the other hand, a breakdown below this OB may open the door for a deeper retracement toward the $100K zone or even lower, possibly targeting the liquidity around $98K.
For now, BTC remains in a short-term corrective phase within a larger bullish structure. The reaction from the Daily OB zone will likely determine the next major move.
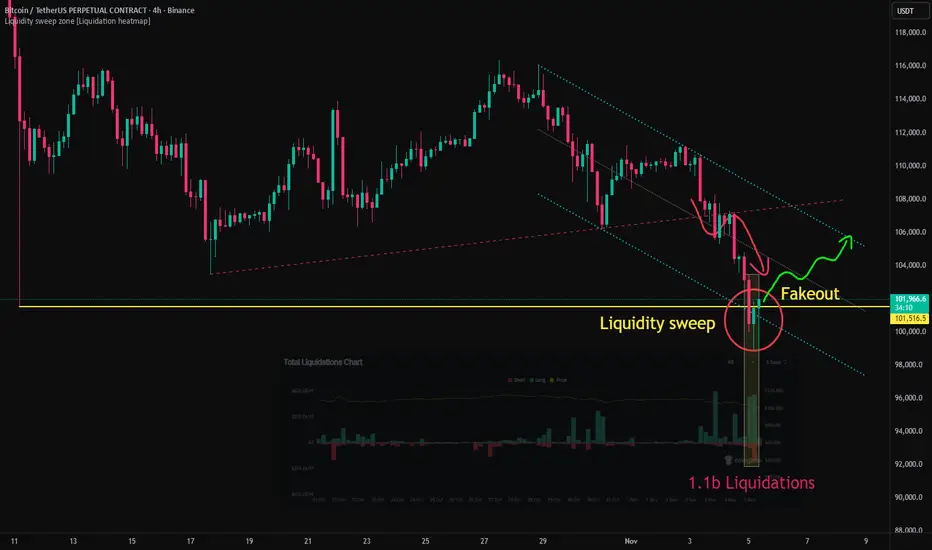
Bitcoin Drops Below 100K, Reversal Signal EmergingAfter breaking below the 107K support level, Bitcoin retested the area and then extended its decline.
As the downtrend intensified, the price broke through 102K, which was the low recorded during the large-scale liquidation event on October 11, and subsequently lost the psychological support level at 100K.
During the eight-hour period of this decline, approximately 1.1 billion USD worth of long positions were liquidated, accompanied by both a liquidity sweep and a fakeout pattern.
The simultaneous occurrence of large-scale liquidations, increased trading volume, a fakeout pattern, and the process of filling the CME gap indicates that multiple short-term reversal signals emerged in this zone.
From a technical standpoint, there is an increasing likelihood of two consecutive bullish candles with long lower wicks forming on the 4-hour chart, while the 12-hour chart also shows a high probability of developing a bullish candle with a long lower shadow.
This suggests a growing possibility of a short-term rebound, with the potential upside target near the upper boundary of the descending parallel channel.
Bitcoin (BTC/USD) - Bullish Continuation from Order Block (OB)The analysis uses concepts from Technical Analysis and Smart Money Concepts (SMC), indicating a short-term bullish bias:
Recent Trend: The chart shows a recent strong upswing followed by a slight pullback. The overall movement from October 27th onwards suggests a continuation of the upward momentum.
Market Structure Shift (MSS): The price recently broke above a local swing high (near $114,500), which is often termed a Market Structure Shift (MSS) in SMC. This break confirmed that the prevailing short-term trend is upward.
Order Block (OB): The gray shaded box, labeled OB, represents an Order Block. This is a specific area where smart money (institutions) may have placed buy orders, and it is identified as a strong area of support.
The current price action shows the price has dropped back into this critical support zone (around $112,500 to $113,500).
Consequent Retracement Levels (CRT):
CRT-L (around $111,800) is the lowest level of the recent swing or the bottom of the structure being referenced for support.
CRT-H (around $116,000) is the swing high, which is also identified as the primary target for the expected bullish move.
Proposed Price Action: The primary black arrow suggests that after testing the OB support zone, the price is expected to turn sharply upward and rally back toward the high at CRT-H ($116,000). The current slight rebound from the OB supports this idea.
Interpretation and Trading Bias
The analysis has a clear bullish continuation bias. The trader is looking for long (buy) entries inside the Order Block (OB) zone, anticipating that the price will hold this institutional support and target the previous swing high at $116,000.

BTC/USDT 4H AnalysisAfter taking out the sell-side liquidity, Bitcoin has shown signs of reversal and filled previous imbalance zones.
Currently, price is reacting from a Fair Value Gap (FVG) around the 110K area after a market structure shift (MSS).
🟢 The bullish scenario suggests that if this FVG holds, BTC could aim for the next buy-side liquidity around 126K as the main target.
🎯 First target: 115K – liquidity area above the short-term high.
🚀 Final target: 126K – buy-side liquidity sweep.
📌 Key zones:
Sell-side liquidity taken ✅
FVG (Potential bullish continuation area)
Buy-side liquidity at 126K
📅 Analysis based on Smart Money Concepts (SMC) and liquidity flow.
📖 For educational purposes only — not financial advice.

BTCUSDT NEXT Impulse !Hi fellow traders, BTCUSD will be ready to make a move higher from the blue box after it completes the expanding flat pattern in a WXY formation. Target will be 113604.87 USD. Good luck and trade safe!

Daily BTC/USD Analysis - Smart Money PerspectivePrice recently swept liquidity above the previous weekly high, indicating a classic liquidity grab. After this move, we observed a market structure shift (MSS) to the downside, followed by a break and a mitigation of a bearish imbalance (BAG).
Currently, price is reacting from a small fair value gap (FVG), but this is likely just a retracement. I'm expecting the market to drop further and target the larger FVG zone that aligns on both the weekly and daily timeframes (highlighted in blue). This zone also aligns with a potential POI (point of interest) for smart money accumulation.
📌 Short-term bias: Bearish
🎯 Target: 99,000–97,000 zone
🔍 Watch for rejection at current FVG or possible internal liquidity grab before the drop.
Smart money is likely to seek deeper liquidity before any meaningful bullish continuation. Stay patient and let price come to the premium zone.

BTC Creating THIS Pattern Right Now – 108K Next?#BTC is forming a powerful pattern right now! 📊
Are we about to witness the breakout that takes us to **108K**? ⏰
Watch closely – the market's heating up! 🔥
#Bitcoin #Crypto #BullRun #BTC108K

BTCUSDT 1W UpdateYes, history is likely to repeat itself, making it possible for Bitcoin to reach a new all-time high in the range of $130K to $150K this year.
Are you ready?

Bitcoin Technicals Flash Warning – Smart Money Watching!Bitcoin has been forming a series of lower highs and lower lows since its all-time high (ATH) of $109,568, indicating a potential downtrend. The support level, which previously held strong, has now been broken and is acting as resistance. The recent price movement suggests a retest of this broken support, which could confirm further downside if rejected.
The 100 EMA is positioned above the price, reinforcing bearish pressure. If BTC fails to reclaim this level, the price may continue to decline. RSI is hovering around 41.51, indicating weak momentum, with no strong bullish signals yet.
Bullish Scenario: A reclaim of the broken support and a move above $90,000 could invalidate the bearish setup.
Bearish Scenario: A rejection from this level could lead to further downside, potentially targeting $75,000-$72,000.

Long Story short for BTCHistory hasn't failed yet, so the four-year cycle is still intact until it isn't. I have stretched this chart out for the next couple of years so that you can get a good idea of where the potential bottom will be during the next bear market. I plan to accumulate as much as possible the closer it gets to 66k. If we do reach a 150-250k top this cycle then I will expect a bear market bottom between 66-76k. Watch my levels and use them as a guideline. Historically Bitcoin has NEVER returned to the price its low during the US election week:
2012 Election Week Low - $10
2016 Election Week Low - $700
2020 Election Week Low - $13,200
2024 Election Week Low - $66,800
that brings us to now... if this doesn't indicate the current market sentiment then I don't know what will. There's a reason why many genius economists are speculating a 1 million dollar bitcoin in the next 8 years.

75k is INEVITABLE.I published my idea on BINANCE:BTCUSDT how it is forming Double Top pattern and indicators are making divergences in late January. Since BTC hit our first take profit point we might expect little bit of pullbacks and see if it is gonna react to 91k area, but Volume is not looking good that means we might see red candles all the way to 75k area. 75k area was major resistance zone which would work as support this time.

Bitcoin at a Critical Level: Will Support Hold or Break?CRYPTOCAP:BTC is currently accumulating within a marked zone, fluctuating within a broad range of approximately $17,800. The previous resistance line has now acted as support, indicating a key retest level.
If BTC fails to hold this support, a further decline toward the key support zone could be expected. The RSI is near 42.83, suggesting neutral momentum, with no strong bullish signs yet.
A breakdown below this range could trigger a bearish move, while a breakout above resistance would confirm bullish continuation.
DYOR, NFA
Thank you for your attention! If you found this valuable, please hit the like button and share your thoughts in the comments below.

BTC Breach Alert: Long Positions at Risk!CRYPTOCAP:BTC has broken below the broad accumulation zone.
Exercise caution with long positions.

Bitcoin Trapped in a Range – Which Way Will It Break?BTC is currently accumulating within a marked zone, trading within a broad range of approximately $17,800. The previous resistance line has now turned into support, indicating a possible consolidation phase before the next move.
The price is fluctuating near the 50 EMA ($97,811.26), which may act as dynamic resistance. A breakout above this level could signal renewed bullish momentum, while failure to hold support may lead to further downside.

BTC: Bearish Scenario - Potential Crash to $100,Simple Idea - Not Financial Advice!
This is a highly speculative scenario, but one worth considering: a potential major Bitcoin crash bringing the price down to the $100,000 range and below.
Observations:
The current macroeconomic climate, could be contributing to a significant shift in market sentiment.
A breakdown below key support levels at mention specific price levels, $103,000 could trigger a cascade of sell orders.
The psychological impact of breaking the important 100,000 mark could further accelerate the decline.
This is a highly speculative scenario and may not play out.
BINANCE:BTCUSDT
Disclaimer: This idea is for informational purposes only and should not be considered financial advice. I am not responsible for any losses incurred. Trading cryptocurrencies involves substantial risk.
Good luck!

BTC Retests Trendline Support – Breakout to $125K Incoming?BTC has once again successfully retested the rising trendline, which continues to act as strong support. Currently, the price is consolidating near the resistance zone.
If BTC breaks above this marked area, we could witness a significant rally, potentially driving the price toward $125K.
If you find our work valuable, please like, comment, and follow. Thank you for your support!

Accumulation to Breakout: BTC’s Next Target RevealedBitcoin Analysis
After a 47% surge from the first accumulation zone, the price entered a consolidation phase.
Breaking out of the next accumulation zone, Bitcoin rallied by 61%, showcasing strong bullish momentum.
Currently, the price is consolidating again, with a potential 40% upside if the bullish trend continues.
Previous breakout levels now act as key support for any pullbacks.

BTC Price Forecast: Will Accumulation Zones Lead to a 50% Surge?We are analyzing a BTC/USD weekly chart where the price is holding strong support above the rising trendline, marked in blue.
First Scenario:
After breaking out of the resistance trendline, the price rallied by 135%, as shown in the first green box. Notably, there was a small accumulation phase in the red-marked zone before the breakout.
Second Scenario:
Currently, the price is steadily moving upward, forming another small accumulation zone within the red-marked area. This pattern suggests a potential continuation of the bullish trend.
Outlook:
Based on these observations, the price could potentially rise an additional 50% from current levels. The Stochastic RSI supports this view, aligning well with the momentum seen in both scenarios.
Conclusion: The strong trendline support, recurring accumulation zones, and favorable momentum indicators point to further upside potential.
