Bitcoin Sell Zone: 75,500–76,000 Downtrend + FVGEntry: Sell/short on confirmation around 75,500–76,000 zone (Selling Area FVG + 0.78 Fib) – wait for bearish candle rejection or failed breakout attempt
Target 1: 74,500–74,689 (next support / prior BOS level, initial downside)
Target 2: 73,000–72,790 (extension to lower BOS / blue curve projection low)
Stop Loss: Above zone high / invalidation ~76,500–77,000 (above CHOCH/resistance flip) to protect if bullish reversal occurs
Rationale: Downtrend continuation favored on 15M with price rejecting higher into the Selling Area (FVG confluence + 0.78 Fib retracement acting as strong resistance). Bearish structure from recent BOS/CHOCH breaks supports shorts if confirmation hits. Watch for volume on downside or bearish patterns for conviction — potential leg lower in the ongoing correction.
Bitcoin looking heavy in the zone — patience for that confirmation could set up a nice short! ₿ #Bitcoin #BTCUSD #ShortBitcoin #CryptoTrading #BearishSetup #FVG #Fibonacci #TradingSignal #Downtrend #CryptoInvestor #Investor #Investing #Crypto Not financial advice — Trading cryptocurrencies involves very high risk of loss due to extreme volatility. Always do your own research, wait for your personal confirmation, use strict risk management (e.g., risk <1-2% per trade), and consider broader market factors (macro, sentiment, news). This is for educational/entertainment purposes only. Trade responsibly!
Btcshort

BTC Short Running with 1:3RRBTC Short Running with 1:3RR
Loving this BTC Short so far. Actual target is around 74-75K.

BTC STUPID OPINIONAs far as i have extra chromosome i see that type of BTC movement for next YEAR
Down till march
Up till april
Down till may
Up till jul
Down till aug
Down till dec

BitCoin long-term forecast 2026 dropping to $45k?Bitcoin monthly demand level is under attack. New low printed.
The yearly timeframe is trending up and the dump has started, hopefully. CRYPTOCAP:BTC can continue the dump as explained a few weeks ago.
Next stop is the monthly demand imbalance at $64k. No longs are adviced in the middle or a long-term dump.

BTC Bulls: ItS jUsT a CoRrEcTiOnHello traders,
Last couple of months, I kept asking myself the same question:
Why is the USD weakening,
why are Gold & Silver kept printing ATHs,
Yet BTC keeps sinking?
Even as of yesterday when metals were pulling back, BTC crashes even more 10%!
I don't understand how people can still call this a bull market?
At some point…your investments blindfold you.
Dead Cat Bounce
I warned that the move into the 0.382 Fibonacci retracement was just a dead cat bounce.
Price reacted almost exactly at that level with a clear rejection and has now lost every short-term support that bulls were leaning on.
What now?
When price can’t sustain support levels, it doesn’t mean “buy the dip”. You will only try to catch falling knives, you don't want that, do you?
Liquidity is still below.
📉 Next major target: 75K
That’s where volume and HTF structure sit. And that is not a financial advise.
Good Luck!

BTCUSDT (Weekly) – Long-term Chart Update. BTCUSDT (Weekly) – Long-term Chart Update.
BTC is still inside a rising channel (higher highs & higher lows intact).
Price is holding the lower trendline support of the channel — a key bullish area.
The weekly MA (~87.5k) is acting as dynamic support.
Current price: ~88.7k
This is a make-or-break support region.
As long as weekly closes stay above the lower channel + MA, the bullish structure remains valid.
Consolidation above 85k–90k.
100k psychological-
120k–125k (channel mid/upper area)
Extended cycle target 140k–150k+ (as projected)
Weekly close below ~85k.
Break of channel support → deeper correction toward 75k–70k.
short-term consolidation
Buy the dip mindset while structure holds.

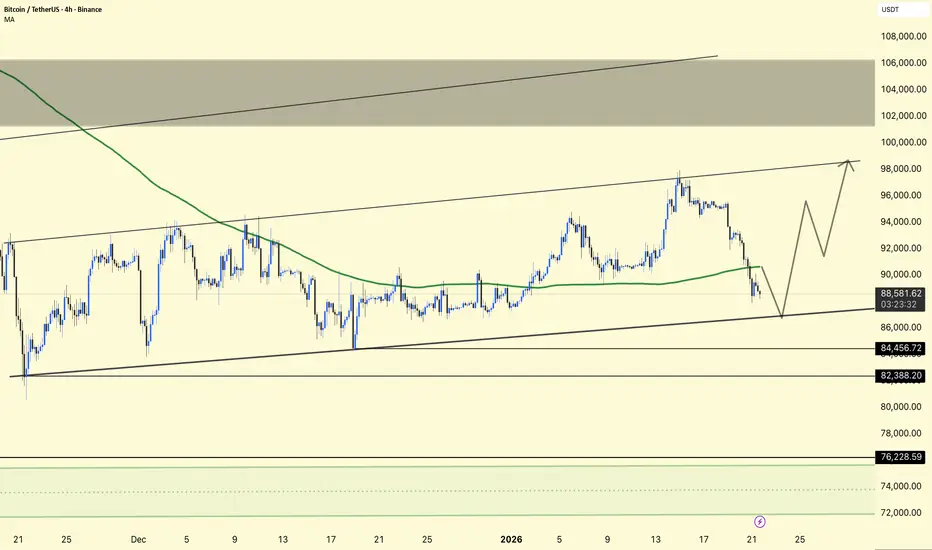
BTCUSDT – 4H Chart Update. BTCUSDT – 4H Chart Update.
Price is moving inside a rising channel.
BTC is currently testing the lower trendline support.
This area looks like a potential bounce zone.
If support holds, a move back toward 92k → 96k → 98–100k is possible.
A clear breakdown below 86k can lead to an 84k–82k support test.
Cautiously bullish while above channel support.
⚠️ Wait for confirmation and manage risk.

It's Freezing Cold Outside - Is BTC Headed for Winter, Too???Hey, Traders. Wow, we have had some wild rides in crypto the past few months. If you've been following any of my analyses, you can see that nearly everything has been playing out according to the way we read market structure. Forgetting all of the news, politics, and the many other fundamental factors out there, BTC and ETH have been following a solid technical structure that few have learned to discern. And now...that same technical structure has been showing me that something even bigger has been brewing. We have mostly been watching these on the H4 and Daily Charts, but behind the scenes the Weekly Time frame has been playing its own song....We'll dive into this top down view of BTC today!
What is going on?:
Once we zoom out and look at the weekly, here is what has happened.
We had a weekly Break of Structure back the week of 10/13...Remember that crazy Oct 10th Day when there was a so called "Flash Crash". Well this was more than a glitch in some Exchanges networks - it was a choreographed move that was predetermined and brought BTC to near exactly where it needed to be to plan the next big move. This BOS then returned back to the Weekly Source and was rejected the week of Oct 27th...further legitimizing the original BOS move down.
As I have indicated many times, this kind of move nearly always results in a return to the Demand Source. At the time of that Signal, BTC was at ~110K...just coming off of All Time Highs, and the Demand Source is way down at ~60K...Inconceivable, right???? WRONG! It's Very conceivable.
Could this really happen?:
On the H4 and Daily charts, we have been taking buys and sells according to those structures, but we cannot forget that the Weekly is the stronger, more dominant director of what the market is really doing. It's easy to get lost in the ups and downs of H4 and daily candles, because there are a lot of good trade opportunities there. But, here is what the weekly is showing and how this could actually happen...
There is an internal Weekly Demand Source (77K - 89K). We are currently inside of this structure now. I say this is internal because the Demand is there, but there was not enough market time in this area in the past to make it a strong enough area of demand. So, it could hold the price and provide support, but it is unlikely to be the solid bottom we need for a strong bull run. Just from the last Daily BOS and its return, we are headed to test at least 85-87K. So, here are the next possible steps:
1. IF this internal Source does not hold, it's very likely falling to the Monthly Key Level at ~ 71.4K. That is literally the last opportunity for BTC to hold up.
2. If the Monthly level doesn't hold it, there's an unfilled FVG at 73.6K that will try to stop it.
3. If that fails, its down to the 60K Weekly Demand Zone.
If we hit this 60K level, its going to be the BUY of BUYS for BTC. Aggressive traders will already have limit orders to buy there, with stops around 55K.
As always, I hope this helps some of you. Please leave me any comments or questions and I'll be happy to respond. If you are looking for a solid and consistent way to extract wealth from these markets, let us know. We'd love to help you!

BTC/USDT – 4H Small Chart Update. BTC/USDT – 4H Small Chart Update.
Price is moving inside a rising parallel channel (upper & lower trendlines respected).
BTC is currently pulling back toward the lower channel support and the moving average zone.
The green MA is acting as dynamic support on dips.
Support: 88,000 – 86,500 (channel base + MA confluence)
Major Support: 84,500 → 82,300 (breakdown risk zone)
Resistance: 94,000 – 98,000 (upper channel/supply)
Hold above lower trendline → bounce → retest 95K–98K
Breakdown below 84.5K → deeper correction likely
The structure remains bullish while it is inside the channel. This looks like a healthy pullback, not trend failure—unless the lower trendline is lost on strong volume.
Not financial advice. Manage risk.
BTC/USDT – 4H Chart Update. BTC/USDT – 4H Chart Update
Price is pulling back into a major demand zone (92,000–93,500)
Price remains above the 4H moving average, which is acting as dynamic support
The long-term rising trendline remains unbroken, keeping the macro bias bullish
Immediate Support: 92,000 – 93,000
Support: 90,200
Strong Support: 84,400 (HTF Demand)
Resistance: 95,500 → 97,800 → 99,000
If BTC holds above 92K and reclaims 93.5K, further upside is likely
Targets:
95,500
97,800
99,000+
A break below 92K with high volume could lead to a larger pullback towards the 90K MA support
The structure only weakens below 90,200
BTC is in a healthy pullback within an overall uptrend. As long as the price remains above the moving average and the rising trendline, dips remain buying opportunities rather than trend reversal signals.
⚠️ This is not financial advice. Trade with proper risk management.


BTC/USDT Chart Update. BTC/USDT Chart Update
Overall bullish structure remains intact
25 MA (Moving Average)
Price is holding strongly above the 25 MA
25 MA is acting as a dynamic support zone
94,000 – 94,300 → major demand + MA support
As long as this zone holds, any pullback is considered healthy
99,700 – 100,000 → immediate resistance
A confirmed breakout can open the path toward 102K – 104K
Ichimoku Cloud is providing support, confirming trend strength
A 4H close below the 25 MA may signal short-term weakness
In that case, the price could retest the 90,200 area
The trend is still bullish. Dips may be viewed as buying opportunities as long as the price holds above the 25 MA.
Market involves risk — use proper risk management.

BTC/USDT (4H) – Chart UpdateBTC/USDT (4H) – Chart Update
Trend: Bullish structure intact
Price Action: Higher highs & higher lows continue
Ichimoku: Price holding above the cloud → strength remains
Bitcoin has successfully reclaimed the key demand zone (~94K) and is respecting the rising trendline. This pullback looks healthy, not a trend reversal.
As long as BTC holds above 93.5K–94K, upside momentum stays active
A clean push above 96K can open the path toward the 100K–102K liquidity zone (marked area)
Loss of the 94K support may lead to a deeper retest near 90K before continuation.
Structure favors continuation to the upside. Patience and proper risk management are key.

BTC/USDT – 4H Chart Update. BTC/USDT – 4H Chart Update
The price is still trading within a descending triangle/wedge, with clear compression visible.
BTC is trading just below a major horizontal supply area (≈ 94K).
Trendline support + moving averages are holding around the 90K–91K area.
Bounce from the trendline: Could trigger a short-term move towards the supply zone.
Clear breakout and close above the upper trendline: Confirms bullish continuation and opens the way for higher levels.
Rejection from supply again: Could lead to another pullback towards the trendline support.
The market is in a decision phase. The bias will only turn bullish upon a confirmed breakout. Until then, expect range-bound volatility and respect the key levels.

Bitcoin Update. Bitcoin Update.
Bitcoin is reacting to a strong supply zone, resulting in a short-term rejection. Despite this, the price remains above the ascending support trendline, maintaining the bullish structure.
A bounce off the trendline could initiate a new upward move. However, a clean breakout with confirmation from the current pattern would be the key signal for a strong continuation of the bullish trend in the market.
⚠️ Until then, expect consolidation with volatility—patience and confirmation are crucial.

BTC/USDT – 4H Chart UpdateBTC/USDT – 4H Chart Update
Bitcoin is trading inside a rising wedge / ascending structure and has just made a strong bullish push from the lower trendline.
Price holding above short-term MAs
Higher lows structure intact
Bullish momentum is building near the resistance
Current Price: ~92.5K
Immediate Resistance: 94.5K – 95K
Major Resistance: 96.8K
Support Zone: 89K – 90K
Trendline Support: ~88K
Above 90K: Bullish continuation possible
Break & hold above 95K: Momentum could accelerate toward 96.8K+
Rejection near resistance: Expect a healthy pullback to trendline support
A 4H close below 88K would weaken the bullish structure.
Bullish while above key support
Trade with discipline & proper risk management

BTCUSDT – 4H Chart Update. BTCUSDT – 4H Chart Update
BTC is showing strength after holding the $84.6K–$85.8K demand zone multiple times (strong buy interest visible).
Price is now moving higher with short-term bullish momentum.
🔹 Support: 85.8K / 84.6K
🔹 Resistance: 93.5K–94K zone
🔹 Bias: Bullish above support, pullbacks are buy-on-dips
As long as BTC holds above the marked support, upside continuation remains likely.
Risk management is key ⚠️

BTCUSDT – Chart Update. BTCUSDT – Chart Update
Price compressing inside an ascending triangle
Higher lows holding → bullish structure intact
Key resistance: 89.5K–90K
Break & hold above = momentum move toward 92K–95K
Support: 87K–86K zone
👉 Patience here. Expansion coming after the breakout.
Not financial advice

BTC mid term analysis-BTC has been breaking lows after lows, most of Long's liquidations are sitting around 70k, ask to your retail friends who are still holding longs.
-Since mid November BTC has been trending in a range, inside this range price has been creating selling structure, LH's, broke some lows, big wicks on the top of candles meaning there's still a lot of sellers.
Let's see

BTCUSDT – 4H | Chart Update. BTCUSDT – 4H | Chart Update.
BTC is compressing inside a symmetrical triangle (lower highs + higher lows). This is a classic volatility squeeze before expansion.
Strong buyer reaction seen multiple times near 85.8k – 84.6k (green circles)
Rising trendline support is still respected.
93.5k – 94k remains a heavy rejection area
Price needs a clean breakout to unlock upside
Price is trying to reclaim short-term MA
Sustained hold above trendline + MA = bullish confirmation
Above 89–90k → breakout attempt toward 93k+
Below 85.8k → deeper pullback toward 82.2k
This is a decision zone. Structure favors upside only after confirmation.
Small update • Big move loading
DYOR | NFA

BTCUSDT –Chart Analysis (4H)BTCUSDT –Chart Analysis (4H)
BTC is coiling inside a tightening range — lower highs vs higher lows. This type of compression usually leads to a sharp directional move.
Price is respecting the rising base around 85k
Every dip into the green zones shows buyer absorption
Sellers are active below 89k, keeping pressure from above
Support: 85,800 – 84,600
Major Support: 82,200
Resistance: 88,800 – 89,500
Supply Zone: 93,500 – 94,000
When price holds support during Extreme Fear, it often means weak hands are exiting while stronger players accumulate quietly.
DYOR | NFA

BTC 30m Partial FVG Tap, Lower Imbalance Fill Setup📝 Description
BTC on M30 just made a shallow tap into the upper FVG, followed by immediate hesitation. With only a partial fill completed, it’s reasonable to expect price to seek the lower FVG for a more complete imbalance fill before any meaningful continuation.
________________________________________
📈 Signal / Analysis
Primary Bias: Short-term pullback while below 89,000–89,100
Short Setup (Reactive):
• Entry (Sell): 88,800
• Stop Loss: Above 89,00
• TP1: 88,600
• TP2: 88,340
• TP3: 87,915 (30M FVG midline)
________________________________________
🎯 ICT & SMC Notes
• Price tapped 30M FVG in premium
• HTF FVG H4/H1 overhead caps upside
• No clean CHOCH + BOS for bullish continuation
• RSI flattening → momentum exhaustion
• Liquidity draw sitting below recent lows
________________________________________
🧩 Summary
This looks like impulse and pause then retrace. As long as BTC stays below 89k, odds favor a pullback to 88.4k and 87.9k. Acceptance above premium invalidates the short and opens room higher.
________________________________________
🌍 Fundamental Notes / Sentiment
With markets still headline-sensitive and liquidity tight, quick rotations around key levels are favored. Trade the reaction at FVGs and keep risk tight.
________________________________________
⚠️ Risk Disclosure
Trading involves substantial risk and may result in capital loss. This analysis is for educational purposes only and does not constitute financial advice. Always apply proper risk management, predefined stop-loss levels, and disciplined position sizing aligned with your trading plan.

BTC/USDT – 4H Chart Update. BTC/USDT – 4H Chart Update.
Price swept liquidity near 84.5K and bounced → classic fake breakdown.
Still moving inside a descending channel.
84.5K = key support (holding keeps bounce valid).
82.2K = invalidation level if support fails.
Resistance: 88K → 92K–94K supply zone.
Neutral to slightly bullish as long as 84.5K holds.
Reclaim above 88K = upside continuation possible.
Below 84.5K = deeper pullback risk.
Not financial advice. Manage risk.
