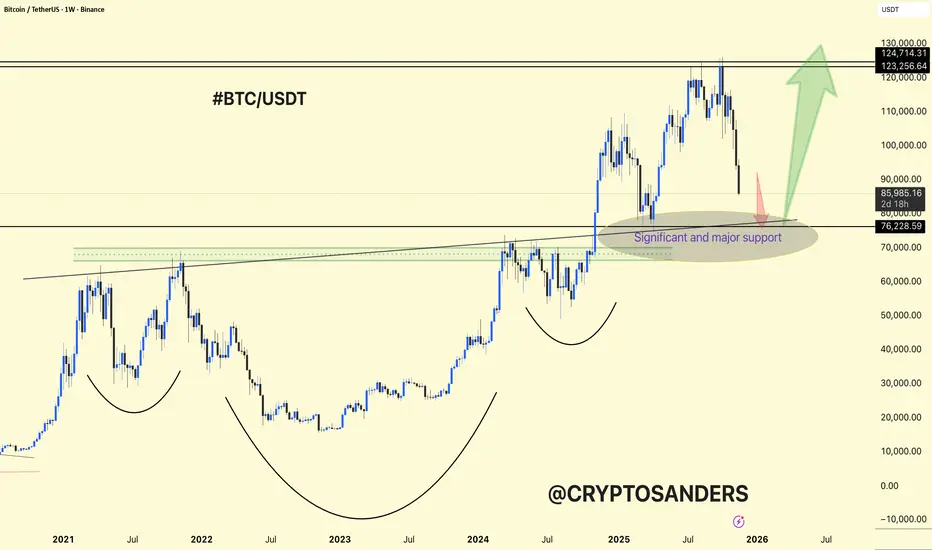
BTCUSDT Weekly Chart Analysis. BTCUSDT Weekly Chart Analysis
Major Structure: Bitcoin is experiencing a significant correction, now testing the most important multi-year support zone around $80,000–$82,000.
Patterns: The chart shows multiple rounded bottoms and a massive base structure, indicating repeated accumulation phases since 2021.
Support Zone: This highlighted area is not only a former breakout region but also converges with major horizontal and trendline support levels, making it highly significant for bulls.
If buyers defend this zone, a swift rebound toward $123,000–$130,000 is likely, maintaining the long-term uptrend.
Failure to hold here increases risk for deeper corrective moves, and the next support would be much lower.
Momentum Shift: The steepness and sharp drop into support reflect panic or forced selling, often associated with extreme sentiment lows.
DYOR | NFA
Btcshot
BITCOIN 1d ANALYSISHi, friends. Nice to meet you.
BITCOIN is at its most important point.
If it falls from the STRONG UPWARD TREND, it will be difficult for many candles to come up to the current branch.
If we do SupORT now, we expect a strong rise.
The bank run, various bad news, and the FOMC ICP announcement were very bad, but I personally hope that BITCOIN will rise.

Btcusdt shorthey guys.. you can see btcusdt bos appear as break LL and now btc price going to mitigate the OB zone then market go back to downside .
