BTC ShortIn the medium term, I am bearish 📉
Additional manipulation followed by a rebalancing of inefficiency will provide an opportunity to open a short position.
Btctether

ANFIBO | BTCUSD - Still in a boring range [11.11.2025]Hey guys, Anfibo's here!
BTCUSD Analysis – Daily Trading Plan
Overall Picture:
The prior sell at $107,000 executed according to plan and produced a clean, profitable outcome — well done to those who took it and locked in gains. Currently BITSTAMP:BTCUSD is trading in a sideways, slightly upward-drifting range as liquidity is being gathered beneath the upper trend boundary. Momentum is constructive but not yet impulsive; therefore the highest-probability edge today is to wait for price to touch the established trendline and read the reaction there before committing to fresh short exposure.
Trading Plan for Today:
>>> BUY ZONE:(x1000)
ENTRY: 104 - 105
SL: 103
TP: 110
>>> SELL ZONE: (x1000)
ENTRY: 109 - 110
SL: 111.5
TP: 104 - 95
Risk Management:
- Risk a controlled percentage of equity per trade (e.g., 1–2% max capital risk per position) and size positions so SL distance equals the planned risk.
- Scale sizing: take a smaller initial position at Entry (1) and add selectively at Entry (2) only after clear bearish rejection or failed retest.
- Use tight, logical SLs (as listed) and consider moving SL to breakeven once TP1 is achieved to protect gains.
- Monitor intraday volatility and major news — reduce size or sit out if market structure becomes erratic or if a scheduled macro event is imminent.
Conclusion:
The market rewarded our prior sell at $107k — a good example of discipline and structure-based trading. Today’s plan remains conservative: let BTC approach the trendline / upper channel, observe price reaction, and initiate short exposure only on a clear rejection or failed retest. Maintain strict risk controls, scale thoughtfully, and avoid averaging into a losing trade. This patient, reaction-based approach keeps the odds in our favor while respecting the prevailing range dynamics.
HAVE A NICE DAY, GUYS!

BTC Analysis 30/10/2025BTC / USDT
Bitcoin is forming a massive ascending wedge pattern, a bearish pattern currently undergoing a bearish retest.
The 200-day EMA is a significant support level and has been tested multiple times in the past few weeks. The more it is retested, the weaker the support becomes.
The sharp drop on October 10th impacted the market's direction.
Bearish targets for this scenario:
First support: 103,000 - 100,000
Major support: 94,000 - 89,000
Summary: The market is currently bearish, and we can revise our analysis if Bitcoin manages to stabilize above 117,000.

$BTC might explode after the washout!CRYPTOCAP:BTC is once again reacting strongly from the lower channel support, similar to the previous green-circle bounces we’ve seen this year.
Each green circle has marked key accumulation points — followed by strong upside momentum.
Meanwhile, red circles highlight resistance rejections where profit-taking zones formed near the upper channel boundary.
🧭 Key Levels to Watch:
Support: $106.8K – $110.5K
Resistance: $120.1K – $123.5K
Trend: Holding firmly inside the rising channel
If CRYPTOCAP:BTC continues to respect the green zone, we could be looking at the early stages of another leg up toward the top of the channel.
But if support fails, expect a deeper retest of the lower structure.
Note:
History doesn’t repeat perfectly — but it rhymes. Stay calm, stay patient, and let the chart tell the story.

BTC/USDT Short Trade Setup📉 BTC/USDT Short Trade Setup 📉
🔹 Entry Price: $114,632
🔹 Targets:
TP1 → $113,900
TP2 → $113,250
TP3 → $112,400
🔹 Stop Loss (SL): $115,450
🔹 Leverage: 25x–50x (trade safe, don’t over-leverage)
📊 Analysis:
Bitcoin has hit a key resistance zone around $114,600–$114,800. Multiple rejections on the chart suggest a potential pullback is near. If the bearish momentum confirms, BTC could retrace toward the $112,400 support zone.
⚠️ Risk Management Tip: Always use SL to avoid liquidation. Remember, smart trading is about consistency, not chasing every move.
💬 What do you think — will BTC reject from here or surprise us with another breakout? Share your views below!
CRYPTOCAP:BTC
#BTC #Bitcoin #CryptoTrading #ShortTrade #TradingView #BinanceFutures

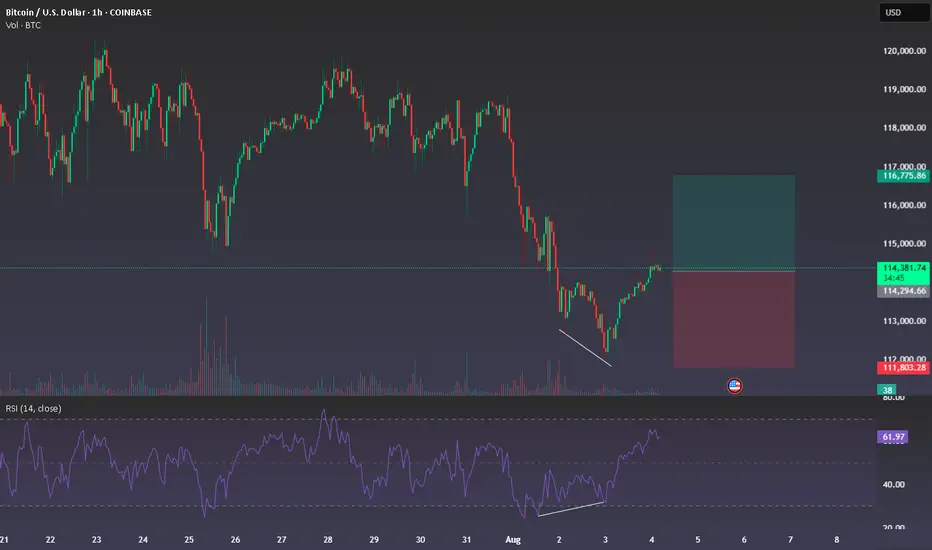
BTC Long – Bullish Divergence 1H Looking for long from 114300 zone
1H chart showing bullish divergence
also price broke short downtrend with nice momentum
Timeframe: 1H
Entry: 114300
Target (TP): 116850
Stop (SL): 111700
Only sharing my view, not any financial advise, thx
BTC sounded the alarm, 115,000 became the key point#BTCUSD
Last week, as global risk sentiment deteriorated, the cryptocurrency market came under pressure, pushing BTC back from its recent highs. This correction was significant, and while BTC has subsequently rebounded, technically, the bearish divergence signaled by the daily MACD indicates weakening short-term rebound momentum. The Bollinger Bands on the 4-hour chart are trending downward, indicating that the market remains in a period of volatile correction.
If BTC cannot effectively break through the upper resistance of 115,000 in the short term, the bears may continue to exert their strength. You can consider shorting with the target at 114,000-113,000.
🚀 SELL 115,000-116,000
🚀 TP 114,000-113,000

Long positions have achieved profits, BTC market outlook📰 News information:
1. Pay attention to the trend of gold and US bonds
📈 Technical Analysis:
At present, BTC has rebounded and profited, and rebounded to around 108,000 again. 109,000 is also the upper track of the Bollinger Band. There is a certain suppression in the short term. Before the suppression fails to break through effectively, BTC may still fall into a weak and volatile market. If BTC hits resistance and pressure above 108,000-109,000 during the day, you can consider shorting. In view of the current volatile market, everyone must strictly control their positions, use leverage prudently, and do a good job of risk management to cope with market uncertainties.
🎯 Trading Points:
SELL 108,000-109,000
TP 107,000-106,000-105,000
In addition to investment, life also includes poetry, distant places, and Allen. Facing the market is actually facing yourself, correcting your shortcomings, confronting your mistakes, and strictly disciplining yourself. I hope my analysis can help you🌐.
TVC:GOLD OANDA:XAUUSD FX:XAUUSD FOREXCOM:XAUUSD PEPPERSTONE:XAUUSD FXOPEN:XAUUSD

#BTC/USDT#BTC
The price is moving within a descending channel on the 1-hour frame, adhering well to it, and is on its way to breaking it strongly upwards and retesting it.
We are seeing a rebound from the lower boundary of the descending channel, this support at 106792.
We have a downtrend on the RSI indicator that is about to break and retest, supporting the upward trend.
We are looking for stability above the 100 moving average.
Entry price: 107234
First target: 108262
Second target: 109748
Third target: 111298

Today btcusd analyisBitcoin Price Trend Analysis (30-Min Chart)
Current Price: 92,005 USD
1. Key Levels & Distances
Resistance Zone: 94,000 USD (+1,995 USD from current price)
Support Zone: 91,500 USD (-505 USD from current price)
Major Support: 90,000 USD (-2,005 USD from current price)
2. Trend Analysis & Possible Scenarios
Bullish Scenario (Uptrend)
If the price maintains support above 91,500 USD and breaks 94,000 USD, it could push higher toward 95,000 USD or more.
Confirmation of higher highs and higher lows will strengthen bullish momentum.
Bearish Scenario (Downtrend)
If the price fails to break 94,000 USD and drops below 91,500 USD, a correction towards 90,000 USD is possible.
Breaking below 90,000 USD could indicate a larger downtrend.
---
3. Trading Strategy Insights
For Buyers (Long Positions):
Look for a breakout above 94,000 USD before entering.
A stop-loss around 91,500 USD.
Target profit at 95,000+ USD.
For Sellers (Short Positions):
If price rejects 94,000 USD, short entries below 91,500 USD could be considered.
Stop-loss near 92,500 USD.
Profit target around 90,000 USD.

H&S in BITCOIN!!!Here i can see 91,800 as a strong Support level, if market breaks it, support level will work as a Neck line of H&S structure and after the clear retest of 91,800 market may show 73,000.


#BTC/USDT#BTC
The price is moving in an uptrend with great success and is expected to continue rising based on the uptrend
It is expected to touch the trend at the current price of 67800 and continue rising
This rise is supported by relying on the uptrend on the RSI indicator
Also, stability above the moving average 100 increases the possibility of rising to the level of 71900 as a target

BTC: Pullback in UptrendTrade setup : Price remains in an Uptrend. It got rejected 2x at $72K level but as long as it stays above GETTEX:64K (prior swing low), its uptrend is intact. We would be buyers near that GETTEX:64K support area, with +15% upside potential back to ATH of $74K. Stop Loss (SL) level at $62.7K. The recent approvals of 10 Bitcoin Spot ETFs are working in BTC’s favor. Wanna know which altcoins will benefit from BTC and ETH rise? Read our research report.
Trend : Downtrend on Short-Term basis and Uptrend on Medium- and Long-Term basis.
Momentum is Mixed as MACD Line is below MACD Signal Line (Bearish) but RSI ~ 50 (Neutral).
Support and Resistance : Nearest Support Zone is GETTEX:64K then $56K - $59K. The nearest Resistance Zone is $74K, then $79K.

#BTCUSDT
#BTCUSDT
Potential Deep Correction Looms
Following a significant surge, Bitcoin has undergone a dramatic decline, signaling a possible deep corrective wave. This sharp fall has engulfed several candles, suggesting strong selling pressure.
The presence of a valid and robust bearish engulfing candlestick pattern (CH) further reinforces this potential correction. Additionally, two significant Fair Value Gaps (FVGs) reside at the bottom, acting like magnets, potentially attracting the price downward.
The analysis identifies short-term Take Profit (TP) targets. However, its validity ceases once a daily candle closes above the supply zone.
Therefore, traders should only consider sell or short positions within the established supply range

BTC: Pullback in UptrendTrade setup : Price is in an Uptrend. Price broke above SWB:69K -$70 resistance zone, making yet another new all-time-high (ATH) of $73,780, but failed to hold as investors chose to take some profit. There was also a bearish RSI Divergence as price made a Higher High but RSI made a Lower High, which implies less momentum strength on the most recent upswing. Now we look for the right entry opportunity in Uptrend.
We wait for price to either 1) break back above $70K to signal continuation of uptrend, with +14% upside potential to $79K next, or 2) pull back near GETTEX:59K support for another swing trade entry in Uptrend with +15% upside potential back to $70K.
The approvals of 10 Bitcoin Spot ETFs are working in BTC’s favor. Wanna know which altcoins will benefit from BTC and ETH rise? Read our research report.
Trend : Uptrend across all time horizons (Short- Medium- and Long-Term).
Momentum is Bullish but inflecting. MACD Line is above MACD Signal Line and RSI is above 55 but momentum may have peaked since MACD Histogram bars are declining, which suggests that momentum is weakening.
Support and Resistance : Nearest Support Zone is $56K - GETTEX:59K , then $50K. The nearest Resistance Zone is SWB:69K - $70K, then $79K.

BTC: Pullback in UptrendTrade setup : Price is in an Uptrend. First attempt to break above SWB:69K -$70 has failed. That’s an all-time-high (ATH), which is a significant resistance area. Price got very overbought (RSI > 80) and was rejected, pulling back as low as $59K. It’s likely to pause here and consolidate around this area, before resuming its uptrend.
Now we wait for price to either 1) break above $70K to signal continuation of uptrend, with upside to $79K-$80K next, or 2) pull back near $60K support for another swing trade entry in Uptrend. The approvals of 10 Bitcoin Spot ETFs are working in BTC’s favor. Wanna know which altcoins will benefit from BTC and ETH rise? Read our research report.
Trend : Uptrend across all time horizons (Short- Medium- and Long-Term).
Momentum is Bullish but inflecting. MACD Line is above MACD Signal Line and RSI is above 55 but momentum may have peaked since MACD Histogram bars are declining, which suggests that momentum is weakening.
Support and Resistance : Nearest Support Zone is $56K - GETTEX:59K , then $50K. The nearest Resistance Zone is SWB:69K - $70K, then $79K.

BTC: Approaching ResistanceTrade setup : Price is in an Uptrend. It broke above $56K and GETTEX:59K key levels and reached our target of SWB:69K -$70K, it’s all-time-high (ATH), which is another significant resistance area. However, price is very overbought (RSI > 80) and is likely to pause and consolidate around this area, before resuming its uptrend.
Now we wait for price to either 1) break above $70K to signal continuation of uptrend, with upside to $79K-$80K next, or 2) pull back near $60K support for another swing trade entry in Uptrend. The approvals of 10 Bitcoin Spot ETFs are working in BTC’s favor. Wanna know which altcoins will benefit from BTC and ETH rise? Read our research report.
Trend : Uptrend across all time horizons (Short- Medium- and Long-Term).
Momentum is Bullish but extremely overbought. ( MACD Line is above MACD Signal Line). RSI is bullish (> 55) but extremely overbought (> 80) which could imply that price could briefly pause or pull back if it reaches Resistance.
Support and Resistance : Nearest Support Zone is GETTEX:59K (previous resistance), then $56K. The nearest Resistance Zone is SWB:69K - $70K, then $79K.

BTC: Approaching SupportTrade setup : Trends are mixed. Price made a lower low, which disrupted the Uptrend. Following the approval of 10 Bitcoin Spot ETFs, price broke above $45K, spiked up 9% to FWB:49K where it got rejected as traders began to take profits. Price has pulled back on “sell the news” effect to $38K - 40.5K support zone, giving us another opportunity for swing entry, with 12-25% upside potential near-term to $45K or $50K. Stop Loss (SL) level at $37K (just below support).
Trend : Downtrend on Short-Term basis, Neutral on Medium-Term basis and Uptrend on Long-Term basis.
Momentum is Bearish but inflecting. MACD Line is below MACD Signal Line and RSI is below 45 but momentum may have bottomed since MACD Histogram bars are rising, which suggests that momentum could be nearing another upswing.
Support and Resistance : Nearest Support Zone is $40.5K, which it broke, then $38K. The nearest Resistance Zone is $45K, then $50K.

BTCUSD H1, SHORT ENTRY UNTIL 38700, SEE WHY .... Hello Traders!
In this stage, I see BTCUSD H1 falling until the level of 38700 (even lower), because it has to close a liquidity gap, and also, hit the level of 38400, a very important level of resistance.
At the moment, I see BTC under bearish dominance and I consider it a good moment to enter short.
Keep in touch!
Follow me for more ideas/trade perspectives!
www.tradingview.com

BTC Pivot point for next yearBTC Pivot For next year
The market will start to rise around May and will see new prices of 110K 120K and 180K
The above pivots were placed for guidance and use for support and resistance

weekly TF Bulltard calleven though were at a strong resistance. i just want to come in with a historical approach on how btc behaves after a daily cross of the 21 and the 200 dma. last time we did it we rose about 700% give or take the entry at around roughly 345 days. if we were to do the same we would be at 150k btc by january. thats the call. thats the move.

BTC a chance for big move BTC / USDT
BTC is being stuck in this channel for almost 40 days! , i think the big move is very close…
The target of this channel if the breakout done successfully would be 46k-48k
What we need for strong breakout : is a stability above 37k-38k which is very bullish because its equal 0.618 fibo resistance in high time frame
At some point we could see strong correction like 20-35% toward 32k - 27k may be after this move So make sure you have free stable coins for this case …
In worst scenario if this the pattern failed we could test lower supports first
Best of wishes
