Btctether

BTC LAST STRONGHOLD⛔In case of losing 30k support are then we will touch 20k which is a LAST stronghold( which is very unlikely )
If Weekly candle closed above 42k then btc will form an insane bullish hammer and In my opinion we can easily pass all resistance till new ATH
FASTEN YOUR SEATBELT
WE HAVE AN AMAZING WEEK

💡Don't miss the great buy opportunity in BTCUSDjust now
Trading suggestion:
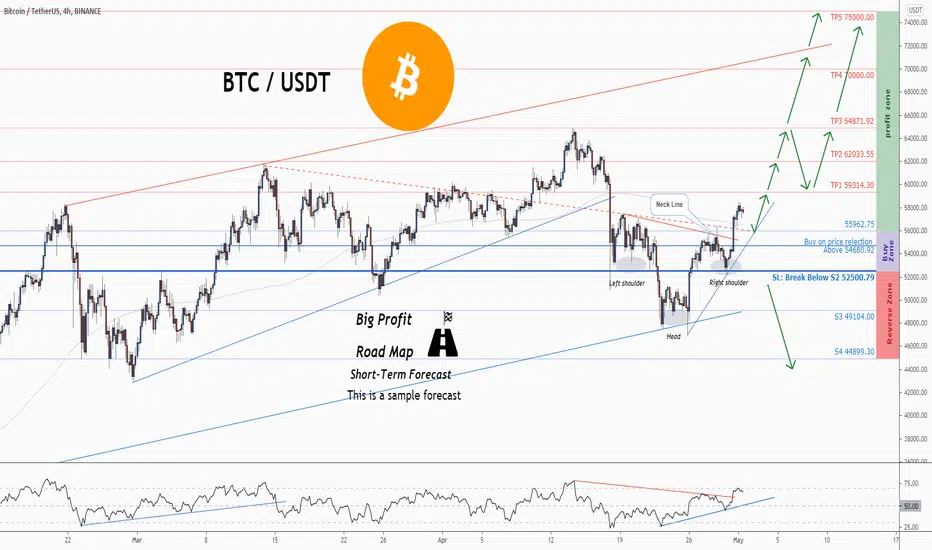
". There is a possibility of temporary retracement to suggested support line (55962.75).
. if so, traders can set orders based on Price Action and expect to reach short-term targets."
Technical analysis:
. BTCUSD is in a range bound and the beginning of uptrend is expected.
. The price is above the 21-Day WEMA which acts as a dynamic support.
. The RSI is at 65.
Take Profits:
TP1= @ 59314.30
TP2= @ 62033.55
TP3= @ 64871.92
TP4= @ 70000.00
TP5= @ 75000.00
SL= Break below S2
❤️ If you find this helpful and want more FREE forecasts in TradingView
. . . . . Please show your support back,
. . . . . . . . Hit the 👍 LIKE button,
. . . . . . . . . . Drop some feedback below in the comment!
❤️ Your Support is very much 🙏 appreciated!❤️
💎 Want us to help you become a better Forex trader?
Now, It's your turn!
Be sure to leave a comment let us know how you see this opportunity and forecast.
Trade well, ❤️
ForecastCity English Support Team ❤️
💡Don't miss the great buy opportunity in BTCUSDjust now
Trading suggestion:
". There is a possibility of temporary retracement to suggested support line (55962.75).
. if so, traders can set orders based on Price Action and expect to reach short-term targets."
Technical analysis:
. BTCUSD is in a range bound and the beginning of uptrend is expected.
. The price is above the 21-Day WEMA which acts as a dynamic support.
. The RSI is at 65.
Take Profits:
TP1= @ 59314.30
TP2= @ 62033.55
TP3= @ 64871.92
TP4= @ 70000.00
TP5= @ 75000.00
SL= Break below S2
❤️ If you find this helpful and want more FREE forecasts in TradingView
. . . . . Please show your support back,
. . . . . . . . Hit the 👍 LIKE button,
. . . . . . . . . . Drop some feedback below in the comment!
❤️ Your Support is very much 🙏 appreciated!❤️
💎 Want us to help you become a better Forex trader?
Now, It's your turn!
Be sure to leave a comment let us know how you see this opportunity and forecast.
Trade well, ❤️
ForecastCity English Support Team ❤️


💡Don't miss the great buy opportunity in BTCUSDTrading suggestion:
". There is a possibility of temporary retracement to suggested support line (58343.20).
. if so, traders can set orders based on Price Action and expect to reach short-term targets."
Technical analysis:
. BTCUSD is in a uptrend and the continuation of uptrend is expected.
. The price is above the 21-Day WEMA which acts as a dynamic support.
. The RSI is at 76.
Take Profits:
TP1= @ 61023.20
TP2= @ 63443.70
TP3= @ 65960.30
TP4= @ 68865.10
TP5= @ 72213.70
SL= Break below S2
❤️ If you find this helpful and want more FREE forecasts in TradingView
. . . . . Please show your support back,
. . . . . . . . Hit the 👍 LIKE button,
. . . . . . . . . . Drop some feedback below in the comment!
❤️ Your Support is very much 🙏 appreciated!❤️
💎 Want us to help you become a better Forex trader?
Now, It's your turn!
Be sure to leave a comment let us know how you see this opportunity and forecast.
Trade well, ❤️
ForecastCity English Support Team ❤️

💡Don't miss the great buy opportunity in BTCUSD@Bitcoin". There is a possibility of temporary retracement to suggested support line (48280. 40 ).
. if so, traders can set orders based on Price Action and expect to reach short-term targets."
Technical analysis:
. BTCUSD is in a uptrend and the continuation of uptrend is expected.
. The price is above the 21-Day WEMA which acts as a dynamic support.
. The RSI is at 58.
Take Profits:
TP1= @ 52640.00
TP2= @ 55018.00
TP3= @ 56600.00
TP4= @ 58400.00
TP5= @ 61100.00
SL= Break below S2
❤️ If you find this helpful and want more FREE forecasts in TradingView
. . . . . Please show your support back,
. . . . . . . . Hit the 👍 LIKE button,
. . . . . . . . . . Drop some feedback below in the comment!
❤️ Your Support is very much 🙏 appreciated!❤️
💎 Want us to help you become a better Forex trader?
Now, It's your turn!
Be sure to leave a comment let us know how you see this opportunity and forecast.
Trade well, ❤️
ForecastCity English Support Team ❤️

BITCOIN :- what to expect next !?Hello traders and investors,
Welcome to technical analysis of BITCOIN.
if you like this analysis please like and comment below, it will support creating more analysis for you.
BITCOIN is stuck between 2 trend lines.
there is possible flag pattern price breaks small flag and stuck into big one .
we are waiting here for confirmation
if price fall below green point i will go for short,
price is at 52975 level , and at this point ABCD pattern is also completed, which means there is very less chance of price to go more high, so we will wait for bears.
next confirmation is divergence :- RSI shows regular bullish divergence. it gives us clear signal of upcoming sell trend.

BTCUSD | PREDICTION ON WHEN THE BULL RUN WILL COMMENCE Morning Traders,
As we saw yesterday we were too early to the run to the 50k level and consequentially the 1.5tr market cap.
I have marked out and illustrated how i see price action playing out, I will be watching structure to determine how we progress.
The Illustration suggest we will get a compression on volatility which leads to an expansionary move to the upside.
How I will determine if this is the case, I will be watching for fractal nature.
overall still macro bullish for now.
what's your thoughts guys, agree disagree?

Elliot Waves Complete Guide | Chapter 3.3 - "Running, Contract"Hello Traders. Welcome to Chapter 3.3, where we talk further about a different form of corrective waves, the Flat and Expanded correction. In chapter 3.3 I discuss the last of the types of flat corrections! Here, we will also dissect the contracting triangle, also known as the symmetrical triangle by many traders.
Chapter 3 Glossary:
3.1 Zig-Zag Waves
3.2 Flat Correction , Expanded Flat
3.3 Running Flat, Contracting Triangle
3.4 Barrier Triangle, Expanded Triangle
3.5 Double-Three
3.6 Triple-Three
-----
Running Flat
The is the last type flat correction: the running flat variation. It is the least common one, but has the same 3-3-5 structure. This one is hard to spot because a rising wedge is usually considered bearish for many and the last wave is where you will find the confirmation. For these, you want to trade the breakout.
Rules:
• Wave B ends above the beginning of wave A
• Wave C ends higher than the end of wave A
• Usually wave C is the same length as wave A.
→ This kind of correction happen in really strong and fast markets, especially Bitcoin. The fast and high push of wave B and the short wave C are signs of a strong primary trend.
A parallel channel regularly marks the low of
wave C, marked by the yellow lines!
Contracting Triangle
Triangles represent a balance and even pressure of buyers and sellers within the market. They contain five overlapping waves with a 3-3-3-3-3 structure. The contracting triangle represents the most frequently appearing.
Rules:
• Triangles have 5 Waves: A-B-C-D-E
• All of the waves are corrective
• Upper line is declining, lower line is rising
• Wave E frequently overshoots the trendline and can also be a triangle
• Triangles only occur as a Wave 4/B/X/Y
• Never as a Wave 2/A
❗Triangles represent a continuation pattern for the dominant trend. Remember, continuation patterns are the main trend!

Double Head and shoulders BTCA true head & shoulders pattern doesn't occur very often, but when it does, man traders believe it's an indicator that a major trend reversal has occurred.
its actually a double head and shoulders patterns inside each other


$BTC got infected by mutant version overnightLooking for some thumbs up so i can speak in the chat,
Thank you :^*
GL Trading!
Disclaimer: This graph is not serious.


🅱️ Bitcoin Update (18/9) #BTC $BTC #BTCUSDTBTC is in a short-term uptrend and it is too early to fear.
BTC is on its way back to the 10600$ price zone to retest this zone before rising sharply to break the resistance at 11100$ to move up to the 11500$ zone over the next 3 days.
The 10600$ zone is a very good zone for us to buy either BTC or Long BTC
It is really dangerous if the 10450$ zone is broken.

Strong support line is not yet broken If the support holds, we could be seeing another leg up since weekly resistance was broken not long ago.

Head and Shoulders for BTCHello, traders.
What Does A Head And Shoulders Pattern Tell You?
The head and shoulders pattern is comprised of three component parts:
After long bullish trends, the price rises to a peak and subsequently declines to form a trough.
The price rises again to form a second high substantially above the initial peak and declines again.
The price rises a third time, but only to the level of the first peak, before declining once more.
The first and third peaks are shoulders, and the second peak forms the head. The line connecting the first and second troughs is called the neckline.


Bitcoin is literally hanging on the cliff! Have you ever heard about Fibo levels?!!!!!!!!!!! its from the highest 20k$ to the lowest 3k$
This is so beautiful! Look how the levels are immense and make full sense for me as a trader.

Another view (update)Hello everyone, this is our renko view on btcusdt, enjoy!
How to read:
I don't think those bricks want to lie as they say it clear: no stops during the rally, no rally. The bearish scenario is playing out perfectly in here, so now price will be rejected by fib 2.618 (9150, DONE). Now is forming a red brick, which may state both a sell opp at 9.5k-10k to come or the unlucky event of a new bearish trend which would bring price down to 6000. W gartley is very bearish even on this type of chart. We may be at first impulse wave or at second correction wave, probably we're going down. Moving from greed positions.
Strategy:
If 2 red bricks are built (8133), then short it to the death.
If 1 red brick and 1 green brick are built (8811), then long on the King.
This is not a trading advice, stay tuned for more predictions. Anlvis.
P.s. chart layout was changed while posting, take it as it is.

