Btc - Btc hits my T1 - bounce (to $71,500) is hitting resistanceHere is more granular look at price action. This is a copy of the 1 Day time frame chart I posted earlier today. But now I'm looking at the hourly now because Btc is moving faster then normal through this historical pattern. This crash from the high, has been one of the fastest moving crashes (through each of the signifiacnt moving averages). Faster then any other cycle.
Same pattern, different velocity, so it may look different then other cycles, but my expectation is the same. Btc is bottoming either at yesterdays low of $60K or possibly swipe the lows down to $48K-$50K (my money is on this lower low).
May the trends be with you.
Btctothemoon

Bitcoin -Is $60K the bottom...or $48K next...before lift off?On Jan 31st I suggested that Btc would dump to $60K (+/- 2K)...and then possibly to $48K-$52K. I was incorrect in my thought experiment about the typical price action pattern it would take. I did not anticipate a capitulation event. Noone can. Either way, I claimed that the targets (T2 and T3) were accurate bottoms, regardless of the path taken to get there.
Now that T2 was hit at $60K (during a 32% capitulation), I am suggesting that there is a historical price action that is associated with capitulation events at this point in the cycle (based on moving averages). I have calculated these targets carefully, as I believe this could be the low. Whether it's a local low or the market cycle bottom, is yet to be determined. But I'm already all in at T2 with a stop at break even.
*If T3 (48K-52K) gets hit, I'm backing up the money truck and loading up on Btc (and Coinbase stock).
May the trends be with you.

BTC bull market is not over, how should we plan for the future?#BTCUSD BINANCE:BTCUSDT BITSTAMP:BTCUSD BITSTAMP:BTCUSD
The BTC market did not experience much volatility over the weekend, and today it only rose to near the 90500 resistance level before falling back again. Judging from the hourly and 4H charts, BTC still has room for a pullback and adjustment, and may need to consolidate again before breaking through the upper resistance. Short-term support is at 87800-87000. If it falls back to this level, we can consider taking a small long position in BTC. The key support level remains at 85500-85000. As long as this range holds, the bullish trend for BTC remains intact

Bitcoin (BTC) — Potential Downside Scenarios | Stay AlertHello everyone!
In my bearish Bitcoin forecast from October 23 (you can find it under this post), I mentioned that I was expecting BTC to reach 83K first and then 60K.
As we can see now, Bitcoin has already hit 83K and even moved below it.
What stands out is that the current market structure closely resembles the pattern formed at the beginning of 2022 (highlighted in green on the chart:
). After that configuration played out, Bitcoin lost more than 50% of its value…
This is why we need to stay extremely cautious right now. It feels like the market may be pricing in a major upcoming global event, and I wouldn’t rely too much on the idea of a classic New Year rally.
A rally is only possible if the downside move happens very fast and impulsively.
For now, my primary downside target is around 75K.
After Bitcoin reaches this level, I’ll be carefully watching the structure of the decline, and based on the shape and behavior of that move, I’ll decide on the next potential directions for BTC.
On the current chart, I’ve outlined two potential downside scenarios:
1️⃣🟠Orange scenario — Bitcoin starts moving down directly from the current price.
2️⃣ 🟣Purple arrow scenario — Bitcoin first pushes higher toward 90–92K, and only then continues lower to break local lows.
What do you think? Drop a comment — which arrow do you see playing out for the drop?
Or maybe you disagree with my bearish view entirely? I’d love to hear your opinions either way!

BTCUSDT - What's Next? Bullish is over???BTC Daily & 4H Outlook
Bitcoin is showing mixed signals across the 1D and 4H timeframes. On the daily chart, BTC failed to hold the strong support zone and has now officially flipped it into a resistance. The drop also swept liquidity down to the 80.600 area before rebounding from the daily OB, which gives us a temporary relief bounce. Right now, price is pushing upward and may retest the resistance/supply zone above.
If BTC rejects strongly from that resistance, the market could be in trouble again because the downside target reopens toward the 83k–86k region. This area becomes even more important when we look at the 4H chart, where we still have a key support between 85.650–85.000. This zone must hold—if it breaks, then 83k becomes likely, and a worst-case scenario returns us to the 80k sweep zone.
For BTC to reclaim momentum and shift into a bullish structure, the market needs to break out above the major supply at 93.240. A clean breakout and confirmation would show strength and could trigger the next leg toward 98k–100k. If that happens, we may also see a strong positive impact on altcoins.

You will ask yourself, "how did he know Btc would dump to $80s"?On Oct 23rd I wrote:
"Btc bounce incoming off support? If not, and support is broken... long way down to 84K.
Too soon for concern, but Btc is currently bottom feeding off my lowest support".
Followers of my charts would know that "strangely accurate" calls have been made throughout Btc's recent months worth of price action. I anticipated the previous low (at $107K) and since September I have repeatedly expressed my concens about a dump to a lower low (see Sept-Oct Btc charts). The "3 Red Week Down Rule" warned us that this lower low was coming.
I simultaneously, posted charts warning that the altcoin market will be subject to the this "3 Red Week Down Rule"
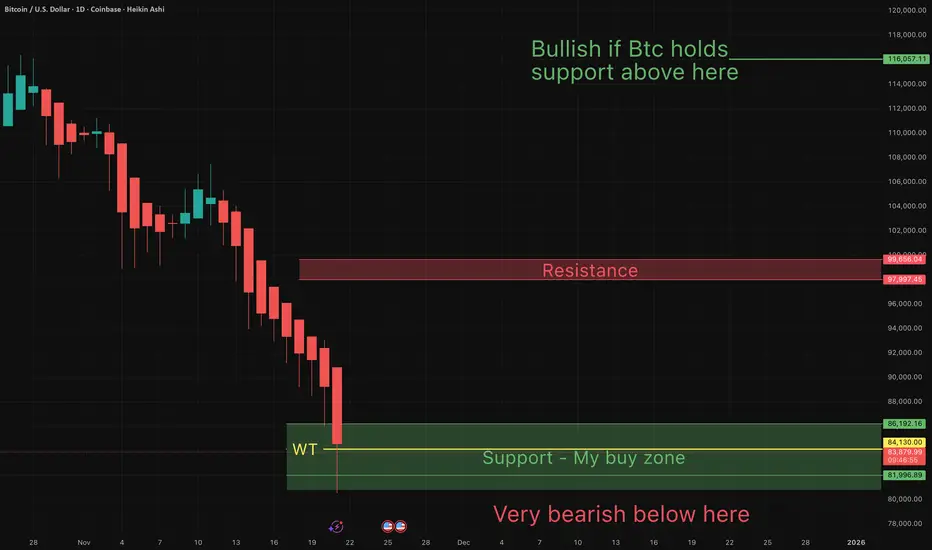
2 days ago I reminded my followers of my "All In" target at 84,200K (WT target).
Today Btc has hit the WT ($84,200) as anticipated, and is resting in my buy zone (currently at $84K). You will ask yourself, "how did he know Btc would do that"?
Congrats to those of you who have made significant gains...following along my journey.
May the truth be with you!
Will Btc bounce off this support?Btc bounce incoming off support? If not, and support is broken... long way down to 85K.
Too soon for concern, but Btc is currently bottom feeding off my lowest support.
Followers of my charts would Know that "strangely accurate" calls have been made throughout Btc's recent months worth of price action. I anticipated this recent low and expressed my concens about this dump to a lower low. But I wish I knew how low and how long Btc stays in this lower range.
What I do know is that the "3 Red Week Down Rule" warned us that this lower low was coming. So now is a way better time to concider this asset, than at the recent top!
-Good luck

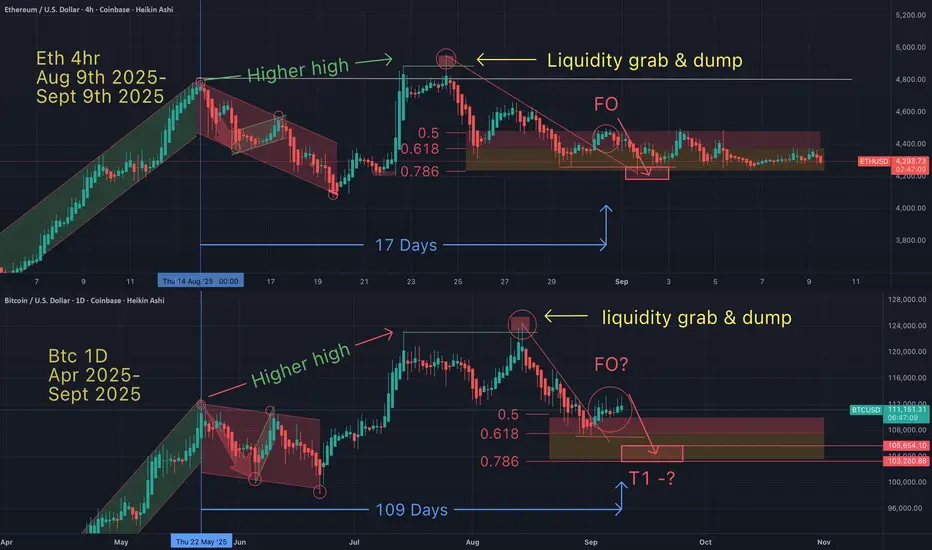
Btc is STILL following this Eth fractalIf Btc continues to follow this Eth fractal, one might anticipate a Btc bottom no less than 102K.
What are your thoughts?
May the trends be with you.

You will ask yourself "how did he know Btc would do that?On Aug 9th I suggested that Btc could dump as low as 107,800. The actual low came within a small margin of that.
On Sept 2nd I suggested that the bottom was in and Btc would soon bounce to 1 of my 3 targets.
On Sept 11th, I also suggested that a lower low was probable (below 107K).
On Sept 17th, the top of the run was called and we saw the anticipated reversal.
I also anticipated the day (time frame), the reversal would occur.
TA works for both the X and Y axis (for both price and time).
I wrote "the bounce was coming to an end within 5 days". On day 6 Btc fell.
I honestly thought Btc would form it's lower low when I published the above charts. But instead we got that low probability pattern of a liquidity grab above the local high...THEN swipe the lows, to form a lower low afterwards. This pattern liquidated all the longs and the shorts, in what tunred out to be the biggest liquidation event in crypto history.
Either way, we got the anticipated lower low and we were spared a catastrophic dump..allowing us to be on the right side of the trade. It's safe to say this was not a surprise, but anticipated and therefore we profited.
TA works! Thank you "3 Red Week Down Rule". lol
Btw I have been suggesting (for weeks), that Btc would hit a lower low, based on the "3 Red Week Down Rule". While everyone on social media is blaming Friday's announcement on China tariffs, for cuasing this lower low.
'Show me the chart and I'll tell you the news"
-Bernard Baruch
Pattern's can be predictive! Learn them all.

BTCUSD – Bulls Strong but Overbought! | 4H AnalysisBitcoin (BTCUSD) has rallied sharply from $110K to $124K, gaining strong bullish momentum. Price is now trading well above the 20/50/100/200 SMAs, confirming the uptrend. However, RSI is entering the overbought zone, suggesting a possible short-term pullback before continuation.
🔹 Technicals
Trend: Strong Bullish (above all major SMAs)
Resistance: $124,500 – $126,000
Support: $122,500 (20 SMA), $120,000, $118,000
RSI: Near 70–75 → Overbought, slight bearish divergence
✅ Bullish Case:
If price sustains above $122,500 and breaks $126,000, we may see an extension toward $128,000 – $130,000.
⚠️ Bearish Case (Pullback):
Failure to break $126,000 could trigger a correction toward $120,000 – $118,000 before another leg higher.
📌 Trading Plan
Long Entry (dip-buy): $122,500 – $120,000
Target: $126,000 → $128,000 → $130,000
Stop Loss: Below $118,000
🔑 Summary
Bitcoin remains in a strong bullish trend, but the market is short-term overheated. Best opportunities are on dips or a confirmed breakout above $126K.

Don’t Blink! BTC Signal Turns Bearish# BTC Quant Signals Stock 1M Prediction — 2025-09-28
CRYPTOCAP:BTC Quant Signals Kline Signal
📊 **CURRENT MARKET STATUS**
* Current Price: **$48.71**
* Data Quality: **Good**
* Timeframe: **1-Minute Bars (Scalping)**
---
🎯 **SCALPING PRICE PREDICTIONS**
* 30-Minute Target: **$48.32 (-0.81%)**
* 2-Hour Target: **$48.39 (-0.66%)**
* End-of-Day Target: **$48.49 (-0.45%)**
📌 Extended Outlook
* Final Target: **$48.39 (-0.66%)**
* Predicted Volatility: **21.8%**
* Expected Range: **$48.30 – $48.83**
---
📈 **SCALPING TREND ANALYSIS**
* Direction: **BEARISH**
* Confidence: **64%**
* Support: **$48.30**
* Resistance: **$48.83**
* Range Size: **1.1% of current price**
---
💰 **INTRADAY TRADE RECOMMENDATION**
* Direction: **SHORT**
* Entry Price: **$48.71**
* Target: **$48.45**
* Stop Loss: **$49.44**
* Confidence: **64%**
* Risk/Reward: **0.35 : 1**
* Session: **Intraday (1m bars)**
* Trend: **BEARISH**
#BTC #Crypto #Scalping #QuantSignals #TradingView

Is Btc STILL following this Eth Fractal? On Sept 9th I suggested Btc was following this Eth Fractal.
On Sept 12th I expressed concern for a lower low, and Btc seems to be heading lower now.
If Btc (on the 1 Day) is following this Eth (4 hr) fractal, then Btc may soon see a lower low (below 107). Alts may bleed harder.
I hope I'm wrong. But I am cautious for several reason, as also indicated in my other previously published charts.

Btc - Lower low incoming?Based on the "3 red week down rule" a lower low is expected (with high probability).
He's a simplified chart of what I am expecting in the short term.
May the trends be with you.

You will ask yourself, "how did he know Btc would do that"?On Aug 9th, I suggested Btc would bottom as low as 107,700, before a bounce.
On Sept 9th I suggested Btc had bottomed at my target, and would bounce to between $114K-118K (within 18 days)...the form a lower low. Day 19 began this current retrace.
Each of these predictions have come true with the exception of the lower low (below $107K). So congratulations to everyone who have been making gains based on my everything I have been charting.
The question remains, will the "3 red week down rule" and my statistical analysis of it's historical price action continue to play out? So far it looks that way. If so, there's another bounce incoming at my red T1.
PS I don't point out my accuracy to brag, but moreso I want to accomplish 2 things.
1-Prove that TA works - for all those non believers (and I encourage you to learn).
2-Keep track of my accuracy stats (and so should you...how else would we know who we should follow).
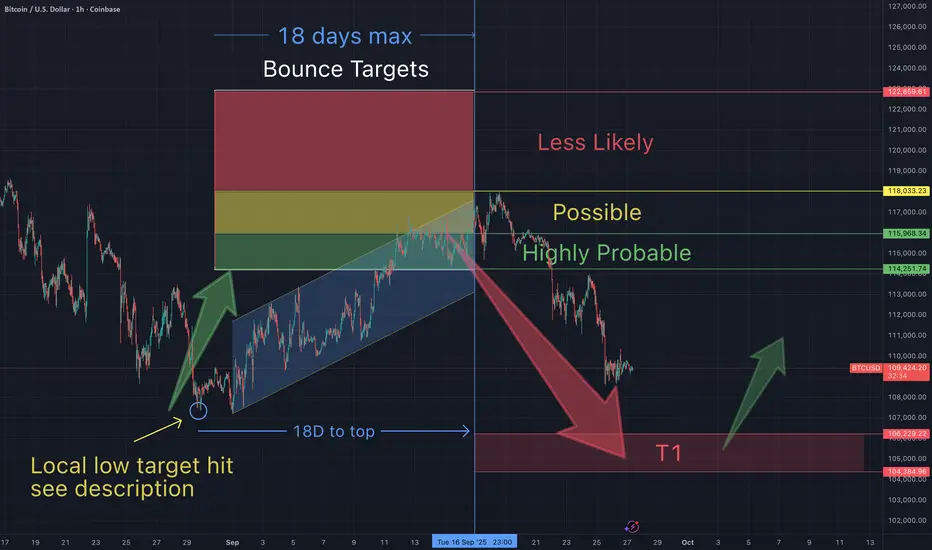
Btc is Bullish - it approaches an end of a historical timelineOn Sept 3rd I had suggested that Btc had bottomed and would bounce into one of my 3 targets. As anticipated Btc has now hit the top of target 2 (T2).
More importantly, I suggested Btc would bounce to these targets within 1-2 weeks ("18 days max"). Meaning based on a the patterns involving 3 red weeks down, Btc always sees the bounce end by day 18 or sooner...then retraces (often below the previous low -ie $117K).
Yet we are now at day 18 and Btc is not showing signs of a retracement. If Btc does not begin it's retrace today, then this is very bullish for Btc and the altcoin market. I am cautiously bullish as my bias has changed as a result of this new data. We must learn to pivot our trading strategies as price action unfolds. But being able to apply strategies to anticipate price action, helps us to know immediately when our trade ideas are being invalidated. It appears we possibly have an invalidation and I am shifting my approach accordingly.
Btc to the moon. Let's go!

You will ask yourself "how did he know Btc would do that"?On Aug 8th I suggested that based on my research of historical data, Btc would bottom as low as 107K. Btc bottomed at 107...and I then suggested a "bounce incoming".
On Sept 2nd I suggested that Btc had hit a bottom and was about to bounce into 1 of my three targets within 2 weeks. We are at the end of that 2 week period and T1 and T2 have been hit.
Question remains where do we go from here?
The 3 week down rule suggests that we form a lower low (below 107K). Will today's Fed meeting be the excuse for that pattern to play out?
What are your thoughts? I'd like to hear from you to gauge sentiment.

Is Btc STILL following this fractal?If Btc (on the 1 Day) is following this Eth (4 hr) fractal, then Btc may soon see a lower low.
I hope I'm wrong. But I am cautious for several reason, as also indicated in my other previously published charts.
Trade safe...

CAUTION: Bitcoin may top within the next 1-5 daysOn Sept 2nd I suggested that Btc would see a bounce into 1 of my 3 targets. Btc has now entered the first zone. I am now cautiously on the look out for a reversal within the next 5 days (by Sept 16th). This expectation is based on my previous chart published where I stated "there is a possibility, based on the 3 week down rule, that the reversal from my targets, may lead to a lower low to my T3 (below current low at 107.5K).
My Aug 31st call for a T2 bounce hit perfectly. But I hope I'm wrong about a drop to T3
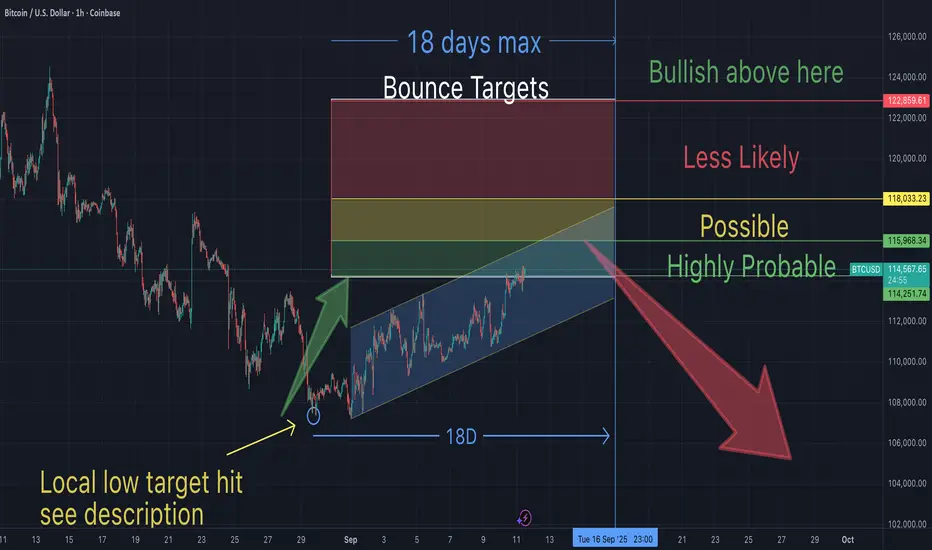
If Btc can hold support above 123K I will become very bullish. Until then I remain cautious, becuase I don't want to round-trip my gains. Proper risk management is crucial for me.
Is the Btc 1D chart following an Eth 4 hr chart fractal?Is the Btc 1D chart following an Eth 4 hr chart fractal? Sure looks that way. This also adds confluence to the other Btc chart update I posted today, suggesting Btc would hit a lower low withing the next week. I hope I'm wrong for those of you that are long.
BTC LOWER LOW INCOMING?On Aug 9th I suggested a breakout pattern that would lead Btc (with the highest probability) to an ideal low around $108K. This was based on a repeating historical Btc pattern I discovered.
That pattern played out as anticipated and on Aug 31st I called the bottom at $107,300 and suggested a "bounce - incoming".
I've held this long since the bottom, but I believe the anticipated bounce may be ending soon. I am anticipating a reversal at the above targets on/or before Sept 18th
With the highest probability, this reversal will lead to a lower low (below $107K).
"IF" Btc holds support above $123K I will switch to a more bullish stance. Until then the stats point downward.
Trade safe and may the trends be with you.

BTC Bounce Incoming! Buy the Dip Before It Soars!
🚨 **BTC Dip-Buy Alert! 💎🚀**
**Buy the dip, ride the bounce!**
**📊 Market Bias:**
* Short-term: 🟡 Mildly Bearish / Neutral (price < SMA20/50, 1H/4H mixed)
* Medium-to-long-term: 🟢 Bullish (price > SMA200; key support 101,640–106,900)
* Strategy: Controlled **mean-reversion long** from lower BB → mid/upper BB
**💵 Trade Setup (Enter at Open):**
* **Direction:** LONG
* **Entry Range:** 109,800 – 110,500 (Ref: 110,080)
* **Stop Loss:** 106,900 (hard stop, optional widen to 106,500)
**🏹 Take Profit / Tiered Exits:**
* **TP1 (30%):** 111,786 ⚡ (SMA20 / BB mid)
* **TP2 (50%):** 116,672 🟢 (BB upper / primary target)
* **TP3 (20%):** 120,000 🚀 (extension if momentum resumes)
**💡 Position Sizing Example:**
* Risk 1% of account → For \$100k: \~0.314 BTC
* Max Risk: 1–2% portfolio
* Leverage: 3–5x if using margin; avoid >10x
**📈 Confidence:** 59% ✅ (moderate, controlled risk)
**⚠️ Key Risks:**
* Daily close <106,900 or break under SMA200 (101,640) → bearish flip
* Macro shock, DXY surge, or equity sell-offs may override technicals
* Missing Open Interest data → possible crowding/liquidation risk
* Rapid funding spikes / large OI → potential short squeeze
**💎 Trade Rationale:**
* Price in corrective pullback inside long-term bull (above SMA200)
* MACD histogram improving 📊
* RSI leaves room for mean-reversion
* Favorable risk/reward from lower BB → BB upper (\~116.7k)
**⚡ Execution Notes:**
* Enter at market open
* Use tiered TPs
* Strict stop & position sizing
---
📊 **TRADE DETAILS**
🎯 Instrument: BTC
📈 Direction: LONG
💰 Entry Price: 110,080
🛑 Stop Loss: 106,900
📊 Size: 0.314 BTC
💪 Confidence: 59%
⏰ Entry Timing: market\_open
🕒 Signal Time: 2025-09-07

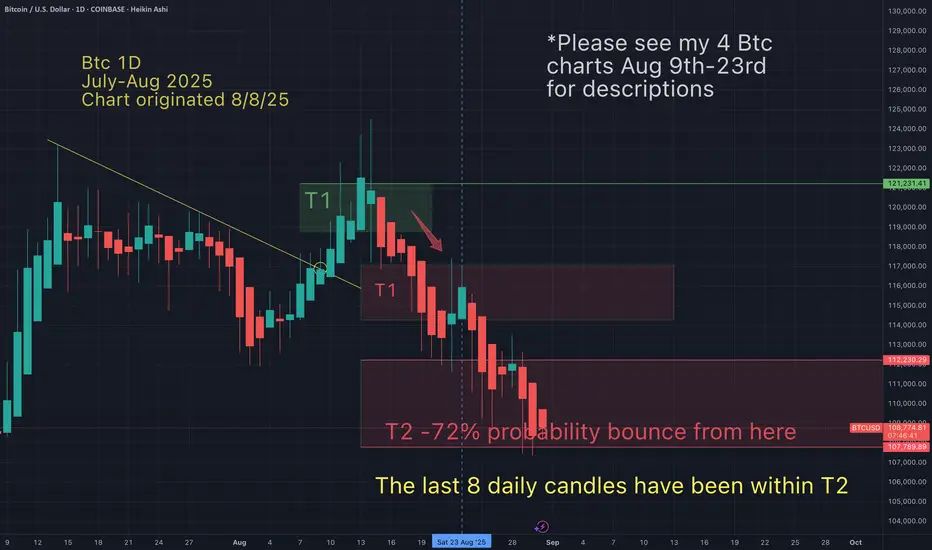
Btc bottoming - See my short term bounce targetI have been anticipating a Btc local bottom as low as 108K since Aug 9th. It was a high probability call, because it's what Btc always does! Follow the patterns...
Now that my T2 has been hit, I anticpate a bounce into my high probability range as seen in the above chart. I will be monitoring price action very closely to see if either of the other 2 higher targets are possible before my anticipated reversal. I will be taking profit at the top of this bounce.
There is a possibility, based on the 3 week down rule, that the reversal (from my targets) may lead to a lower low to my T3 (below current low at 107.5K). This may happen as soon as late Sept- Oct. I hope I'm wrong about that.
May the trends be with you.

Btc price action unfolds exactly as anticipated-Bounce incoming?On Aug 9th I suggested the following:
As of today Btc has been bottoming at my T2 after following the anticipated price action suggested in the above chart. TA works!
May the trends be with you.