Bitcoin BTC price analysis💰 Looks like buyers managed to defend the critical $62–64K zone for OKX:BTCUSDT — exactly the area we’ve been talking about.
🎯 Now the key task for this week is clear:
hold above $65,800 – 67,300
📈 If CRYPTOCAP:BTC stays above this range, it will confirm strength and significantly increase the probability of a move toward $88K before spring
📉 But if the market loses this level, it will be a strong signal of weakness — and the road toward $50K could open fast
😱 The Fear & Greed Index has been sitting at 7–14 all February — historically, this is where bottoms tend to form.
At the same time, BTC.D and USDT.D dominance charts are at critical resistance.
If they drop, capital will likely rotate into altcoins — and that’s how mini altseasons begin.
❓ Which sector do you think will attract capital first and lead the next move: memes, AI, GameFi, Ethereum ecosystem — or something completely new?
______________
◆ Follow us ❤️ for daily crypto insights & updates!
🚀 Don’t miss out on important market moves
🧠 DYOR | This is not financial advice, just thinking out loud
Btctrade

Chart Analysis – Bullish Reversal Toward Resistance
The 1-hour chart of Gold vs US Dollar (XAU/USD) shows a strong bullish recovery after a sharp sell-off. Price has reclaimed a key demand zone and is now pushing toward a major resistance level.
🟢 1. Demand Zone Holding (Bullish Structure Intact)
Price sharply dropped into the 4,880–4,920 support area
Strong rejection from the lows (highlighted reaction zone)
Higher low formed after the bounce
Momentum shifted bullish with consecutive higher highs and higher lows
This confirms buyers stepped in aggressively at discount levels.
🔴 2. Stop Loss Zone
The marked 4,930–4,950 region acts as invalidation.
A break below this zone would:
Disrupt bullish structure
Indicate potential continuation downside
Suggest failed breakout attempt
As long as price remains above this level, bullish bias remains valid.
🟩 3. Current Resistance Zone
Price is now testing 5,020–5,060 supply area
This zone previously acted as consolidation and breakdown area
Reclaiming and holding above it turns it into support
A clean breakout and close above 5,060 increases probability of continuation.
🎯 4. Upside Target
If breakout confirms:
Next major resistance: 5,120–5,150
Strong momentum could extend toward the psychological 5,200 region
📊 Technical Structure Summary
Level Type Price Zone Meaning
Major Support 4,880–4,920 Strong demand reaction
Invalidation 4,930–4,950 Stop loss area
Breakout Level 5,020–5,060 Key resistance flip
Target Zone 5,120–5,150+ Upside objective
📌 Bias: Bullish Above 4,950
Holding above support → continuation likely
Break and close above 5,060 → acceleration expected
Failure below 4,930 → bearish pressure returns
If you'd like, I can also provide:
A short trading plan version
Risk-to-reward breakdown
Intraday scalp vs swing perspective
Or convert this into a caption for social media 🚀

Range Accumulation After Sell-Off, Bullish Breakout in ProgressMarket Overview
On the 1H timeframe, BTCUSD shows a clear transition from a strong bearish impulse into a structured accumulation phase, followed by an early-stage bullish breakout attempt.
Phase 1: Distribution & Breakdown
Price formed a distribution range near the 76,000–78,000 zone.
Multiple rejection wicks at the range highs indicated supply absorption.
Breakdown below range support triggered a strong impulsive sell-off.
The descending channel structure confirms aggressive bearish momentum.
Phase 2: Capitulation & V-Shape Recovery
Sharp sell-off into the 60,000–62,000 demand zone.
A strong bullish reaction suggests liquidity sweep and institutional accumulation.
The recovery rally broke minor structure, signaling short-term trend exhaustion.
Phase 3: Consolidation Range (Accumulation)
Price entered a tight sideways structure between 67,000–71,000.
ALMA (9) flattening indicates volatility compression.
Repeated higher lows inside the range suggest buyers gradually gaining control.
Current Structure
Price is breaking above range resistance around 69,700–70,000.
Momentum shows bullish expansion after reclaiming moving average support.
Structure is shifting from range-bound to bullish continuation.
Trade Idea
Entry Zone: 69,500–70,000 (break and hold above range high)
Target Zone: 72,000–73,000 (previous supply area)
Invalidation: Clean rejection back inside the range below 68,500
Technical Confluence
Range breakout pattern
Higher low formation
Moving average support reclaim
Volatility expansion after compression
Conclusion
BTCUSD is transitioning from post-selloff consolidation into potential bullish continuation. Sustained acceptance above 70,000 increases probability of a move toward 72,000–73,000. Failure to hold above breakout level would likely return price to mid-range consolidation.

Eliana | BTC – Bullish Continuation After ConsolidationBITSTAMP:BTCUSD
BTC is showing a strong impulsive move followed by healthy consolidation near resistance.
Structure remains bullish with higher highs and higher lows intact.
Price is holding above short-term demand, indicating accumulation rather than distribution.
Break above the current range could trigger continuation toward upper liquidity zones.
🎯 TP1: 69,800
🎯 TP2: 71,200
🎯 TP3: 73,000
📍 Entry Zone: 67,800 – 68,200
🛑 Stop Loss: 66,900
⚠️ This is only for educational purpose.

BTC bottoms with 200W SMAHistorically 200W SMA indicates BTC bottoms. If price touches or break down the 200W SMA, I will look for negative divergency on 30D RSI. We have seen same pattern 2018 and 2022.

BTCUSD Bearish Channel Breakdown – Retest Rejection Targets 67.2🔍 Market Structure Overview
Price was moving inside an ascending channel (blue).
BTC broke down below the channel midline and lower trendline, which signals loss of bullish structure.
After the breakdown, price attempted a weak pullback but failed to reclaim resistance.
👉 This shifts bias from bullish continuation → bearish continuation.
📉 Current Bearish Setup Explained
1. Break & Retest Failure
Price broke below channel support
Retest attempt was rejected (your red arrows + blue arrow confirm this)
This is classic break → retest → continuation
2. Key Levels
Resistance (sell zone):
67,689 – 67,988
Stop Loss:
~70,120 (above prior structure high & channel)
Target Zone:
~67,200 (projected move ≈ -3.7% / -2,587 points)
This gives a clean RR with structure-based invalidation.
🧠 What This Means
As long as price stays below 67,900–68,000, sellers remain in control
Any bullish move that fails under resistance = sell the rejection
Only a strong close back inside the channel would invalidate this idea
📌 Trade Bias Summary
Bias: Bearish 📉
Entry: Sell on rejection near resistance
Invalidation: Above 70,120
Target: 67,200 (and potentially lower if momentum accelerates)

#BTC/USDT Let Bitcoin make a new ATH#BTC
The price is moving within a descending channel on the hourly timeframe. It has reached the lower boundary and is heading towards a breakout, with a retest of the upper boundary expected.
The Relative Strength Index (RSI) is showing a downward trend, approaching the lower boundary, and an upward bounce is anticipated.
There is a key support zone in green at 70737, and the price has bounced from this level several times. Another bounce is expected.
The RSI is showing a trend towards consolidation above the 100-period moving average, which we are approaching, supporting the upward move.
Entry Price: 68800
First Target: 69226
Second Target: 69910
Third Target: 70737
Stop Loss: Below the green support zone.
Remember this simple thing: Money management.
For any questions, please leave a comment.
Thank you.

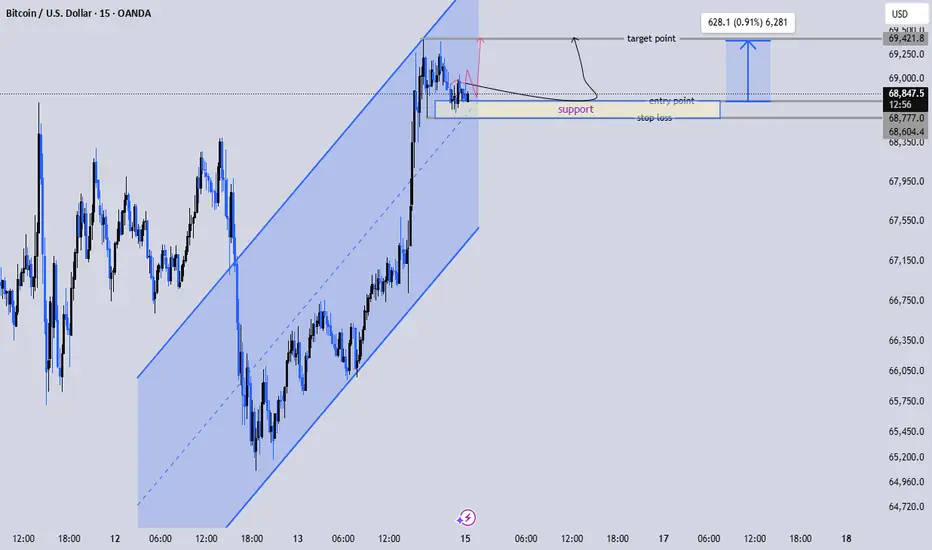
BTCUSD Bullish Consolidation at Support – Breakout Target 69.4K🎯 Trade Structure
Entry: ~68,866
Stop Loss: ~68,600–68,700 zone
Target: ~69,420
RR around 1:2.5–1:3 (solid intraday play)
Target aligns with:
Equal highs liquidity
Minor resistance / psychological 69.4k area
Channel upper boundary
🚨 Invalidation
Clean 15M close below support box (~68.6k)
Breakdown of consolidation with volume expansion to downside
If that happens, we likely retrace deeper into channel mid-range.
Bias
As long as BTC holds above that support block, buyers are defending aggressively. This looks like bullish continuation loading, not distribution.
You aiming for quick scalp to liquidity or holding for breakout above 69.5k
BitcoinBTCUSD
- Demand Zone
- Break of Structure
- Completed " 12345 " Impulsive Waves and " ABC " Corrective Waves
- Change of Characteristics
- RSI - Divergence

BTC/USD 45m Chart Analysis – Bearish Rejection at Supply1️⃣ Market Context
Timeframe: 45-minute
Price is trading around $69,768
Overall short-term structure shows recovery from ~65k into a key resistance zone near 70k–70.5k
2️⃣ Key Observations
🔴 Major Resistance (Supply Zone)
Strong rejection around $70,000–$70,500
Multiple prior reactions from this level
Long upper wick shows sellers defending aggressively
📈 Bullish Structure Before Rejection
Clean ascending channel from ~65k
Breakout above 67.7k level
Strong impulsive move into resistance
This looks like a liquidity sweep above previous highs, followed by rejection.
3️⃣ Trade Idea Shown on Chart
Entry: Near 69.8k–70k
Target: Around 67.7k
Bias: Short (counter-trend scalp)
The target aligns with:
Previous breakout level
Minor support / demand flip zone
Potential retest of structure
4️⃣ What Confirms the Short?
✅ Lower high on lower timeframe
✅ Breakdown below intraday support (~69.2k area)
✅ Increasing bearish momentum
Without breakdown confirmation, price could:
Consolidate under resistance
Attempt another push above 70.5k
5️⃣ Risk Factors
⚠️ Trend on this timeframe is still making higher lows
⚠️ A clean break and close above 70.5k invalidates short bias
⚠️ High volatility near psychological 70k level
6️⃣ Overall Outlook
Short-term: Bearish pullback likely toward 67.7k
Mid-structure: Still bullish unless 67k breaks decisively
Invalidation: Strong close above 70.5k

You will ask "how did he know Btc would do that"?This is a continuation of yesterday's chart. I have added the current support and resistance targets that I am watching. I've included the history of how I derived these price targets below:
On Nov 18th 2025 I suggested that Btc was headed for a bottom at $84K (+/-2K).
I expressed concerns about a very bearish move if the price fell below $81K. On Nov 21st that low $80s target was hit. Only later to be violated to the downside.
On Nov 30th I suggested that Btc had bottomed at $80K & would bounce up to $98-99K and get rejected. On Jan 14th 2026 my target of $98K was hit with strange accuracy...and rejected as anticipated.
Once Btc was rejected at $98K, I suggested the recent lows at $80K would be swiped. I once again expressed concerns about a very bearish move if the price fell below this local low.
Once the $80K low was swiped (T1), I suggested (on Jan 31st) that the next bearish target would be hit at $60K (+/-2K).
On Feb 6th, my $60K target was hit, and the anticipated significant bounce to follow (20%)
On Feb 6th, I outlined the typical bottoming structures and targets based on my studies of historical price action and statistical analysis. This lead me to expect a bounce from $60K to $71K (+/-1K)...and then a minimum retrace to $62-$65K
On Feb 6th my bullish target at $71K was hit and I suggested that it had met resistance and would be rejected down to my next bearish target ($62K-$65K).
That target of $65K was hit yesterday, as seen in today's chart.
Those that follow me know that I was warning of this significant drop since I mentioned the "three red week down rule" since Sept 2025. I said not only would btc soon crash, but also top alts would follow (ie xrp). This chart called the top for Xrp:
This chart called the top for Btc:
TA works! It works on all assets, in all time frames, across all markets. The question is how? How can someone like me be so "strangely accurate"? After all, I don't have a crystal ball. Please know I'm not boasting, I've just been doing this a long time and I want to show you how predictable it can be. Hopefully this will encourage you to learn TA. Also, I post here to keep track of my calls and to share my trading ideas (I want us all to succeed). Hopefully this offers some insights as to how effective technical analysis can be. I encourage you all to become students of this trade. Technical analysis education is the only way we can gain any competitive edge in these fast moving markets. Everything else is just noise.
Congratulations to everyone that has taken these trades and are in significant profit.
May the trends be with you.

#BTC/USD Buy Trade Scenario.Here’s an up-to-date #BTC/USD Buy trade outlook (technical + fundamental) to help you assess whether positioning for a Upside makes sense right now.
Thank You......

BTCUSD 15M | Support Hold Aiming for 69.9K BreakoutStructure Overview:
Clear ascending channel with higher highs and higher lows.
Strong impulsive breakout toward 68.8K.
Current price consolidating above support (68.5K–68.6K zone).
Bullish continuation likely if support holds.
📈 Trade Setup:
Entry: 68,500–68,600 (support retest area)
Stop Loss: Below 68,100 (under structure support)
Target: 69,900–70,000 (upper resistance / liquidity zone)
🧠 Market Logic:
Buyers stepped in aggressively from channel support and pushed price toward local highs. The consolidation above 68.5K suggests absorption rather than rejection. As long as price holds above the support block, continuation toward 69.9K liquidity looks probable.
A breakdown below 68.1K would weaken the bullish structure and shift bias short-term bearish.

BTC : (Perfect Profits 69K)Bitcoin has performed as expected and made our buy stop valid as I had mentioned and predicted it has hit our (TP) with minimum to no drawdown, below I shall share the trade recap - Btcusd Buy @ 67323.41
TP1 : 67532.01
TP2 : 67729.05
TP3 : 67924.17
TP4 : 68238.67
SL : 66120.03

Eliana | BTCUSD · 15M – Pullback Into Demand | Reversal Attempt BITSTAMP:BTCUSD
After rejecting from the 71.5K supply zone, BTC entered a controlled sell-off and respected the 67.8K level before breaking lower. The current price action shows compression into demand, suggesting potential liquidity absorption. If buyers defend this zone, a relief rally toward mid-range resistance becomes likely.
Key Scenarios
✅ Bullish Case 🚀
• Hold above 66,200 demand
• 🎯 Target 1: 67,800
• 🎯 Target 2: 69,000
• 🎯 Target 3: 71,500
❌ Bearish Case 📉
• Clean breakdown below 66,200
• 🎯 Target 1: 64,800
• 🎯 Target 2: 63,000
• 🎯 Target 3: 60,250 (major liquidity)
Current Levels to Watch
Resistance 🔴: 67,800 → 71,500
Support 🟢: 66,300 → 66,200
⚠️ Disclaimer: This analysis is for educational purposes only. Not financial advice.

Eliana | BTCUSD · 15M – Range at Resistance | Decision ZoneCOINBASE:BTCUSD BITSTAMP:BTCUSD
After a strong bullish impulse from the 60k liquidity sweep, BTC formed a distribution range near 71.5k resistance. This behavior indicates smart money indecision: either a liquidity grab above range for continuation or a breakdown toward deeper supports if trendline fails.
Key Scenarios
✅ Bullish Case 🚀 →
• Clean breakout and acceptance above range resistance
• 🎯 Target 1: 72,200
• 🎯 Target 2: 73,000
❌ Bearish Case 📉 →
• Rejection from resistance + trendline breakdown
• 🎯 Downside Target 1: 67,800
• 🎯 Downside Target 2: 65,000
• 🎯 Downside Target 3: 60,250
Current Levels to Watch
Resistance 🔴: 71,400 – 71,600
Support 🟢: 70,000 → 67,800
⚠️ Disclaimer: This analysis is for educational purposes only. It is not financial advice.

BTCUSDT: Structure Break & Bearish Channel ContinuationHi!
Bitcoin has shifted into a clear bearish market structure after breaking the long-term ascending trendline and losing the key horizontal support zone. Price is now trading inside a descending channel, confirming downside momentum.
The recent breakdown below the 68K support area turned previous support into resistance, increasing the probability of continuation toward lower liquidity zones.
Market Structure
Broken ascending macro trendline
Lost major horizontal support
Clean rejection from broken support → resistance flip
Price respecting bearish channel boundaries
Bearish Scenario (Primary Bias)
If the price continues to respect the channel resistance, further downside is likely.
Target Zones:
Target 1: 60,000 – 58,000
Target 2: 55,000 – 53,500
Important Context – Monthly Support
This setup comes with reduced statistical confidence because the price is approaching a higher timeframe (monthly) support region.
That means:
Downside continuation is possible
But sharp bounces can happen unexpectedly
Overall win rate of this bearish continuation idea could be lower than usual due to higher timeframe demand presence

BTCUSDT | Executing Inside Demand | LONGBitcoin is trading around 65k, interacting with a short-term reaction area after the recent sell pressure.
There are visible supports and buying interests developing around these levels.
However, they are not the strongest ones, which means reactions here can still be unstable and produce volatility before a clearer move appears.
From a structural perspective, price is extended on the downside while higher targets remain open toward the 74k – 75k region if buyers manage to build momentum.
There are two key decisions from this point.
If demand responds and price starts pushing higher, protecting the position quickly becomes the priority.
A recovery into upper inefficiencies could accelerate once short pressure gets absorbed.
If the market prints another leg down, I am prepared for additional participation near 62.5k, deeper inside demand.
Averaging 65k and 62.5k would leave the position around 63,750, still a solid and competitive entry within the broader structure.
In percentage terms, it is a relatively small fluctuation to improve positioning, while the upside window toward the targets offers a much larger potential expansion.
At the same time, the market might never give the discount.
A bounce from current levels remains completely possible.
Execution means being prepared for both outcomes.
I am already entering this position.
Good luck everyone.

BITCOIN IS GETTING READY FOR A MASSIVE MOVE!!!!! (trap) Yello Paradisers! Enjoy the video!
And Paradisers! Keep in mind to trade only with a proper professional trading strategy. Wait for confirmations. Play with tactics. This is the only way you can be long-term profitable.
Remember, don’t trade without confirmations. Wait for them before creating a trade. Be disciplined, patient, and emotionally controlled. Only trade the highest probability setups with the greatest risk to reward ratio. This will ensure that you become a long-term profitable professional trader.
Don't be a gambler. Don't try to get rich quick. Make sure that your trading is professionally based on proper strategies and trade tactics.

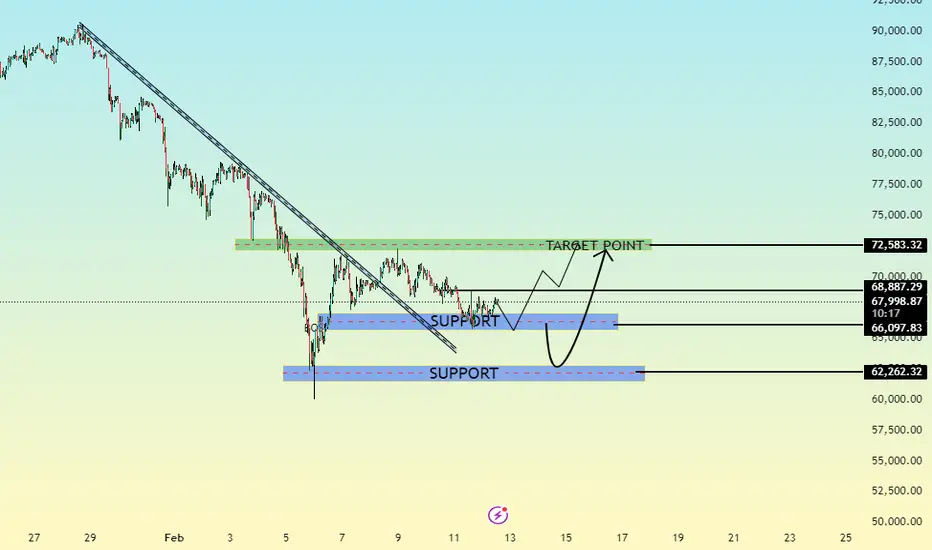
BTCUSD BEARISH ANALYSIS [READ CAPTION]GIVE YOUR OPINION ABOUT THIS ANALYSIS
Key Support Zones
Support Zone 1: 66,097
This level is acting as immediate support.
Price is currently consolidating above this area, indicating potential accumulation.
A strong hold above this level keeps short-term bullish recovery valid.
Major Support Zone: 62,262
This is the broader demand area and the origin of the strong bullish reaction.
If price revisits this zone, buyers are expected to defend aggressively.
A breakdown below 62,262 would invalidate the recovery scenario and shift bias back to bearish.
🔴 Resistance Levels
Minor Resistance: 68,026 – 68,887
This area represents short-term supply and recent consolidation highs.
A clean break above this region would confirm bullish continuation.
Target Zone: 72,583
This is the projected upside objective if momentum builds.
A successful breakout above resistance could drive price toward this level.
📈 Market Bias & Outlook
Holding above 66,097 → Short-term bullish recovery
Break above 68,887 → Momentum continuation toward 72,583
Rejection from resistance → Possible retest of support
Break below 62,262 → Bearish trend resumes
📌 Summary
The dominant trend was bearish, but the recent trendline break and strong reaction from support suggest a possible short-term structural shift. Confirmation will come from sustained price action above near-term resistance.
If buyers maintain control above key support, upside expansion toward the 72,583 target becomes increasingly probable.
BTCUSD 1H – Bearish Channel Retest & Rejection SetupPrice continues to respect the upper trendline of the bearish channel.
Recent bullish pullback pushed price into a key resistance zone (67,900–68,400 area).
This zone aligns with:
Channel resistance
Previous minor structure
Supply area
📉 Bearish Scenario:
Rejection from channel resistance suggests potential continuation downward.
Current setup favors a move back toward 67,300 support, possibly extending lower if momentum increases.
Stop loss positioned above 68,573, protecting against channel breakout.
📌 Key Levels:
Resistance: 67,900 – 68,400
Support Target: 67,300
Invalidation: Clean breakout and close above 68,600
💡 Conclusion:
As long as price remains inside the descending channel, rallies into resistance are likely to be sold. A confirmed rejection here strengthens the probability of continuation toward lower channel support.

IS BITCOIN READY FOR A HUGE PUMP?!!!!!! (must see) Yello Paradisers! Enjoy the video!
And Paradisers! Keep in mind to trade only with a proper professional trading strategy. Wait for confirmations. Play with tactics. This is the only way you can be long-term profitable.
Remember, don’t trade without confirmations. Wait for them before creating a trade. Be disciplined, patient, and emotionally controlled. Only trade the highest probability setups with the greatest risk to reward ratio. This will ensure that you become a long-term profitable professional trader.
Don't be a gambler. Don't try to get rich quick. Make sure that your trading is professionally based on proper strategies and trade tactics.

BTC Weekly Outlook: Institutional Demand vs. Whale Profit-Taking Bitcoin Bearish Factors (Negative News)
Whale Exchange Inflow: Large amounts of BTC are being moved from private wallets to exchanges, signaling potential mass selling by major holders.
Miner Capitulation: Mining companies are selling their BTC reserves to cover high operational costs, increasing market supply and putting downward pressure on price.
ETF Inflow Slowdown: Recent data shows a decrease in institutional buying through Spot Bitcoin ETFs, indicating weakened demand from big investors.
Regulatory FUD: Increasing talk and rumors about stricter government regulations and crypto tax laws in major economies, causing fear and uncertainty (FUD).
Profit Taking at Resistance: Traders are liquidating positions near psychological resistance levels (like $100k) to secure profits, leading to a temporary price pullback.
Bitcoin Bullish Factors (Positive News)
Institutional Adoption: Major financial institutions (like BlackRock and Fidelity) continue to increase their Bitcoin holdings, showing long-term confidence in the asset.
Growing Network Security: The Bitcoin Hash Rate is hitting new all-time highs, meaning the network is more secure than ever, which attracts long-term investors.
Limited Supply (Scarcity): With more BTC being locked in long-term storage and ETFs, the available supply on exchanges is dropping, which can lead to a "Supply Shock" and price spikes.
Lightning Network Expansion: Increased usage of the Lightning Network for faster and cheaper transactions is making Bitcoin more practical as a global payment system.
Global Macro Shifts: As people look for a "Hedge" (protection) against traditional currency devaluation, Bitcoin is increasingly seen as "Digital Gold."
