Bitcoin Technical Outlook | Bearish Scenario in FocusBitcoin is trading inside a clear descending consolidation structure after a strong bearish impulse from the 116k area. Price has repeatedly failed to reclaim the resistance zone 102,600–98,400 and is now compressing inside a bearish triangle showing weak momentum and lower highs. Multiple BOS and CHoCH signals confirm sellers remain in control. The broader structure is still bearish while price stays below the descending trendline and the 95k–100k supply zone. This consolidation suggests a continuation move lower, with downside liquidity resting below the 73k and 69k levels.
🔻 Trade Plan:
Bias: Bearish continuation
- Sell Zone: 92,500 – 95,000 (trendline + structure resistance)
- Sell Confirmation: Rejection / bearish candle inside the triangle or at resistance
- Targets: TP1: 80,500, TP2: 73,800 (strong low), TP3: 69,000 – 66,800 (major liquidity & fib extension)
- Invalidation: Daily close above 100,000 – 102,600
Note
Please risk management in trading is a Key so use your money accordingly. If you like the idea then please like and boost. Thank you and Good Luck!
Btctrade

BTC/ISD)Bullish trend analysis Read The captionSMC Trading point update
Technical analysis of BTCUSD – Daily (1D) chart using SMC + Fibonacci + EMA mean-reversion logic.
⸻
Market Context
• Higher-timeframe bias: Bullish (macro)
• Long-term structure still intact despite the pullback
• Current move down = deep corrective phase, not confirmed trend reversal yet
• Price is trading below EMA 50, but reacting near EMA 200 + HTF support
⸻
What Happened (Why BTC Dropped)
• Liquidity taken at the October high
• Sharp impulsive sell-off → distribution + stop-hunt
• Price retraced into a high-confluence discount zone
⸻
Key Demand / Accumulation Zone (Blue Area)
~85,000 – 92,000
This zone is important because it aligns with:
• Fib OTE zone (0.705 – 0.79)
• Previous daily demand
• Range low support
• Proximity to EMA 50 (93K) → mean reversion magnet
• Multiple long lower wicks → absorption
This suggests smart money accumulation, not panic selling.
⸻
Fibonacci Logic
Measured from major swing low → all-time high
• 0.5 & 0.62 → failed supports
• 0.705 – 0.79 → institutional rebalance zone
Textbook location for trend continuation buys
⸻
Trade Idea (Swing Long)
Buy on confirmation inside demand
• Entry: 86,000 – 90,000
• Stop Loss: Below demand (~82,000)
• Targets:
• TP1: 93,000 (EMA 50)
• TP2: 101,800 (EMA 200 / mid-range)
• Final TP: 121,000+ (marked target point / liquidity above highs)
RR potential: 1:4 to 1:6 (swing setup)
⸻
Confirmation Signals (Very Important on BTC)
Wait for at least one:
• Daily or 4H bullish engulfing
• Strong rejection wick from demand
• 4H CHoCH after sweep of lows
• Compression → expansion behavior
⸻
Invalidation
• Daily close below ~82,000
• Acceptance below demand with strong volume
If that happens → bullish swing idea is invalid, and market likely seeks lower HTF liquidity.
⸻ Mr SMC Trading point
Summary
This is a high-timeframe accumulation & continuation setup:
• Deep discount
• Fib OTE + demand
• EMA mean reversion
BTC rewards patience and HTF discipline — confirmation > prediction.
If you want, I can:
• Break this into a 4H / 1H execution plan
• Help you build a BTC-specific SMC swing model
• Or map bearish alternative scenarios for risk control
Please support boost this analysis

BTC Bitcoin Technical Analysis and Trade IdeaBTC Bitcoin is showing early signs of weakness ⚠️. On the weekly and daily charts, we can see that after a short rally, momentum is fading. Zooming into the 4-hour chart, a bearish head and shoulders pattern has formed, signaling potential downside.
On the 1-hour chart, looking at the volume profile, price has broken below the point of control 🔻. I’m watching for a Sell opportunity if price stays under this level and drops again, possibly after a small pullback. If price breaks back above, I’d step away from this idea 🚫.

BTC bull market is not over, how should we plan for the future?#BTCUSD BINANCE:BTCUSDT BITSTAMP:BTCUSD BITSTAMP:BTCUSD
The BTC market did not experience much volatility over the weekend, and today it only rose to near the 90500 resistance level before falling back again. Judging from the hourly and 4H charts, BTC still has room for a pullback and adjustment, and may need to consolidate again before breaking through the upper resistance. Short-term support is at 87800-87000. If it falls back to this level, we can consider taking a small long position in BTC. The key support level remains at 85500-85000. As long as this range holds, the bullish trend for BTC remains intact

BITCOIN SIGNAL: HERE IS WHERE THEY CAN TAKE OVER!!! (Don’t miss)Yello Paradisers! Enjoy the video!
And Paradisers! Keep in mind to trade only with a proper professional trading strategy. Wait for confirmations. Play with tactics. This is the only way you can be long-term profitable.
Remember, don’t trade without confirmations. Wait for them before creating a trade. Be disciplined, patient, and emotionally controlled. Only trade the highest probability setups with the greatest risk to reward ratio. This will ensure that you become a long-term profitable professional trader.
Don't be a gambler. Don't try to get rich quick. Make sure that your trading is professionally based on proper strategies and trade tactics.

Bitcoin: Inverse Head & Shoulders Forming Above Key DemandHi!
Bitcoin is currently trading within a broader range after a corrective phase on the 4H timeframe. Price recently reacted from a well-defined demand zone around the 84,000–85,000 area, where strong buying interest was previously observed. From this zone, a clear inverse head and shoulders structure has developed, with the head aligned at the demand area and the right shoulder forming at higher lows, indicating an improving bullish structure.
Price is now approaching the neckline area near 90,000–90,500, which aligns with a short-term supply zone. Acceptance above this level would confirm the pattern and open the path toward the upper resistance zone around 92,000. This area represents the next key liquidity pool and a logical upside target. Failure to hold above the neckline would likely result in further consolidation within the range rather than immediate continuation. Overall structure remains constructive as long as price holds above the demand zone.

Bitcoin BTC price analysisCRYPTOCAP:BTC is struggling to move higher.
Walls of limit orders are everywhere — sellers vs buyers — and OKX:BTCUSDT is basically stuck.
That’s exactly how consolidation & distribution phases look like.
🖐️ Trading manually right now?
Honestly — not the best idea. At this stage, mistakes often outnumber profits.
🤖 Meanwhile, trading bots keep doing their job:
• predefined ranges
• zero emotions
• steady volatility harvesting
👀 Retail traders (us) should wait.
When the “big money” finishes its battle and fires an impulse candle — that’s when we join the stronger side.
📊 Fear & Greed Index is slowly recovering:
from 10–11 last week → ~25 today.
🔑 Key CRYPTOCAP:BTC levels:
▪️ Resistance: $103K
▪️ Support: $84K
⚠️ Below $77K — the road toward $50K opens wide.
🎄 With holidays ahead, activity will likely drop even more.
For now — we observe, not trade.
🤔 What do you expect next for #Bitcoin: breakout or another leg down?
______________
◆ Follow us ❤️ for daily crypto insights & updates!
🚀 Don’t miss out on important market moves
🧠 DYOR | This is not financial advice, just thinking out loud

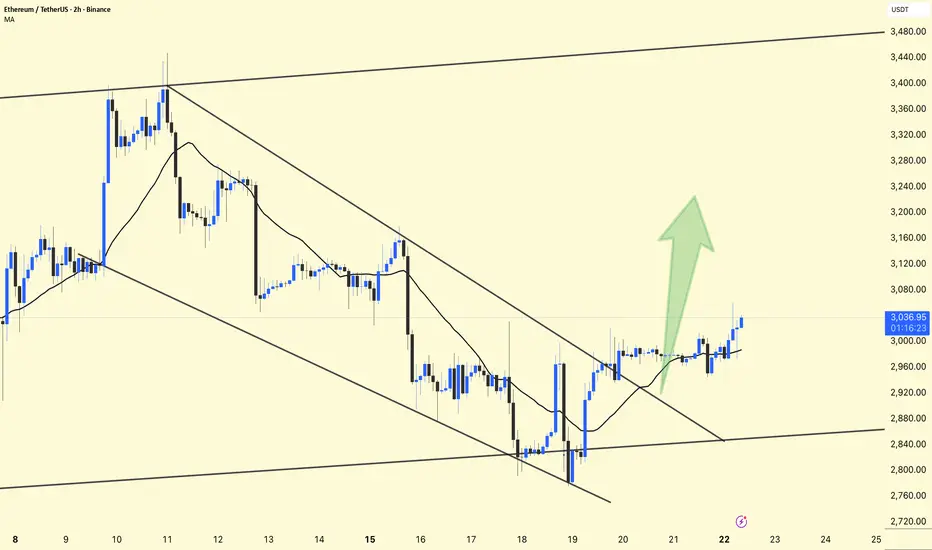
ETHUSDT – Chart Update ETHUSDT – Chart Update
ETH was moving inside a descending channel, now showing signs of reversal.
Price has broken the channel trendline and is holding above the short-term MA.
Momentum is slowly shifting bullish.
Support: 2,980 – 2,950
Major Support: 2,880
Resistance / Targets: 3,120 → 3,200 → 3,280
Bullish above 2,980 with confirmation.
⚠️ A pullback retest is healthy; avoid chasing.
Not financial advice. Trade with risk management.
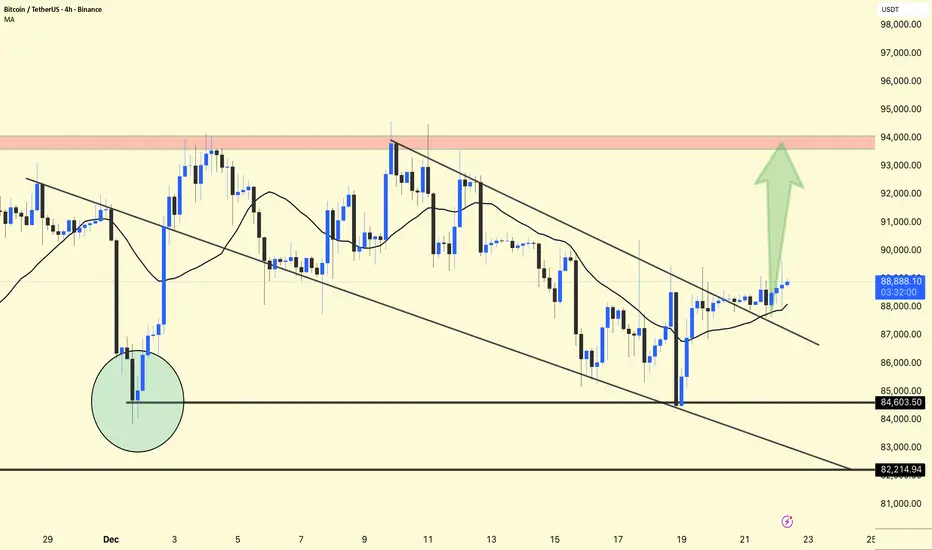
BTCUSDT –Chart Update (4H)BTCUSDT –Chart Update (4H)
Price is still inside a descending channel, but momentum is improving.
BTC is holding above 88,000 and forming higher lows.
A clean break & close above the channel can trigger upside continuation.
Support: 88,000 – 87,500
Major Support: 84,600
Resistance / Target: 93,500 – 94,000 zone
Cautiously bullish above 88K.
⚠️ Wait for confirmation; volatility remains high.
Not financial advice. Manage risk.
BTCUSDT – Intraday Long Setup After Capitulation MoveBTC shows signs of seller exhaustion after a sharp sell-off and high-volume capitulation. Price reacted strongly from the demand zone, suggesting absorption by buyers and a potential mean-reversion move.
Structure: Short-term breakdown with failure to continue lower → local bottom forming
Volume: Capitulation volume followed by reduced selling pressure
Momentum: RSI recovering from oversold, bullish curl developing
Trade Idea:
Bias: Long
Entry: Demand zone / bullish confirmation
SL: Below recent low
TP: Upper liquidity / resistance zone
RR: ~1:3
As long as demand holds, upside continuation toward higher liquidity is favored.
⚠️ Not financial advice.

Bitcoin Market Outlook (BUY BITCOIN 21 DECEMBER 2025)Bitcoin continues to show strong bullish intent as price holds above key higher-timeframe support and maintains a clear structure of higher highs and higher lows. Recent consolidation appears to be healthy, suggesting accumulation rather than distribution, with sellers failing to push price below critical demand zones.
As long as BTC remains above support, the bias stays firmly bullish. A sustained hold and expansion from this range increases the probability of continuation toward the next liquidity pool and previous highs. Momentum favors the upside, and any shallow pullbacks into support are viewed as potential opportunities for continuation rather than signs of weakness.
Invalidation is clear: a decisive break and close below major support would weaken the bullish case and shift focus toward deeper retracements. Until then, the trend remains intact, and Bitcoin looks positioned for another leg higher.

BTCUSDT – Long Bias (Coming Week)Bitcoin is currently trading within a discounted range following a corrective move, with price reacting around prior demand zones. I’m looking for long opportunities from the lower buy areas highlighted, where liquidity has been taken and market structure suggests a potential reversal.
The expectation is for price to form a base and expand higher into the mid-range, with an initial move toward the sell zone and possible continuation into the upper liquidity and take-profit area.
Trade Plan
• Bias: Long
• Entry Zone: Lower buy zones as marked
• Stop Loss 1: 84,500
• Stop Loss 2: H4 swing low
• Targets: Mid-range sell zone, then higher resistance / liquidity area
Execution is preferred with lower-timeframe confirmation. A clean break and close below the H4 low would invalidate the long idea.


BTCUSDT (4H) —Chart Update BTCUSDT (4H) —Chart Update
The price is still moving within a descending channel. The recent bounce came from the lower support zone (~84.6K).
Current Price: ~$ 88,100, trading below the upper trendline; the trendline is acting as resistance.
Support: 87.0K – 86.5K, main 84.6K
Resistance / Breakout Zone: 88.8K – 89.5K
Main Supply: 93.5K – 94.0K
Bullish Scenario:
A clear 4H close above the upper trendline + 89K could open up a move towards 91K → 93–94K.
Bearish Scenario:
Rejection from the trendline could lead to a pullback towards 86.5K, and if broken → a further move down to 84.6K is possible.

BTCUSDT (4H) — Chart UpdateBTCUSDT (4H) — Chart Update
Price is still inside a descending channel, but momentum is improving.
Support: 84.5K (strong reaction zone, buyers defended well)
Current: ~88.2K, testing the upper trendline
Break & hold above trendline: Opens path toward 92K – 94K (major supply zone)
Rejection from trendline: Pullback possible toward 86K → 84.5K again
This is a decision zone. Confirmation is needed — don’t front-run.
Trade with confirmation & proper risk management.

BITCOIN SIGNAL: ARE YOU SHORTING NOW LIKE EVERYONE ELSE?? (oops)Yello Paradisers! Enjoy the video!
And Paradisers! Keep in mind to trade only with a proper professional trading strategy. Wait for confirmations. Play with tactics. This is the only way you can be long-term profitable.
Remember, don’t trade without confirmations. Wait for them before creating a trade. Be disciplined, patient, and emotionally controlled. Only trade the highest probability setups with the greatest risk to reward ratio. This will ensure that you become a long-term profitable professional trader.
Don't be a gambler. Don't try to get rich quick. Make sure that your trading is professionally based on proper strategies and trade tactics.

Bitcoin Investors Rotate, But Don’t Rebuild, Price Momentum StalBitcoin is trading near $87,108 at the time of writing, holding above the $86,361 support level. While this zone provides near-term stability, recovery remains fragile. BTC must reclaim higher levels before signaling a meaningful trend reversal.
Short-term holders continue to pose a risk to upside progress. If they begin taking profits, Bitcoin could remain range-bound below $88,210. A failure to maintain this structure could result in another test of $84,698, a level already visited during recent volatility.
A stronger recovery requires Bitcoin to breach $88,210 convincingly. A push toward $90,401 would signal improving momentum. Achieving this move depends on renewed investor support, which may emerge as value-oriented buyers respond to current price discounts.

BTC/USD – Potential Downtrend Continuation Toward Key Support"1. Descending Channel (Blue)
Price has been moving inside a downward sloping channel — lower highs and lower lows. This is a bearish pattern until broken convincingly.
Traders watch for price to stay inside or break out — a breakout above suggests potential trend reversal; a break below suggests continuation.
👉 The price recently bounced off the lower boundary, showing support at that channel floor.
---
🔴 2. Moving Average (Red Curve)
A moving average (likely something like a 200-period) is plotted. When price is below the moving average, it typically indicates bearish momentum; price above suggests bullish momentum.
Here we see price approaching that red line from below → this often acts as dynamic resistance for bulls.
---
🔵 3. Key Horizontal Support (Blue Line at ~85,170)
A strong horizontal “target point” / support level is marked.
This line represents a zone where buyers previously stepped in and could again if price falls.
The chart clearly marks this as target on downside if the current setup fails.
Support & resistance levels like this are some of the most watched areas on price charts — they act as floors and ceilings for price action.
---
🎯 The Trade Setup Illustrated
On the right side you see a green/red box which visually represents a trade idea:
🟢 Entry Area
The current price (~88,100–88,800) looks like the potential entry.
The green zone down below is the profit target zone.
🔴 Red Zone
This is the stop-loss area — meaning if price rises above ~90,000–90,400, the bearish setup would be invalidated.
📉 Directional Arrow Down
The big arrow pointing down suggests the analyst expects a move lower, from current levels toward the support around ~85,000+.
So the idea is:
If price fails at the descending resistance and moving average → enter short.
Stop above resistance / above high of red.
Target the lower support area.
This is classic channel-based trading logic: resistance to support → short trade.
---
🔎 Bull vs Bear Scenarios
🔻 Bearish Scenario (favored by this chart)
✔ Price confirms resistance at moving average / upper channel
✔ Breaks back down
✔ Moves toward target zone (~85,000)
This would follow the pattern of lower highs and lower lows.
📈 Bullish Break Scenario
If price breaks above the red moving average and upper trendline convincingly with volume, that would: ✔ Break the downtrend ✔ Signal potential for upside ✔ Invalidate the short setup
Volume confirmation for breakouts is crucial — without it, breakouts often fail.
---
🧠 Summary in Plain Terms
Trend: Currently still bearish inside a descending pattern.
Resistance: Moving average + upper channel line blocking upside.
Support: Strong horizontal area around mid-$80k’s.
Trade idea on chart: Short toward support, stop above recent highs.
Key levels drawn:
🚫 Stop zone: ~90,000+
🎯 Target zone: ~85,000ish

BTC/USDT – 4H Chart Update. BTC/USDT – 4H Chart Update.
Price swept liquidity near 84.5K and bounced → classic fake breakdown.
Still moving inside a descending channel.
84.5K = key support (holding keeps bounce valid).
82.2K = invalidation level if support fails.
Resistance: 88K → 92K–94K supply zone.
Neutral to slightly bullish as long as 84.5K holds.
Reclaim above 88K = upside continuation possible.
Below 84.5K = increased risk of a deeper pullback.
Not financial advice. Manage risk.

Local Bear Flag on BTC ( 78000$-80000$ )After a strong impulsive drop, price has formed a local bear flag — an ascending corrective channel within a broader bearish move. Price action inside the channel looks corrective, with no clear signs of strong demand.
I expect a breakdown from the flag to the downside and continuation of the bearish move in the short term.
Downside target:
$78,000 – $80,000
As long as price remains below the upper boundary of the flag and fails to break out to the upside, the bear flag scenario remains valid.

BTC — Range Deviation Play & Bear Flag TargetBitcoin continues to trade inside a clearly defined sideways range. Recently, the price made a deviation above the range high — a classic false breakout — and quickly returned back inside the channel, confirming the upper boundary as strong resistance.
Now, on the daily timeframe , the market is forming a bear flag , which typically acts as a continuation pattern to the downside. If this structure breaks lower, it opens the way toward the $68–67K zone , which aligns perfectly with the lower boundary of the range.
A move into this area would likely create a deviation below the range low, mirroring the earlier deviation at the top. Such symmetrical deviations often signal liquidity grabs before a potential mid-term reversal.
Key Points:
Range structure remains intact
Upper deviation confirmed — failed breakout
Daily bear flag suggests continuation lower
Target: $68–67K (potential lower deviation zone)
This scenario remains valid as long as BTC stays below the mid-range and the bear flag structure holds.

BitcoinBTCUSD
- Completed " 1234 " Impulsive Waves
- Buy Side Liquidity
- Bearish Channel as an corrective pattern in Short Time Frame
- RSI - Divergence
- Order Block

BITCOIN SIGNAL: HERE ARE THE NEXT BTC TARGETS!!!! (trap) Yello Paradisers! Enjoy the video!
And Paradisers! Keep in mind to trade only with a proper professional trading strategy. Wait for confirmations. Play with tactics. This is the only way you can be long-term profitable.
Remember, don’t trade without confirmations. Wait for them before creating a trade. Be disciplined, patient, and emotionally controlled. Only trade the highest probability setups with the greatest risk to reward ratio. This will ensure that you become a long-term profitable professional trader.
Don't be a gambler. Don't try to get rich quick. Make sure that your trading is professionally based on proper strategies and trade tactics.
