BTC 4H CHART ROUTE MAPDear Traders,
Please review the BTC 4H chart technical analysis below.
We previously shared our price action analysis, and it remains valid. However, BTC has been moving sideways on the 4H timeframe for nearly three weeks. Recently, price broke the lower trendline, suggesting a potential retest higher—first toward the FVG around 88k, and possibly a further retest at the BPR zone near 91k.
Scenario 1:
If price is rejected from the FVG or BPR levels and the trend line, this would confirm a pullback toward the order block (OB) and demand zone around 83k–84k, clearly marked with a downside arrow.
If this demand zone 83k is broken, price could continue lower toward the next key demand level around 81k and potentially sweep liquidity at 78k.
Scenario 2:
If price successfully breaks above the FVG and BPR levels and trend line, it would confirm a move back into the trendline and zone area, supporting further bullish continuation to collect liquidity around 99k & potentially at 107k zone.
As always, it’s best to buy from dip levels and sell from higher levels. Avoid chasing price at the top, and trade with proper risk management. Our level-based structure typically provides 40–50 pips of reaction, offering solid opportunities for clean entries and exits.
With December 2025 underway and the holiday season approaching, market conditions remain uncertain. There are several red-flag news events on the calendar, so it’s important to keep positions light and tight and avoid choppy market conditions.
Please like, comment, and boost the post.
The Quantum Trading Mastery
Btctrade

Elite | BTCUSD | 1D – Macro Accumulation & Trend Holding PhaseBITSTAMP:BTCUSD
The previous impulsive leg confirms strong institutional participation. The current decline is corrective, not impulsive, with price respecting the daily trendline and holding above major demand. Prolonged consolidation at this level suggests energy building for a larger expansion move, as volatility compression typically precedes directional continuation in macro trends.
Key Scenarios
✅ Bullish Case 🚀
If BTC holds above the daily holding area and reclaims the correction zone:
🎯 Target 1: 95,000
🎯 Target 2: 105,000
🎯 Target 3: 118,000 – 120,000 (ATH liquidity zone)
❌ Bearish Case 📉
If price decisively breaks and closes below daily trend support:
🎯 Downside Target 1: 78,000
🎯 Downside Target 2: 72,000 (major HTF demand)
Current Levels to Watch
Resistance 🔴: 95,000 – 100,000
Support 🟢: 82,000 – 78,000
⚠️ Disclaimer: This analysis is for educational purposes only. Not financial advice.

Bitcoin BTC price analysis📊 US macro data has been updated — and CRYPTOCAP:BTC reacted with a bounce to the upside.
Altcoins, meanwhile, still look confused, as if they don’t know where to run yet 🤷♂️
😨 Fear & Greed Index: 11.
That’s extreme fear — and historically, such levels often mark zones where a gradual recovery can begin. Possibly even starting tomorrow.
📈 Overall, the OKX:BTCUSDT price action in 2025 looks very similar to #Bitcoin ’s behavior in 2021–2022.
We really want to believe we’re already in “Phase 2” of this fractal.
Because if this is still “Phase 1”, history suggests a scenario like:
➡️ first $103,000 BTC,
➡️ then potentially a deeper move toward $53,000.
🤔 What do you think — are we already transitioning into recovery, or is another painful leg still ahead?
______________
◆ Follow us ❤️ for daily crypto insights & updates!
🚀 Don’t miss out on important market moves
🧠 DYOR | This is not financial advice, just thinking out loud

BTC Bearish continuation incomingPrice rejected hard at the descending trendline, now consolidating below 88k key level. Expect breakdown to 77k target, then full retest of 76k lows.
Bulls calling for 100k+ are ignoring the macro downtrend – this is distribution, not accumulation.
Short bias until proven otherwise. Risk management first."
Controversial Title:
"Bears Still Own Bitcoin – 100k Moonboys Are Delusional"
Post this exactly like that. It’ll trigger the perma-bulls, get engagement, and separate real traders from hopium addicts. No mercy – if your setup is wrong, the market will punish you anyway. Grind smart.

BTC Market OutlookWatch for short-term support around 87k, near the lower edge of the parallel channel.
Another crucial support level is around 85.2k. If this level is broken, a break below 80k is imminent!

BTC at a Critical Weekly Level: Watching for a Bullish ReactionBTC Bitcoin has seen a fairly aggressive bearish pullback, but when we zoom out to the weekly time frame, price has now retraced directly into a weekly bullish order block 🧱📊. This area represents a key support zone that I’m watching closely.
📈 If this level holds and we start to see bullish price action, it could open up a strong opportunity as we drop down into the lower time frames. From there, I’ll be focusing on the 1-hour chart, watching market structure and price behavior to see if conditions line up for a potential entry.
⏳ As always, patience is key — I’ll only get involved if price does exactly what I’ve outlined in the video.
⚠️ Not financial advice — this is simply my market analysis.

BTCUSDT: Range Structure & Reversal RiskHI!
Bitcoin is currently trading inside a well-defined range, where price action has formed a Head and Shoulders structure within the upper half of the range. The left shoulder, head, and right shoulder are clearly developed, signaling weakening upside momentum after repeated failures near range highs.
Price is now hovering near the range midline/neckline zone. A confirmed breakdown below this level would activate the pattern, opening the door for a move toward the 85,600–86,200 demand zone, which aligns with prior strong accumulation.
As long as the price remains below the right-shoulder high, bearish pressure dominates. However, a strong reclaim back above the head would invalidate the pattern and keep the price rotational within the range.

BTC 4H Chart Route MapDear Traders,
BTC has shown strong gains this week and has confirmed a short-term bullish trend across multiple confluences.
Wait for the price to pull back to the entry zone around IFVG & BPR area close to $89K–$91K before looking for TP1, TP2, and TP3, with your stop-loss set at $83,500.
Always trade with proper risk and money management.
The Quantum Trading Mastery

BTC/ISD) Beraish trend analysis Read The captionSMC Trading point update
Technical of analysis depicts a bearish descending channel*
on the BTC/USDT 4-hour chart with the following key elements:
1. Channel structure Price is moving within a clear descending channel (black parallel lines), indicating a sustained downtrend.
2. Breakout point: The black dot marks a recent break below the lower channel line, signaling potential continuation of the bearish momentum.
Mr SMC Trading point
3. Target: The projected downside target is ≈80,428.17 USDT, shown by the horizontal “target point” line.
4. EMA (200): The blue exponential moving average (200-period) is acting as dynamic resistance, reinforcing the bearish bias.
5. Price action: The latest candle closes at 89,037.66 USDT down -0.36% for the session, with reduced volume (-1.33% Vol).
The overall idea is that after the breakdown from the channel, the analyst expects BTC/USDT to head toward the 80.4k support zone.
Please support boost this analysis

BTCUSD – Range-Bound Distribution | Liquidity-Driven Enviro🔍 Market Structure:-
HTF Range High / Sell-Side Resting Above:
94,500 – 95,200
HTF Range Low / Buy-Side Resting Below:
84,500 – 85,000
Mid-Range (Equilibrium):
~89,500 – 90,000 (current price area)
Price is currently hovering around equilibrium, which is typically low-probability for directional bias.
⚠️ Risk Disclaimer (TradingView-Friendly)
This analysis is for educational purposes only and does not constitute financial advice.
Market behavior is probabilistic and subject to change at any time.
Always apply proper risk management and use your own confirmation before executing trades.

BTCUSDT (4H) chart update !!BTC is holding above the rising trendline and trying to stabilize.
The 88,000–89,000 zone is acting as strong support, where previous bounces occurred.
As long as this support holds, upside targets remain 94,000 → 98,000 → 102,000.
A 4H close below 89K could open room for a pullback toward 85K–84K.
The overall structure remains bullish consolidation. 🚀
DYOR | NFA

BITCOIN SIGNAL: ARE BEARS PREPARING TO CRASH BTC??????!!!Yello Paradisers! Enjoy the video!
And Paradisers! Keep in mind to trade only with a proper professional trading strategy. Wait for confirmations. Play with tactics. This is the only way you can be long-term profitable.
Remember, don’t trade without confirmations. Wait for them before creating a trade. Be disciplined, patient, and emotionally controlled. Only trade the highest probability setups with the greatest risk to reward ratio. This will ensure that you become a long-term profitable professional trader.
Don't be a gambler. Don't try to get rich quick. Make sure that your trading is professionally based on proper strategies and trade tactics.

BTC DAY TRADING SETUP📌 Trade Setup:
* Entry Levels: 90,456 / 90,300
* Stop Loss: 89,121
* Target: 91,936
BTC is showing bullish momentum from the current support zone. Buyers are defending key levels, and if momentum continues, price may move toward the target. The bullish setup remains valid as long as BTC stays above the stop-loss.
Disclaimer: This is not financial advice; it reflects only my personal market analysis. Please do your own research before trading.

BTC Trade Plan (December 12, 2025)BTC Trade Plan (December 12, 2025)
(D1 Neutral / H4 Buy dips / H1 Locally bullish / M15 Trend)
⬛️ 1. Higher Timeframe Context (D1 and H4)
• D1 bias: neutral
• D1 range (approx): 89,000 – 94,000
• Key D1 zones:
• Supply: 93,000-94,000 tested highs
• Demand: 89,000-91,000 supports
• H4 bias: buy dips
• H4 zones of interest:
• H4 Sell Zone 1: – supply cluster/rejection
• H4 Buy Zone 1: – demand area/gap fill potential
Active setups are trend-aligned relative to D1/H4.
⬛️ 2. Preferred Setups by Horizon
🔳 2.1 Swing Setup (D1/H4)
• Idea: trend-aligned long on dips (neutral structure support).
• Time horizon: multi-day.
• Context: stable macro, neutral derivatives.
🔲 2.2 Intraday Setup (H1 focus)
• Idea: buy dips toward supports.
• Time horizon: intraday.
• Context: H4 demand zones, local bullish.
▫️ 2.3 Scalp Setup (M15 focus)
• Idea: scalp minor trends upside.
• Time horizon: minutes–hours.
• Risk: higher-risk in expansion regime.
▪️ 2.4 Arbitrage/Pairs Concept (if relevant)
• Idea: BTC dominance high, neutral vs ETH/sector.
🟩 3.1 Long Setup (Trend-Aligned)
• Execution timeframe: H1
• Trigger timeframe: M15
• Entry zone:
• Context: H4 demand, LVN support.
• Pattern tags:
Trigger conditions:
• Liquidity sweep or SFP at/under key low, then reclaim (liquidity_sweep_reclaim).
• Evidence of liquidation_spike_reversal and absorption_at_level.
• ML-Predictive (15m): upside probability ≥ downside.
• On-chain and regulatory risk not at “extreme”.
🟥 3.2 Short Setup (Counter-Trend)
• Execution timeframe: H1
• Trigger timeframe: M15
• Entry zone:
• Context: H4 supply + put-biased skew.
• Pattern tags (from pattern_library):
Trigger conditions (non-exhaustive example):
• Price trades into the H4 sell zone and forms required pattern combination (e.g., double_sweep_high + vwap_rejection).
• Orderflow: evidence of absorption_at_level and delta_divergence_high.
• ML-Predictive (15m): downside probability ≥ upside.
• Event/Regulatory risk is not “extreme” and uncertainty is not “high”.
🔴 4. Stops (Invalidation Levels)
Long setups:
• Stop: 88,000.
• Logic: break of H4/H1 key low/demand invalidation; idea is wrong below this level.
Short setups:
• Stop: 95,000.
• Logic: break of H4/H1 structural high or OB invalidation; idea is wrong above this level.
🟢 5. Targets
Long:
• TP1: 93,000 – local HVN/VWAP or M15/H1 level.
• TP2: 94,000 – H4 supply/OB retest.
• TP3 (optional): 95,000 – extended D1 objective (HVN).
Short:
• TP1: 91,000 – intraday HVN or VWAP retest (H1).
• TP2: 89,000 – H4 demand / LVN void.
• TP3 (optional): lower – extended D1 objective (gap fill).
⬛️ 6. Position Sizing
• Baseline risk:
• Trend-aligned setups: typically 1.0 (relative unit).
• Counter-trend setups: ≤ 0.5 (relative unit).
• Adjust up/down using:
• high volatility_context, normal onchain_risk_profile.risk_level, normal sentiment_state.sentiment_risk, normal anomaly_state.manipulation_risk, overall_event_risk normal, uncertainty.level medium, trade_readiness.status ok_to_trade.
Final recommended relative risk per setup: 0.8 for trend long, 0.4 for counter-trend short.
⬛️ 7. Risk Flags
• Thin liquidity and high slippage risk
• Macro headwinds (DXY flat, NQ flat)
• Elevated regulatory risk (bank competition news)
⬛️ 8. Flip Conditions
• For long bias → bearish flip:
• Close below 89,000 with sell delta, failed demand.
• For short bias → bullish flip:
• H4 close above 94,000 with rising OI, positive delta, and acceptance above the OB cluster.
⬛️ 9. Alternative Scenario
Reject highs with range_high_rejection, short direction entry 93,000-94,000, stop 95,000, targets 89,000-88,000, differs as bear continuation vs base range grind.
⬛️ 10. Model Self-Critique
• Main assumptions: stable macro, neutral derivatives/on-chain.
• Main vulnerabilities: regulatory shifts, large whale flows.
• Behavioural risk notes: do not average into losers, do not increase leverage beyond a safe threshold.
⬛️ 11. Uncertainty and Constraints
• Uncertainty level: medium.
• Avoid high leverage, require strict pattern confirmation before entry, limit the number of trades.

Bitcoin: Steps to GrowthIn recent days, Bitcoin has been shaping a picture of gradual ascent after a period of uncertainty. The movement consists of alternating short impulses and pauses, creating the impression of energy accumulation for further development.
The chart shows that the market is holding the price in the upper part of the range, while downward fluctuations lack sufficient strength to change the overall direction. This configuration indicates that buyers maintain the initiative, even if growth is unfolding step by step.
As a result, Bitcoin is showing signs of forming an upward wave, where further movement will depend on the market’s ability to consolidate above current levels and confirm the strength of the impulse.

BTC After the Flush: Building a Base Into 2026Bitcoin printed a clear correction from the 126,333 spot top into 80,625, a 36% retrace that finally reset an overheated trend. After that impulse down, price stopped bleeding and started building a base. That is the context for my long, not a breakout chase.
My first entry triggered at 85,000. If price sweeps lower, I will add, with my final planned entry sitting in the 72,000 to 70,000 region. The whole idea is simple: scale into higher time frame demand after a deep reset, then let the market do the work if it wants to rotate back into risk.
Technicals: on the daily, the selloff created an obvious “damage candle” sequence, followed by compression and range behavior. I am treating the 80K to 85K band as the core demand zone. The level that matters for confirmation is the recovery of the mid range resistance around 94,652, because a clean reclaim would shift the structure from “bounce” to “reversal attempt” and opens the door for a move back into the 100K area and, eventually, a retest of the prior ATH zone near 126K if momentum returns.
Fundamentals : the macro backdrop is supportive for risk if financial conditions keep easing. The Fed has already moved policy lower and continues to guide the market with forward projections, which is the type of environment that can reprice duration and high beta assets.  At the same time, institutional crypto flows have been rebuilding. CoinShares reported a rebound in digital asset ETP inflows with Bitcoin leading, and daily US spot Bitcoin ETF flow data has also shown positive net flows on recent sessions.  On derivatives, CME positioning and open interest remain a key dashboard for whether this base is being built with size behind it. 
Execution note: I am not trying to “be right” on the exact bottom. I am trying to be positioned where the risk is definable and the upside is asymmetric. If the narrative changes, I will adjust. If the market gives the move, I will pay myself and protect capital.
Note: Please remember to adjust this trade idea according to your individual trading conditions, including position size, broker-specific price variations, and any relevant external factors. Every trader’s situation is unique, so it’s crucial to tailor your approach to your own risk tolerance and market environment.

BITCOIN SIGNAL: FOMC MEETING WILL PUSH BTC TO HERE!!!? (warning)Yello Paradisers! Enjoy the video!
We are discussing a lot of technical stuff—Elliott Wave theory. We are going through multiple time frames, and I'm updating you about the price action, development structure, and important levels, as well as what the highest probability next move is.
And Paradisers! Keep in mind to trade only with a proper professional trading strategy. Wait for confirmations. Play with tactics. This is the only way you can be long-term profitable.
Remember, don’t trade without confirmations. Wait for them before creating a trade. Be disciplined, patient, and emotionally controlled. Only trade the highest probability setups with the greatest risk to reward ratio. This will ensure that you become a long-term profitable professional trader.
Don't be a gambler. Don't try to get rich quick. Make sure that your trading is professionally based on proper strategies and trade tactics.

btc live tradeHello friends
Given the sharp upward movement we had, you can see that the sellers have made a high, which increases the possibility of a price correction, and we can witness a price increase in the price correction until the specified targets are reached.
This analysis is purely from a technical perspective and is not a buy or sell recommendation, so please observe risk and capital management.
*Trade safely with us*

BTC Trade Plan (December 10, 2025)BTC Trade Plan (December 10, 2025)
(D1 Neutral / H4 Buy dips / H1 Locally bullish / M15 Trend)
⬛️ 1. Higher Timeframe Context (D1 and H4)
• D1 bias: neutral
• D1 range (approx): 90,000 – 94,000
• Key D1 zones:
• Supply: approx 94,000 rejection
• Demand: approx 90,000 support
• H4 bias: buy dips
• H4 zones of interest:
• H4 Sell Zone 1: – supply cluster
• H4 Buy Zone 1: – demand area
Active setups are trend-aligned relative to D1/H4.
⬛️ 2. Preferred Setups by Horizon
🔳 2.1 Swing Setup (D1/H4)
• Idea: trend-aligned long on dips.
• Time horizon: multi-day.
• Context: neutral structure with macro stability.
🔲 2.2 Intraday Setup (H1 focus)
• Idea: buy dips in range.
• Time horizon: intraday.
• Context: H4 demand zones.
▫️ 2.3 Scalp Setup (M15 focus)
• Idea: scalp upside moves.
• Time horizon: minutes–hours.
• Risk: higher-risk in event regime.
▪️ 2.4 Arbitrage/Pairs Concept (if relevant)
• Idea: none.
🟩 3.1 Long Setup (Trend-Aligned Example)
• Execution timeframe: H1
• Trigger timeframe: M15
• Entry zone:
• Context: H4 demand, possibly with absorption.
• Pattern tags:
Trigger conditions:
• Liquidity sweep or SFP at/under key low, then reclaim (liquidity_sweep_reclaim).
• Evidence of liquidation_spike_reversal and absorption_at_level.
• ML-Predictive (15m): upside probability ≥ downside.
• On-chain and regulatory risk not at “extreme”.
🟥 3.2 Short Setup (Counter-Trend Example)
• Execution timeframe: H1
• Trigger timeframe: M15
• Entry zone:
• Context: H4 supply + neutral bias.
• Pattern tags (from pattern_library):
Trigger conditions (non-exhaustive example):
• Price trades into the H4 sell zone and forms required pattern combination (e.g., double_sweep_high + vwap_rejection).
• Orderflow: evidence of absorption_at_level and delta_divergence_high.
• ML-Predictive (15m): downside probability ≥ upside.
• Event/Regulatory risk is not “extreme” and uncertainty is not “high”.
🔴 4. Stops (Invalidation Levels)
Long setups:
• Stop: approx 90,000.
• Logic: break of H4/H1 key low/demand invalidation; idea is wrong below this level.
Short setups:
• Stop: approx 95,000.
• Logic: break of H4/H1 structural high or OB invalidation; idea is wrong above this level.
🟢 5. Targets
Long:
• TP1: approx 93,000 – local HVN/VWAP or M15/H1 level.
• TP2: approx 94,000 – H4 supply/OB retest.
• TP3 (optional): higher – extended D1 objective.
Short:
• TP1: approx 92,000 – intraday HVN or VWAP retest (H1).
• TP2: approx 91,000 – H4 demand / LVN void.
• TP3 (optional): lower – extended D1 objective.
⬛️ 6. Position Sizing
• Baseline risk:
• Trend-aligned setups: typically 1.0 (relative unit).
• Counter-trend setups: ≤ 0.5 (relative unit).
• Adjust up/down using:
• high volatility, normal onchain risk, normal sentiment risk, normal manipulation risk, normal event risk, medium uncertainty.
Final recommended: 0.8 for trend long, 0.4 for counter-trend short.
⬛️ 7. Risk Flags
• Event risk high (Fed decision)
• Thin liquidity and high slippage risk
• Macro headwinds possible (DXY flat, NQ flat)
• Elevated regulatory risk (bank competition news)
⬛️ 8. Flip Conditions
• For long bias → bearish flip:
• Close below 91,000 with sell delta.
• For short bias → bullish flip:
• H4 close above 94,000 with buy delta.
⬛️ 9. Alternative Scenario
Failed range break down, trigger range_high_rejection, short direction entry approx 93,000-94,000, stop 95,000, targets 91,000-90,000, differs as bear continuation vs base range.
⬛️ 10. Model Self-Critique
• Main assumptions: stable macro, neutral derivatives, neutral on-chain.
• Main vulnerabilities: Fed surprise, large seller.
• Behavioural risk notes: do not average into losers.
⬛️ 11. Uncertainty and Constraints
• Uncertainty level: medium.
• Avoid high leverage, require strict pattern confirmation, limit trades.

“Bitcoin / U.S. Dollar” (BTC/USD) on the 4‑hour timeframe from B1. Price Movement: The candlestick pattern indicates an ascending trend channel (blue lines) with a recent breakout above the upper channel line (circled area), suggesting bullish momentum.
2. Target Point: A red horizontal line marks a target at 95,919.5, implying the expected upside if the bullish move continues.
3. Support Zone: A red shaded rectangle highlights a demand zone between 85,755.8 and 88,210.8, acting as a key support level.
4. Green Rectangle: Represents a potential profit zone extending from approximately 88,210.8 to the target 95,919.5, indicating an expected price surge.
5. Current Price: BTC/USD is trading around 92,089 (as of 02:50:26), sitting above the support and aiming for the target.
6. Analysis Implication: The setup suggests a bullish continuation after the breakout, with traders likely watching for sustained movement above the channel to confirm the upward run toward the target, while keeping an eye on the support zone for any reversal🚀📈

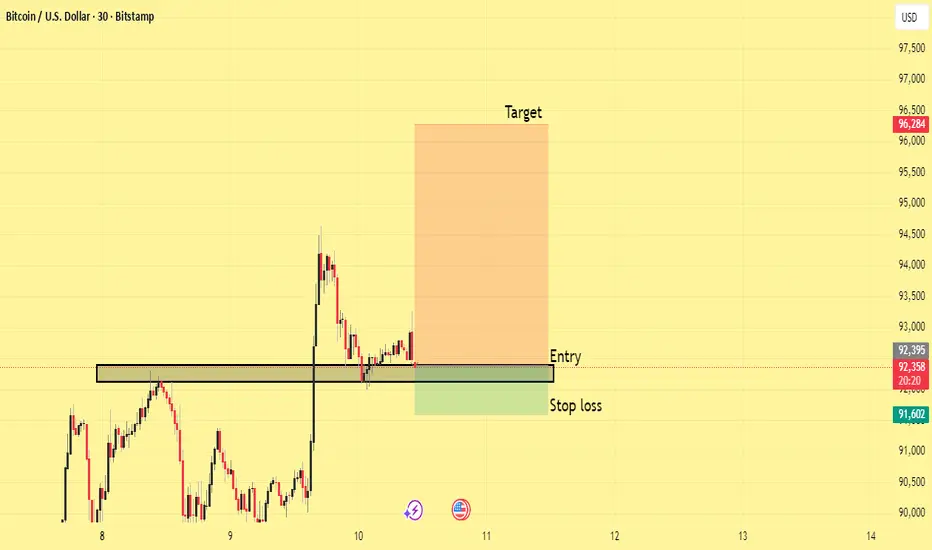
BTCUSD Long Setup: Demand Zone Retest with High R:R PotentialThis setup highlights a potential long opportunity on BTCUSD following a clean retest of a key demand zone. After a sharp impulse move upward, price pulled back into a previously established support block, confirming it as a valid re-accumulation area. The market respected this zone with multiple rejections, signaling buyer interest.
The entry is positioned directly on the retest of the demand zone, aligning with structure and maintaining a favorable risk-reward profile. The stop loss is placed safely below the zone to account for volatility and prevent premature invalidation. The target aims for a continuation toward the next liquidity pocket above, reflecting the expectation that buyers will reclaim control and push price higher.
This idea leverages market structure, zone retest, and momentum recovery to outline a disciplined, high-probability long setup
Selena | BTC/USD – Trend Channel + Strong Demand ReactionBITSTAMP:BTCUSD
Bitcoin is trading inside a rising parallel channel, with price recently reacting cleanly from the strong demand zone at 90,200–90,700, aligning with channel support. Liquidity was taken below the lows, signalling possible continuation to the upside.
🔼 Bullish Scenario
If BTC holds above 90,200, we may see upside continuation:
🎯 Target 1 → 94,200 – BSL zone
🎯 Target 2 → 96,800 – 97,900 top resistance zone
🎯 Target 3 (Breakout case) → 98,500+
A sweep of intra-day liquidity followed by bullish BOS can provide confirmation.
🔽 Bearish Risk / Invalidation
Break & close below 89,900 could open deeper flow into liquidity below:
⚠️ Downside levels → 88,000 → 86,500 → 81,000 support base
⚠️ This chart is for educational purposes only — not financial advice.

Bitcoin BTC Bullish Move Here's My Trade PlanBitcoin has now broken structure, and the price action is starting to look very similar to what we saw on US30 (my last video). 📉➡️📈 After that strong bullish run, BTC has pulled back, taken some liquidity, and broken through a key level, which is exactly what we want to see before the market sets up for its next move.
This kind of structure break often signals that the market is resetting — clearing out late buyers, rebalancing price, and making room for a cleaner continuation later. 😮💨🔄 Even though Bitcoin has been bullish overall, a structure break like this can actually strengthen the next leg up if the market respects the right levels.
What I want to see now is for Bitcoin to push back above the current weekly open, trade through it with conviction, and then come back to retest that level. ✔️ Once that happens, that retest becomes a high-interest zone for potential longs, because it shows the market is reclaiming support before continuing higher. 🚀💎
Until then, patience. Let the levels confirm the narrative.
Not financial advice.
