BTCUSDT Trade Plan (December 08, 2025)BTC Trade Plan (December 08, 2025)
(D1 Bearish / H4 Sell Rallies → Compression / H1 Neutral / M15 Chop)
⬛️ 1. Higher Timeframe Context (D1 and H4)
• D1 bias: bearish (descending channel post-ATH)
• D1 range (approx): 84,000 – 126,000 (current lower third)
• Key D1 zones:
• Supply: 100–105k (broken)
• Demand: 88–90k channel low
• H4 bias: sell rallies turning compression (ascending triangle forming)
• H4 zones of interest:
• H4 Sell Zone 1: – recent rejection + supply cluster
• H4 Buy Zone 1: – weekend low + trendline
Active setups counter-trend long on dip (whale accumulation support), trend-aligned short only on clear rejection.
⬛️ 2. Preferred Setups by Horizon
🔳 2.1 Swing Setup (D1/H4)
Counter-trend long the channel low / whale accumulation zone. Time horizon: multi-day to weeks.
🔲 2.2 Intraday Setup (H1 focus)
Buy dips to 89.5-90k or breakout above 92k. Time horizon: intraday to overnight.
▫️ 2.3 Scalp Setup (M15 focus)
Scalp range 90-92k or absorption plays — higher risk in chop.
▪️ 2.4 Arbitrage/Pairs: BTC dominance rising → BTC outperforming alts short-term.
🟩 3.1 Long Setup (Trend-Aligned with On-Chain / Swing-Intraday)
• Execution timeframe: H4/H1
• Trigger timeframe: M15
• Entry zone:
• Pattern tags: Trigger conditions:
• Successful defense 88-90k zone + CVD higher low
• H1/H4 BOS up on volume
• Whale accumulation continuation
🟥 3.2 Short Setup (Counter-Trend / Scalp Only)
• Execution timeframe: H1
• Trigger timeframe: M15
• Entry zone:
• Pattern tags: Trigger conditions:
• Clear rejection with delta divergence high
• Failure to break 94k pre-FOMC
🔴 4. Stops (Invalidation Levels)
Long setups: 87,500 (channel break = bear confirmation)
Short setups: 94,500 (breakout = squeeze)
🟢 5. Targets
Long (swing/intraday):
• TP1: 92,000 (VWAP/H1)
• TP2: 94,000-95,000 (supply test/H4)
• TP3: 100,000+ (HVN/D1 optional)
Short (scalp):
• TP1: 90,000
• TP2: 88,500
⬛️ 6. Position Sizing
• Baseline trend-aligned long (on-chain supported): 1.0%
• Counter-trend short: 0.4%
• Adjustments: +20% (whale buying + clean lev + Fed tailwind) → Effective: longs 1.2% risk, shorts 0.3% max
⬛️ 7. Risk Flags
• FOMC Wednesday → vol expansion risk
• Thin liquidity mid-week
• Residual weekend trauma → fake moves possible
• Macro correlation re-assertion if equities dump
⬛️ 8. Flip Conditions
Bull → bear flip: clean close below 88k with volume + funding negative
Bear → bull flip: H4 close >94.5k + CVD reset + whale continuation
⬛️ 9. Alternative Scenario
Reject hard at 92-94k → descending triangle breakdown → fast move to 84-87k LVN void (bear trap completion, high risk short only with tight stop).
⬛️ 10. Model Self-Critique
• Assumptions: whale accumulation continues, Fed delivers dovish cut, no macro shock
• Vulnerabilities: sudden risk-off equities dump, whale distribution resumption, FOMC hawkish surprise
• Behavioural: do not chase breakouts pre-FOMC, do not average into losing shorts against whales
⬛️ 11. Uncertainty and Constraints
Uncertainty: medium → require flow + pattern confirmation, no high lev, prefer size on confirmed absorption only.
Btctrade

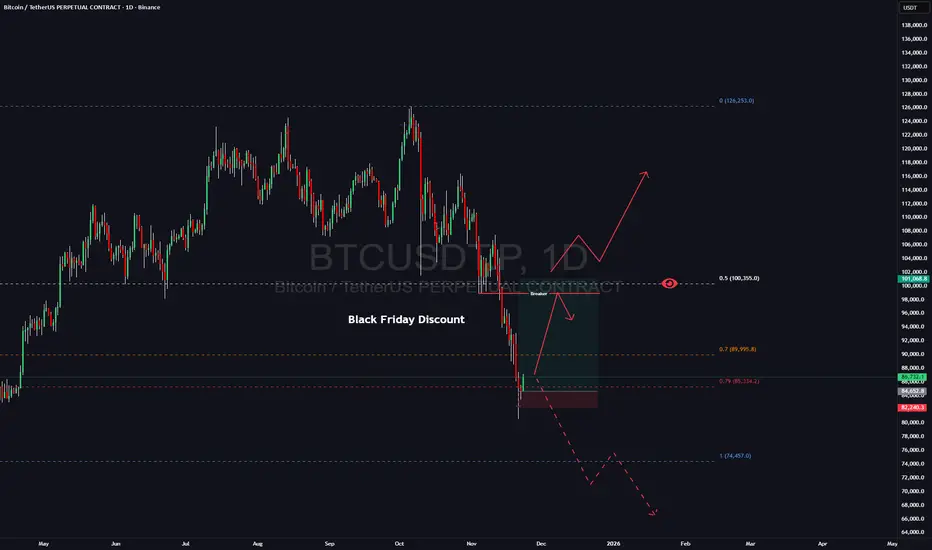
BTC Most Likely Scenario -- 98K -> 70KBTC Most Likely Scenario -- 98K -> 70K
Probability for BTC next move is to go to 98k-100k level. Then go take the liquidity between 70-74k. We probability will make a bullish divergence on that level. Will see then if we make a LH in upcoming months or another ATH.

“BTCUSD 1H — Range Support Buy Targeting Range High Liquidity1. Market Structure (1H BTCUSD)
Overall structure: Still range-bound / corrective, not a clean trend.
Price is trading inside a rising channel but momentum has weakened.
We recently rejected from the upper mid-range, not from the absolute highs — that matters.
Interpretation:
This is consolidation after a strong move, not distribution yet — but buyers are no longer aggressive.
---
2. Key Zones (Very Important)
🔴 Demand / Support Zone (Red Box)
Roughly 85,000 – 86,800
Multiple reactions here → high-quality demand
Liquidity + prior structure low + channel support
If price enters this zone and holds:
→ High-probability bounce / long setup
If this zone breaks cleanly (1H close below):
→ Structure fails → expect accelerated sell-off
---
⚫ Resistanc…
“BTCUSD 1H — Range Support Buy Targeting Range High Liquidity”

Bitcoin: Critical Levels Ahead, $106k or $65kHi guys!
The current BTC structure displays a textbook Three Drives Pattern, followed by visible momentum weakness. After the first, second, and third drives completed, price failed to create higher highs, confirming exhaustion. This aligns with the RSI divergence, which began forming during the second and third drives.
Price has now pulled back into a key decision zone. Two scenarios stand out:
Bullish Scenario
If BTC breaks and sustains above 94,393 USD, it would signal renewed strength. This could trigger a continuation toward the upper supply zone around 105,000–110,000 USD, where previous rejection occurred.
Bearish Scenario
Failure to break higher and instead falling below 82,000–83,000 USD opens the path toward deeper retracement. A breakdown confirms the distribution phase after the three drives, exposing the broader support area near 74,500 USD and potentially down to 65,445 USD, which aligns with historical demand.
Disclaimer: As part of ThinkMarkets’ Influencer Program, I am sponsored to share and publish their charts in my analysis.

BTC analysis 8 DecBTC – Bullish Outlook with Planned Laddered Entries
📌 Overall Trend
My higher-timeframe bias on Bitcoin remains bullish.
I expect the current pullback to create liquidity for continuation to the upside.
⸻
📥 Laddered Buy Zones
I am planning to accumulate in three key demand zones:
• $90,500
• $88,650
• $85,907
These levels align with previous reaction zones and liquidity pockets that could serve as bases for bullish continuation.
⸻
🔍 Entry Criteria (Very Important)
I will NOT enter blindly into these zones.
For each level, I will wait for:
✔ CHoCH (Change of Character)
✔ Break of Structure on the 15-minute timeframe
Only after a clear shift in market structure will I execute entries.
This filter significantly increases win-rate by avoiding ignored or weak zones.
⸻
🎯 Trade Plan Summary
• HTF trend: Bullish
• Looking for a corrective move into demand
• Entry only with 15m CHoCH + BOS confirmation
• No confirmation → no trade

BTC End-of-Week Pullback Potential Here's My Trade PlanBitcoin BTC has been bullish this week, pushing higher as momentum continues to favour the upside. 🚀📈 But as we approach the end of the week, we need to be cautious because BTC is now trading directly into a key resistance zone. This is normally where trends start to slow down, weaken, or even pull back. 😮💨
Just like with any strong move, a bullish trend doesn’t mean endless continuation. Institutions and major players often begin reducing exposure toward the end of the week, which can trigger retracements or consolidation. So the big question becomes: do you really want to chase longs right as BTC is hitting major resistance and the weekly trend is reaching potential exhaustion? ⚠️
Looking at the structure, Bitcoin has climbed into a level where we’ve seen previous selling and heavy order activity. This makes the current area a strong resistance zone, and personally, it’s not somewhere I’d want to be looking for new long positions.
If anything, heading into Thursday and Friday, we could see Bitcoin pull back from this resistance as buyers take profit and institutions rebalance their positions before the weekly close. 🕒🔄
Be patient, stay aware of the levels, and let price tell you the story.
Not financial advice.

Bitcoin (BTCUSDT) – Intraday Trend & Pattern AnalysisHi!
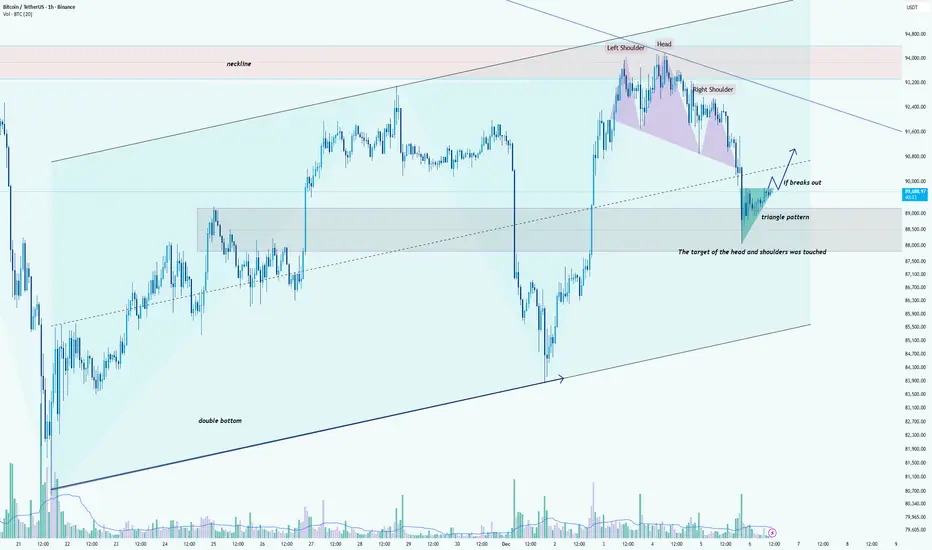
Bitcoin continues to trade within a broader ascending structure, supported by an established rising trendline that has guided price higher over the past weeks. After forming a double bottom near the lower boundary of this channel, BTC initiated a strong rally toward the major resistance zone around 95,000 USDT, where a clear head-and-shoulders reversal pattern appeared. The neckline later broke, and its measured target has already been fully achieved, confirming the pattern’s validity.
Following the completion of this decline, the price stabilized inside the previous consolidation zone and began forming a triangle pattern, signaling compression and potential trend continuation. BTC is now testing the upper boundary of this triangle. A confirmed breakout above the pattern could trigger a bullish continuation toward 90,500–91,200 USDT, aligning with the dashed trendline and short-term resistance levels.
Failure to break upward may lead to a retest of the triangle’s lower boundary or even the broader demand area around 88,000–88,500 USDT, which previously acted as a reaction zone.
Overall, as long as the price remains above the ascending channel’s main support, the medium-term structure favors buyers. A breakout from the triangle will be the key signal for renewed bullish momentum.
BTC/USD) Bearish trend analysis Read The captionSMC Trading point update
Technical analysis of Bitcoin (BTC/USDT), showing likely support/resistance zones + moving averages + a projected downside “target.” I think the analysis has merit — but it also carries risks. Here’s a breakdown of what works & what to watch out for:
---
What the analysis does well (strengths)
Use of support and resistance zones: The chart marks a “key support zone / breakout level” and a “resistance level.” That’s textbook technical analysis — horizontal zones where price has previously stalled or reversed tend to work as future decision points.
Dynamic resistance via moving averages: The chart uses EMAs (50 and 200) — those help traders spot trend direction and possible dynamic resistance/support. When price is below a major EMA (like the 200), that EMA often acts as resistance rather than support.
Clear target defined: Having a target around ~$83,783 (as drawn) gives a concrete downside level if the bearish case plays out. This is useful for planning scenarios and risk management.
Logical structure: support → breakdown → target: The idea seems to be that price broke a support zone (or tested and failed), is now below important moving averages — which supports the bearish bias. If support fails, move down toward target. That’s a valid “trend + structure” bearish setup.
---
What to be cautious about (weaknesses / risks / what’s uncertain)
Support/resistance zones are not guarantees: As described in guides for support/resistance — these zones work because many traders place orders there, but price can ignore them, especially under high volatility or news triggers.
EMAs as dynamic resistance/support are probabilistic: While 50-EMA or 200-EMA often act as resistance/support, they are not always respected — especially in volatile crypto markets.
Timeframe & context matter: The chart seems 1-hour, which means the zones and signals are relatively short-term. Levels that look robust on a 1-h chart may dissolve quickly when broader contexts (daily/weekly) shift. Many TA educators stress using multiple timeframes to confirm strong levels.
No certainty of target — market structure can change: The “target point” assumes continuation of bearish momentum. But if price action reverses, or some bullish catalyst emerges, the setup becomes invalid. This is true for any technical projection.
---
What this setup implies — possible scenarios
Bearish scenario (the chart’s base case): Since price is below both EMAs and has recently broken support, BTC could drift toward the projected target around $83,000–$84,000 if downward pressure continues, especially if sellers dominate near EMAs/resistance zones.
Invalidation / bull scenario: If BTC climbs back above the 50 and 200 EMAs, or reclaims a broken support zone, that bearish thesis fails — and price may instead bounce back toward higher resistance. In that case, the target becomes irrelevant.
Choppy / range-bound scenario: Price may hover between the support/resistance / EMA zones, bouncing up/down without reaching the target — which is common in crypto when there’s no strong directional catalyst.
Mr SMC Trading point
---
My view: Reasonable as a probabilistic bearish trade — but not a guarantee
Your chart offers a plausible bearish setup. It makes sense to watch how price interacts with the EMAs and the support/resistance zones. However: because markets are never deterministic, it’s best to treat this as one possible scenario, not a sure bet.
If I were trading this, I’d probably:
Wait for confirmation (e.g. a breakdown + close below support, or rejection at EMA) before committing.
Define risk controls: like where to set a stop-loss (maybe just above the 200-EMA or above recent consolidation), and a realistic profit target as indicated.
Monitor for catalysts (volume spikes, news) — these can up-end technical setups quickly in crypto.
---
Please support boost 🚀 this analysis

BTC Is Preparing Monster Move: My Bullish Roadmap to New High!A lot of people are already calling for the end of the BTC rally and welcoming a new bear market. Whether that’s true or not — the chart will show. I approach the market with a neutral mindset and let price action speak for itself.Plus dont forget we have Black Friday coming and probably crypto market decided to give you a nice discount)
From my perspective, Bitcoin has simply tapped the weekly discount zone. Historically, BTC often delivers a 20–30% corrective move, which is completely normal within a bullish cycle. And with Black Friday approaching, it seems the crypto market decided to offer its own “discount.”
I’ve taken a long position from this area, with my first target set at 94–96K, where I plan to secure the majority of my profits.
My stop is positioned around 82K — if the market goes against me, I’m fully comfortable with the risk.
I’ve also added some spot positions and will share detailed analysis on those in upcoming posts.
Once we reach the 94–96K zone, I’ll reassess the market. Price can shift in either direction from there, which is why that area is my main profit-taking zone while letting the remainder of the position run.
Follow me for further updates and trade breakdowns.
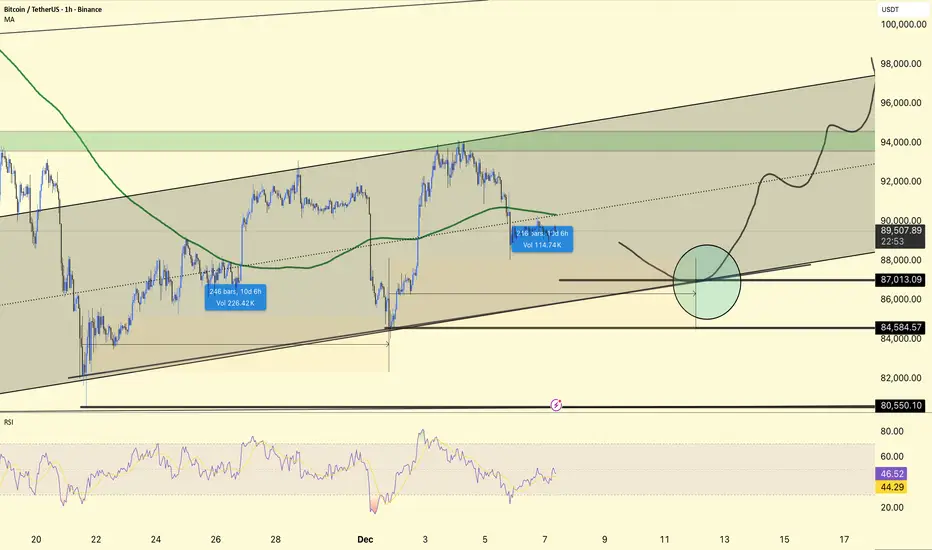
#BTC 4HOUR CHART UOPDATE !!BTCUSDT is still trading within an ascending channel, now pulling back towards the mid-lower portion of the structure after failing to sustain above 90k on the latest push.
The price has rolled over from the upper half of the channel and is heading towards the main confluence zone around 87,000–88,000, where the lower channel line, previous horizontal support, and your marked circle align.
84,584 and 80,550 remain the next downside reference supports; holding above 87k maintains the short-term bullish channel, while a break below 84,584 would increase the risk of a deeper correction towards 80k.
A decline into the 87k area, followed by basing and a continuation back towards 92k–94k, and if buyers defend the channel as drawn, possibly to the 96k–98k channel top.
The RSI is mid-range rather than overbought, so there is room for another leg down or a sharp bounce to test support; using 87k–84.5k as the main invalidation band for aggressive longs fits within the current 4H structure.
DYOR | NFA,
BITCOIN SIGNAL: THIS IS WHERE THE CRASH WILL STOP!!!? (watchout)Yello Paradisers! Enjoy the video!
We are discussing a lot of technical stuff—Elliott Wave theory. We are going through multiple time frames, and I'm updating you about the price action, development structure, and important levels, as well as what the highest probability next move is.
And Paradisers! Keep in mind to trade only with a proper professional trading strategy. Wait for confirmations. Play with tactics. This is the only way you can be long-term profitable.
Remember, don’t trade without confirmations. Wait for them before creating a trade. Be disciplined, patient, and emotionally controlled. Only trade the highest probability setups with the greatest risk to reward ratio. This will ensure that you become a long-term profitable professional trader.
Don't be a gambler. Don't try to get rich quick. Make sure that your trading is professionally based on proper strategies and trade tactics.

BTC Trade Set Up Dec 5 2025price has shifted to bearish structure creating LL/LH on the 1h, so i will want to see price break and close under SSL, fill the 4h FVG and continue to make bearish structure to continue lower to demand and SSL

Will Bitcoin Price Under $95,000 Benefit From $2 Billion BuyingBitcoin is trading at $92,047, holding above the critical $91,521 support level while remaining trapped under the month-long downtrend. Recovering from this position requires a decisive breakout, which has yet to materialize despite recent attempts.
Invalidating the downtrend demands a flip of $95,000 into support. Given the ongoing accumulation and tightening exchange supply, such a move remains possible. Additional support from institutional buyers would further strengthen Bitcoin’s path toward $100,000, restoring bullish momentum.
If large holders remain sidelined, Bitcoin may continue to struggle. A failure to sustain support could send BTC back below $89,800 and toward $86,822. This would reinforcing bearish sentiment and delaying recovery attempts.

BTC/USD (Bitcoin) LONG SET UPEntry Price 1: $89,500
Entry Price 2: $85,500
Stop Loss: $79,500
Take Profit 1: $94,500(Close 25%)
Take Profit 2: $99,500 (Close 50%)
Take Profit 3: $105,500 (Close 75%)
Take Profit 4: $110,500 (Close 100%)
Status: ACTIVE

BTC/USDTINDEX:BTCUSD
### Bitcoin / US Dollar — 2h Chart (INDEX)
- **Last Candle Data (approx.)**: Open ~**93,500.02**, current SELL pressure indicated.
- **Volume**: **794** (appears low on scale).
- **Key Price Levels (in USD)**:
- **Resistance Zone**: 99,000 – 97,000
- **Near-term Resistance**: 95,000 – 96,000
- **Current Trading Range**: ~93,000 – 92,300
- **Support Levels**: 91,000 → 90,000 → 87,000 → 85,000
- **Major Support Zone**: 83,000 – 79,000
**Summary**: Bitcoin is trading in the lower half of the displayed range, with immediate support near **92,300–91,000** and resistance around **95,000–96,000**. Volume is relatively low on this timeframe. Watch for a break above 96,000 for bullish momentum or a drop below 91,000 for further downside.
---
**Disclaimer**: This is technical observation, not financial advice. Cryptocurrency trading carries risk. Always do your own research.

BTC Short Running with 1:3RRBTC Short Running with 1:3RR
Loving this BTC Short so far. Actual target is around 74-75K.

BTC Trade Set Up Dec 4 2025Price remains bullish on but i am expecting a sweep of SSL and/or tap into 4h FVG before a continuation higher to supply and BSL

BTC: The rebound is not over yet, buy on pullbackDuring the early session, BTC surged to the 94,100 resistance area before encountering selling pressure. The price then retraced to the 92,600 support zone, where it stabilized. This was followed by a modest recovery, and the market is currently consolidating in a high-level compression range with a slight downward bias.
From a technical perspective, the BTC daily chart shows two consecutive bullish candles breaking above the mid-Bollinger band, after which the price has entered a slower consolidation phase. The current small doji indicates that upside momentum has moderated; however, the broader trend still remains within an upward channel.
Short-term pullbacks continue to serve as a re-accumulation phase ahead of the next potential directional move. On the 1-hour timeframe, BTC displays a classic V-shaped reversal structure. Combined with alternating buy-sell pressure on lower timeframes — along with bulls swiftly reclaiming lost ground — this suggests strong buying interest at lower levels. Therefore, the trading bias仍 remains tilted to the long side.
Trading Strategy:
Consider long positions within 92,700–92,300
Upside target: around 94,500

#BTC/USDT is currently strongly bullish#BTC
The price is moving in a descending channel on the 1-hour timeframe. It has reached the lower boundary and is heading towards breaking above it, with a retest of the upper boundary expected.
We have a downtrend on the RSI indicator, which has reached near the lower boundary, and an upward rebound is expected.
There is a key support zone in green at 92500. The price has bounced from this level multiple times and is expected to bounce again.
We have a trend towards consolidation above the 100-period moving average, as we are moving close to it, which supports the upward movement.
Entry price: 92990
First target: 93204
Second target: 93750
Third target: 94406
Don't forget a simple principle: money management.
Place your stop-loss below the support zone in green.
For any questions, please leave a comment.
Thank you.

BITCOIN SIGNAL: SELL EVERYTHING NOW!!!!!!!? (big)Yello Paradisers! Enjoy the video!
And Paradisers! Keep in mind to trade only with a proper professional trading strategy. Wait for confirmations. Play with tactics. This is the only way you can be long-term profitable.
Remember, don’t trade without confirmations. Wait for them before creating a trade. Be disciplined, patient, and emotionally controlled. Only trade the highest probability setups with the greatest risk to reward ratio. This will ensure that you become a long-term profitable professional trader.
Don't be a gambler. Don't try to get rich quick. Make sure that your trading is professionally based on proper strategies and trade tactics.

BTC is Bearish 81400 Head & Shoulders Pattern Good morning
As you can see easy to spot head and shoulders pattern for this Bearish move for BTC with a target of $81,400 range and yes we can go lower however in this trade this is currently the target.
Any questions or struggling with understand on how to trade BTC let us know more than happy to help
Mindbloome Exchange/ Kris

BITCOIN SIGNAL: ONE MORE DUMP BEFORE PUMP??? (warning)Yello Paradisers! Enjoy the video!
And Paradisers! Keep in mind to trade only with a proper professional trading strategy. Wait for confirmations. Play with tactics. This is the only way you can be long-term profitable.
Remember, don’t trade without confirmations. Wait for them before creating a trade. Be disciplined, patient, and emotionally controlled. Only trade the highest probability setups with the greatest risk to reward ratio. This will ensure that you become a long-term profitable professional trader.
Don't be a gambler. Don't try to get rich quick. Make sure that your trading is professionally based on proper strategies and trade tactics.

BTC Trade Set Up Dec 3 2025Price broke structure to the upside on the 4h which shows buyers are now in control so i will look for 1h-15m bull structure or a tap into 4h demand to target high BSL, supply and daily FVG
