BTCUSDTWe have a big downtrend.
By breakout from support and resistance we will have continued trend to next target.
Breakout 82k ready to 70k.
Breakout 93k ready to 100k and 115k.
CRYPTOCAP:BTC BITSTAMP:BTCUSD BINANCE:BTCUSDT
Btctrade

#BTC/USDT is currently strongly bullish#BTC
The price is moving in a descending channel on the 1-hour timeframe. It has reached the lower boundary and is heading towards breaking above it, with a retest of the upper boundary expected.
We have a downtrend on the RSI indicator, which has reached near the lower boundary, and an upward rebound is expected.
There is a key support zone in green at 85249. The price has bounced from this zone multiple times and is expected to bounce again.
We have a trend towards stability above the 100-period moving average, as we are moving close to it, which supports the upward movement.
Entry price: 86624
First target: 87386
Second target: 88635
Third target: 90106
Don't forget a simple principle: money management.
Place your stop-loss below the support zone in green.
For any questions, please leave a comment.
Thank you.

BTC (bitcoin) Double-Bottom Reversal Testing Key ResistanceHi!
The chart shows Bitcoin forming a clear double-bottom pattern, supported by bullish RSI divergence on the lower panel. This combination often signals exhaustion of downward momentum and a potential trend reversal. The price has rallied strongly from the second bottom and is now pressing directly into the neckline zone, which aligns with a broader descending trendline drawn from previous swing highs.
This overlap creates a high-confluence resistance area. The current reaction here is critical: if price decisively breaks above the neckline and closes above the descending trendline, it would confirm the reversal structure and open the path toward the next major liquidity pocket around the 100k–104k region, marked on your chart as the target. This region matches previous consolidation and supply, making it a realistic upside magnet if breakout momentum is strong.
However, without a confirmed breakout, the neckline remains a potential rejection level, and price could retest the mid-range or even revisit trendline support. Bulls need continuation volume above resistance to flip the zone into support.
Overall, market structure has shifted from aggressive selling to a constructive bottoming phase. The key now is whether bulls can convert this pattern into a sustained trend reversal.

BTCUSD Bullish Reversal Setup - Breakout from 5-Wave Bear CycleBITSTAMP:BTCUSD
The significant bearish move since the high of $116K appears to be complete, or close to it, having been labeled as a 5-wave impulse (1-5). This structure often precedes a corrective relief rally.
Price has recently broken out of a short-term consolidation pattern (potential bull flag) and is attempting to push above the diagonal downtrend line. This confirms a change in short-term momentum.
Trade Plan: I am entering a long position based on the breakout and the potential completion of the bearish impulse.
Entry: $90,490 (Entry is positioned at the confirmed breakout level).
Target: $95,831 (A conservative target to the first major resistance/pivot level).
Stop Loss (Invalidation Zone): $83,930 (Placing the stop below the recent swing low/support area is crucial for risk management).
A successful move will likely challenge the previous major consolidation area around $101,000 - $105,111. Watch this zone for potential profit-taking.
Disclaimer: Trading involves risk. This is for educational analysis only.

Bitcoin Breakout: Key Supply Zone Test & Next Targets BTCUSD – Strong Bullish Breakout from Rising Channel | Key Levels Ahead
Price has broken out strongly from the rising channel after building support near the 86,600 zone. This breakout shows buyer strength and momentum shifting back to the upside.
Currently, BTC is testing an important supply zone around 90,500 – 91,500. A clean breakout and retest of this zone can open the door for a bullish continuation toward the next major resistance near 93,500 – 94,000.
However, if price fails to hold above the breakout level, a pullback toward 88,500 or even deeper into the 86,600 demand zone is possible before the next leg up.
Key Technical Highlights
Rising channel breakout with strong bullish momentum
Price retesting major supply zone
Clear upside target: 93,500 – 94,000
Downside support: 88,500 and 86,600
Clean structure for both breakout & pullback scenarios
📈 My Bias
Bullish as long as price stays above 88,500.
A breakout above 91,500 will confirm continuation

BTC Trade Set Up Dec 2 2025Price BOS to the downside and is making LL/LH on the daily, 4h and 1h so i am expecting price to sweep BSL/London and Asia high, tap 1h FVG to then engulf and CISD to the downside to target SSL

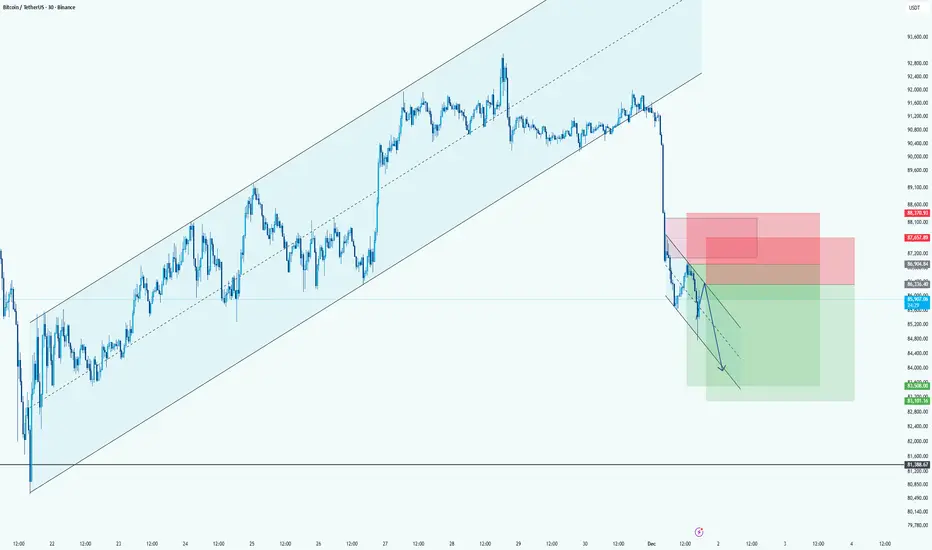
BTC: Bearish Continuation Setup After Major Channel BreakdownHi!
Price broke hard below the long-term ascending channel, confirming a clear shift from bullish to bearish momentum.
After the breakdown, BTC is moving in a small descending correction channel, creating a classic lower-high retracement toward supply.
Direction: Short
Entry Area: 87,200 – 88,300 (two stacked red zones)
Stop-Loss: Above 88,700–89,000 (top of supply)
Target: 83,000 – 84,800 (large green demand area)
BTC/USD 2H – Key Support Levels Holding Strong BTC/USD 2H Analysis
Bitcoin is currently trading inside a clean range structure between a strong resistance zone above and two major support zones below. Price is reacting exactly within these boundaries, showing clear market behavior.
---
🔍 Key Technical Observations
📌 Resistance Zone
Price has rejected this level multiple times, confirming strong selling pressure above.
📌 Support 1
This is the first zone where buyers previously stepped in with strong momentum.
📌 Support 2
A deeper support level where liquidity sits and where strong bullish reactions occurred in the past.
---
📈 Expected BTC Move
Based on structure:
✔ If BTC holds above Support 1, we can expect a bounce toward resistance.
✔ If price breaks Support 1, a move toward Support 2 is likely before any bullish reaction.
✔ Range trading environment — wait for clean reaction signals.
The green arrows on the chart illustrate the potential bounce zones.
---
🙏 Support the Work
Your boosts, likes, and comments motivate me to continue providing clean and accurate chart breakdowns.
👉 Boost the idea & share your thoughts below!
— JT_CHARTsMaster

BITCOIN GET READY FOR MASSIVE HIGH PROBABILITY BULL MOVE SOON!!!🚨 BITCOIN HIGH PROBABILITY BUY SETUP 🚨
* Here We Can See Clearly The Next Potential Moves For BTCUSD Coming Hours/Days.
* Keep Your Eyes Close On Your Trading Positions.
* Happy PIP Hunting Traders.
FXKILLA.

BTC Trade Set Up Dec 1 2025Price pushed higher last week but failing to break and close above the swing high that created the swing low and pushed lower to continue its bearish trend so i will be expecting price to continue lower to sweep SSL

Bitcoin Weakens After H&S Pattern: Next Stop, 89k?Hi!
It looks like price recently formed a pretty clean Head & Shoulders pattern on the 15m timeframe. The left shoulder, head, and right shoulder are all well-defined, and price has already broken beneath the neckline with a clear shift in structure. Momentum is leaning bearish.
The chart also shows a large supply zone above (the red area), which rejected price strongly adding confluence that the top may be in for now.
The projections on the chart make sense: if the neckline continues to hold as resistance, we could see a move down toward the blue demand zone around 88.7k–89k. That’s the next major liquidity pool and likely where buyers might step in again.
Unless price reclaims the neckline with strength, the bias stays short-term bearish with continuation lower.

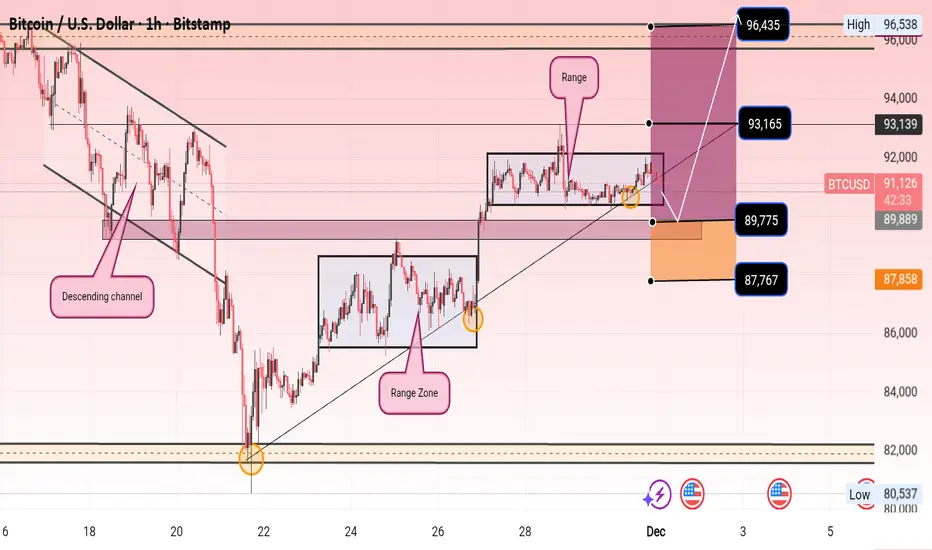
Selena | BTCUSD 1H — Breakout Setup FormingBITSTAMP:BTCUSD
Liquidity has been collected both above and below the current range, suggesting possible buildup before an impulsive expansion. A clean break and retest above the range high may trigger continuation toward the next supply zone, while failure to hold support may lead to deeper retracement.
Key Scenarios
✅ Bullish Case 🚀
Entry 89775
→ 🎯 Target 1: 96,435 (Major supply / imbalance fill)
→ Extended possibilities if momentum continues.
❌ Bearish Case 📉
Break below 87,767
If structure collapses further → deeper discount toward support demand zone below 86K–82K.
Current Levels to Watch
Resistance 🔴: 93,165 | 96,435
Support 🟢: 91,160 (range mid) | 89,775 | 87,767
⚠️ Disclaimer: This analysis is for educational purposes only. Not financial advice.
You will ask yourself "How did he know btc would crash to 80K"?Followers of my charts know that "strangely accurate" calls have been made throughout Btc's recent 3 months worth of price action. I anticipated the previous low at $107K and since September I have repeatedly expressed concerns about a dump to a lower low (see Sept-Oct Btc charts). In September, the "3 Red Week Down Rule" warned us that this lower low was coming (T1).
Once 107K was broken, I cautioned that if the next level down didn't hold (96K-103K), that Btc would go straight to 80K-85K. On Oct 23rd I wrote:
"Btc bounce incoming off support? If not, and support is broken... long way down to 84K.
Too soon for concern, but Btc is currently bottom feeding off my lowest support".
I later offered confluence with a confirmed WT at 84K,200, which confirmed (for me), a big bounce from this 80K-ish zone.
So far my bottom "ALL IN" zone held (T2- 80K-84K).
Btc is currently 92K -up 16%, since bouncing off my buy zone.
I don't point this out for my ego. This is confirmation to all the non-believers...TA works! Also, I keep my own win rate stats, as should everyone. I'm transparent about my trades and my win rates. How else would anyone know if they should follower an "influencer" if they don't have published charts (where you can keep track of their stats).
Once again, congrats to all that have made gains while following my charts.
"May the trends be with you"

BTCUSD Prediction November 2025I,m on buy position on BTCUSD since it hit support,opened a day with bullish bias ,Volume tool support it too .

BTC. End of correction long.Only if we can take the 94.6 level the true long confirmed. Otherway it flat between 85 -95 +/-

BTC Trade Secured 1500 PipsSet up played out perfectly sweeping SSL followed by 15m engulfing and CISD to target BSL

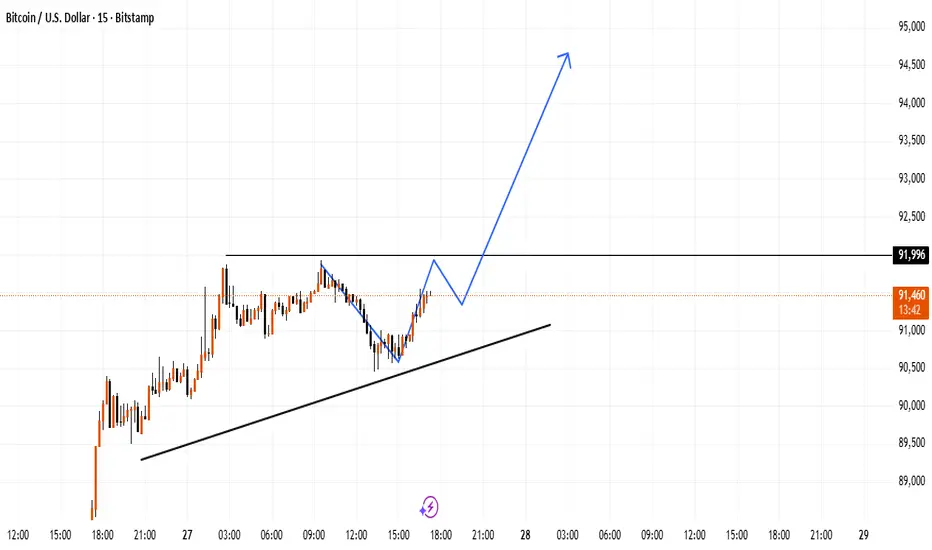
BTC Price Watching Key Barrier and Rising SupportThe chart highlights a rising support line guiding recent movement, while a horizontal zone near the top acts as a key barrier.
If price continues respecting the upward structure, momentum may build once this upper level is cleared with strength.
BTC Trade Set Up Nov 27 2025Overall price remains bullish making HH/HL on the 1h but there is a big 4h FVG and 1h SSL that i will like to see liquidated before looking for a continuation towards 93k

BTCUSD – Potential CHOCH Before Bullish Continuation |SMCAThe Bitcoin market continues to maintain a strong uptrend structure. Previously, price formed a Double Top, followed by a Change of Character (CHOCH) that led to the creation of a new Higher High — confirming bullish strength.
Currently, the market has printed another Double Top, suggesting the potential for another CHOCH or short-term retracement. A move toward the Bullish Order Block (BU-OB) could provide a point of interest before the next leg higher and continuation of the overall bullish trend.
💬 Share your thoughts below — what do you think the next move will be?
👍 Don’t forget to like and follow for more structured Smart Money Concept analyses.

BTC Trade Secured 2.4%Price broke structure to the upside on the 4h, came down to sweep SSL to then buy up to BSL. The next move will want to wait for a pull back to then continue towards 93k

Bitcoin BTC Bearish Momentum: My Trade Plan ExplainedI’m keeping a close eye on Bitcoin (BTC) right now. On the 4H timeframe, price action remains firmly in a sustained bearish trend. I’m anticipating a possible continuation to the downside.
If BTC holds at the current level and fails to retrace into the imbalance highlighted on the 1H chart — and we see a bearish rotation with a clean break in market structure — I’ll be watching for a potential short setup.
⚠️ Not financial advice.

Bitcoin (BTC/USD) Faces Key Test After Heavy ETF Outflows Bitcoin (BTC/USD) trades near $87,108 after one of its hardest months of the year. November’s drop erased more than 20% and sent price far below the $126,000 peak. This correction exposed the sensitivity of the new ETF-driven market structure. Traders now debate whether the trend weakens toward $73K, or if the bounce from $82K signals a recovery wave forming.
ETF Outflows Accelerate as Sentiment Turns Cautious
BlackRock’s iShares Bitcoin Trust saw $2.2 billion in outflows this month—its worst performance since launch. Short-term ETF holders rushed to exit after BTC fell more than 40% from the October high. Analysts like Jay Hatfield describe these flows as “gambling capital,” reacting fast to volatility.
Macro uncertainty adds fuel. Traders monitor consumer sentiment, inflation, and retail sales. Odds for a December rate cut sit above 80%, yet markets remain unsure. This pushes some investors toward gold and defensive assets.
Leverage ETFs Expand as Global Demand Grows
Europe prepares for 3x long and 3x short Bitcoin ETFs, set to list on SIX Swiss Exchange. The U.S. may soon see 5x leveraged crypto ETFs, while other regions adopt 2x and on-chain leveraged products. These tools attract active traders but raise concerns. October’s $19 billion liquidation wave showed how leverage can intensify downturns.
ETF Flow Instability Creates Sharp BTC Swings
November ETF outflows totaled $3.5 billion, with daily flows flipping rapidly. Citi Research estimates that every $1B in ETF outflows pulls BTC lower by 3.4%. November’s chart aligns closely with this model, making support levels critical.
Technical Outlook: Watching $82K and the $73K–$75K Zone
Bitcoin broke its multi-week ascending trendline, now resistance near $100K.
Support: $82K, $73K–$75K, below $70K
Resistance: $96K, $100K, broken trendline
Holding above $82K keeps a rebound alive. Losing $73K–$75K risks a slide under $70K and a deeper shift.

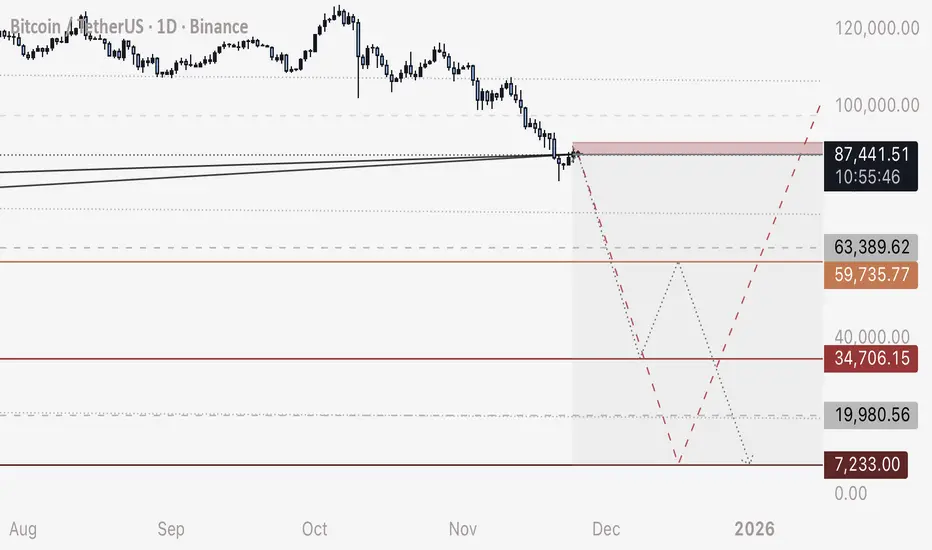
BTC - Short Update - Next Three MovesAs an update to my BITCOIN short plan, here are my next three expected moves / trades:
1. SHORT
Entry - 87,500-87,800
Stop Loss - 89,700
Target - 38,000 (exact wick bottom expected 34,700)
2. LONG
Entry - 34,800 to 35,500
Stop Loss - 33,000
Target - 55,000
3. SHORT
Entry - 58,500 to 59,500
Stop Loss - 64,000
Target - 10,000
Happy Trading
- DD