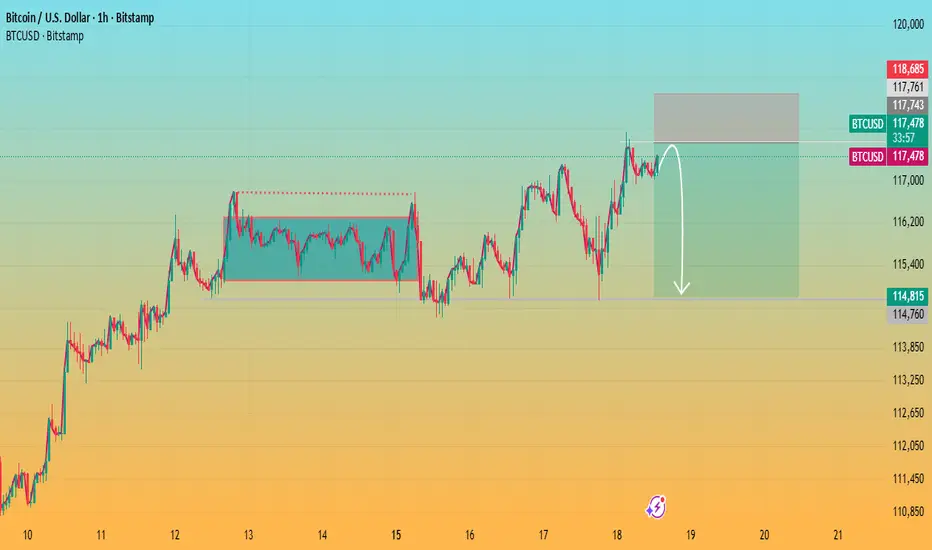
Bitcoin Testing Resistance with Potential Pullback AheadKey observations:
Range Breakout: Earlier, Bitcoin broke out of a consolidation zone (marked box), which triggered the recent upward move.
Resistance Zone: Price is hovering near the 5.15%–5.42% gain zone, where selling pressure has historically emerged.
Pullback Signal: The drawn arrow suggests a possible rejection at this resistance, pointing to a corrective move down toward the 3% zone.
Momentum Check: If BTC fails to hold above this resistance, a retracement is likely. However, a strong breakout could open the door toward 6% gains.
Btctrade
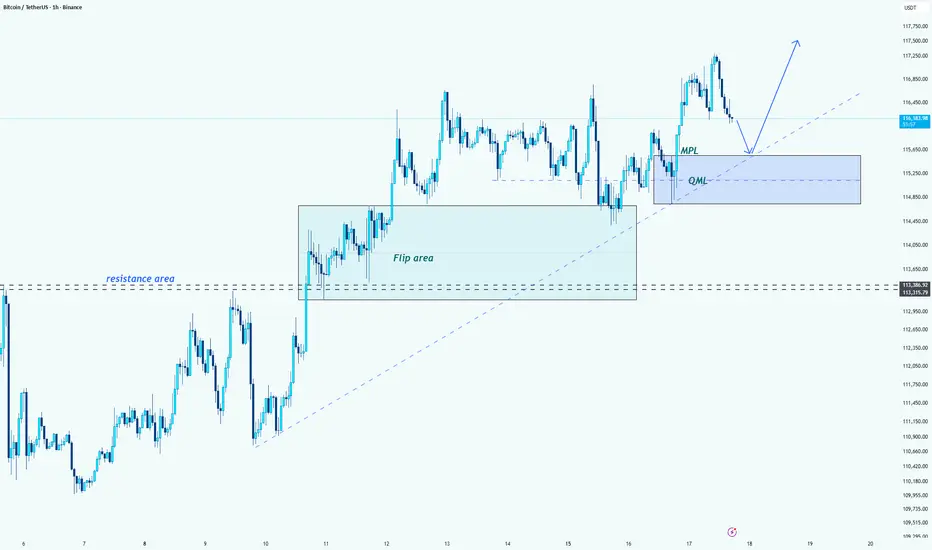
Bitcoin (BTC/USDT) -> MPL and QML AnalysisHello guys!
Let's analyze btc!
⚡ Trading Strategy
MPL Level: 115,000 should be tested before the price rises, so wait for confirmation here before entering long positions.
Target: The next major target for the uptrend is around 117,500.
--------------------
📈 Outlook
Bullish: If price holds above the QML, the bullish trend could continue towards 117,500.
Watch for Retest: Keep an eye on 115,000 for a possible retest before further upside.
BTC Analysis — Long-Term Buy Zone AheadI'm watching $111,000 as a major buy zone on Bitcoin.
If price retraces to that level, I’ll be ready to enter a long position.
This is not a prediction — it’s a scenario.
Smart traders don’t guess, they prepare.
Let price come to your level. No chasing.
📍Set your alerts and stay patient.

BTCUSDT Long Aiming on 0.618FibBTCUSDT is positioned for a long move, targeting the 0.618 Fibonacci level, with potential extension toward the 0.7 level. With the anticipated U.S. rate cut announcement at market open, we expect a bullish bounce in crypto, followed by a possible short-term downtrend afterward.

ANFIBO | BTCUSD in my view todayHello guys! It's me, Anfibo.
Here is my Strategic and Market Sentiment Perspective :
I agree with the view that BITSTAMP:BTCUSD is currently in a compression phase. The market seems to be waiting for a catalyst (potentially economic data or macro news) to break out of this consolidation zone.
>>> Key observations:
Trading volume has shown signs of decline over the past few sessions, reflecting investor sentiment of waiting on the sidelines rather than taking strong action.
Funding rates and overall market sentiment remain positive but not overly euphoric, which is a healthy signal supporting the case for a sustainable upward move.
On the Daily timeframe, the primary trend remains bullish, and the current sideways movement appears to be a technical correction within the broader uptrend.
>>> Strategic approach for today:
> For short-term traders: consider accumulating small positions around the support levels of 115,200 – 114,400, with stop-loss orders set below 114,000 to manage downside risk.
> For medium-term investors: it is more prudent to wait for a confirmed breakout above the 117,000 – 118,000 resistance zone before scaling into larger positions, targeting the 120,000 – 123,000 levels.
Have a beautiful day!

You will ask yourself "how did he know Btc would do that"?On Aug 8th I suggested that based on my research of historical data, Btc would bottom as low as 107K. Btc bottomed at 107...and I then suggested a "bounce incoming".
On Sept 2nd I suggested that Btc had hit a bottom and was about to bounce into 1 of my three targets within 2 weeks. We are at the end of that 2 week period and T1 and T2 have been hit.
Question remains where do we go from here?
The 3 week down rule suggests that we form a lower low (below 107K). Will today's Fed meeting be the excuse for that pattern to play out?
What are your thoughts? I'd like to hear from you to gauge sentiment.

BITCOIN UPDATEHello friends
According to the open cycle, we can say that our trend is bullish and is in a channel, but a resistance has stopped it, which it has hit twice. Now we have to see if this resistance will finally be broken or if the price will continue to suffer below this resistance.
If the price breaks the resistance, it will move to the specified targets.
Trade safely with us.

Will Bitcoin break new highs?Bitcoin has seen no major market moves. Overall, the ascending channel remains intact, and there seems little more to elaborate on. We maintain our previous view: exchange time for space.
Key Resistance: The $116,800 level has become the main battlefield for bulls and bears. If it breaks through strongly, the short-term target will look toward $118,000 or even $120,000.
Key Support: The $114,400 level is the first line of defense below; a break below this level may lead to a retracement to $113,200.
If you agree with my views, please give me a thumbs up. Thanks for your encouragement and support.

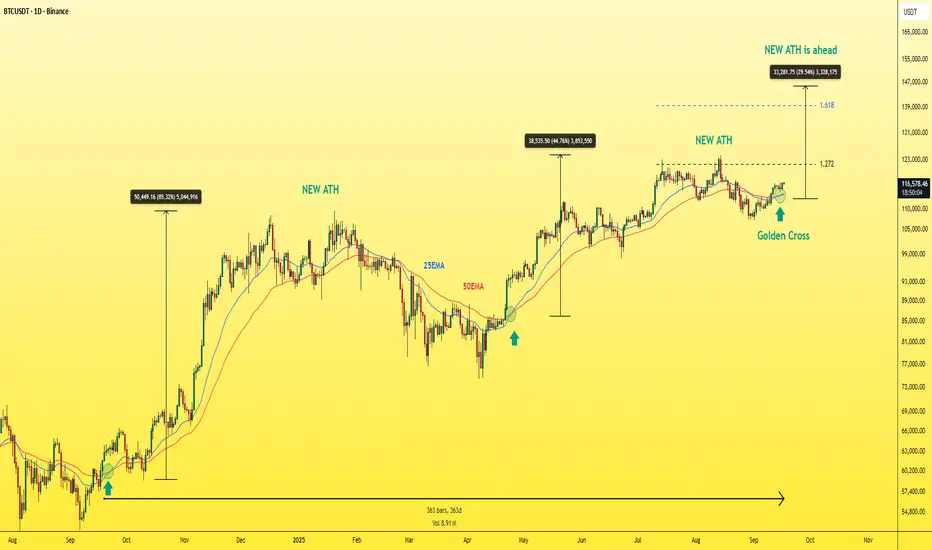
BITCOIN - New ATH is ahead!Over the past year — exactly 363 days — Bitcoin has only formed the Golden Cross pattern 3 times.
If you look at the chart, you’ll notice that each time this pattern appeared, it triggered a strong bullish rally leading to a new ATH (all-time high), as clearly shown.
And right now, Bitcoin is forming this exact pattern again on the daily timeframe.
For clarity:
- The Golden Cross happens when a smaller EMA (like the EMA 25) crosses above a larger EMA (like the EMA 50) .
This crossover is a classic bullish signal often marking the start of major upward moves.
based the fibonacci The next expected ATH for BTC is projected around 140K
Best Regards :
Ceciliones
ANFIBO | BTCUSD on 09.17.2025 to 09.21.2025 I guess ???Hello guys, Anfibo's here! 👋
I think BITSTAMP:BTCUSD is bullish on the uptrend channel and still holding strong without any break. BTC may retest the support zone of $111.000 and re-reach the resistance levels of $123.000 and $127.000, and possibly up to $135.000.
Here's my setup:
✅ BUY SCALP: 110 - 111, SL 107, TP 122 - 126
❌ SELL SCALP: 126 - 128, SL 130, TP 120 - 114
Wishing my followers all the best <3

Can Bitcoin Still Rise to 120,000?The Bitcoin market is currently in a range-bound consolidation phase, with no clear overall trend breakout. Yesterday, the price once surged above the 116,000 mark, but failed to hold this position, and then quickly fell back into the oscillation range, forming a typical "false breakthrough" trend on the technical side. This phenomenon clearly indicates that the market still faces strong selling pressure at high levels, and bullish momentum to push prices upward is somewhat insufficient, making it difficult to break out of the volatile market in the short term.
From a macroeconomic perspective, the window for the Fed to cut interest rates is approaching, and the market is in the process of digesting policy expectations, which makes the current market more characterized by "accumulating strength and waiting" - both bulls and bears remain relatively cautious, and the game intensifies near key points, waiting for clear policy signals or capital flows to break the balance.
By observing the daily level pattern, it can be found that the market has recently shown a healthy volume structure of "large volume rise and small volume pullback". At the same time, the lower edge support of the rising channel formed in the early stage is still valid, the price pullback has not fallen below the key support level, and the overall upward trend framework has not been destroyed. Based on the above analysis, we still maintain the original strategy unchanged, continue to hold the existing long positions, and adhere to the operating idea of "trading time for space" - not being disturbed by short-term false breakthroughs or shock fluctuations, patiently waiting for the market to complete accumulation and clarify the direction, and then seize trend opportunities.

BitCoin $BTC weekly demand from $110,500 is playing out wellBitCoin CRYPTOCAP:BTC weekly demand from $110,500 is playing out well. Trying to reach the resitance level overhead and hopefully break all-time highs.

BITCOIN PREDICTION: NOBODY is EXPECTING THIS!!! (this will hurt)Yello Paradisers! In this video, we are going through multiple timeframes. We are taking a look at the CME futures gap that has closed. As professional traders, we are going through the ultra-high timeframe chart I'm sharing with you, including the channel reclaim and retest, the bearish divergence, and the decrease in volume. On a high timeframe chart, I'm sharing with you the zigzag.The possible start of the impulse is now in the secondary wave. The bearish divergence means we need to wait for a cross, a shooting star candle on the daily, and nice volume as well. If we look at the medium timeframe, we are seeing the bearish divergence, plus the cross, plus the resistance, the Elliott wave, the shooting star, and the double top formation.
Paradisers! Keep in mind to trade only with a proper professional trading strategy. Wait for confirmations. Play with tactics. This is the only way you can be long-term profitable.
Remember, don’t trade without confirmations. Wait for them before creating a trade. Be disciplined, patient, and emotionally controlled. Only trade the highest probability setups with the greatest risk to reward ratio. This will ensure that you become a long-term profitable professional trader.
Don't be a gambler. Don't try to get rich quick. Make sure that your trading is professionally based on proper strategies and trade tactics.

BTC 1HOn the one-hour chart, the market has been consolidating in a sideways range for some time, forming a clear box structure between support and resistance. Recently, price failed to break above the range and quickly rejected from the upper boundary, showing weakness from buyers. Now, the market is testing the lower boundary of the box.
If the structure confirms a breakout to the downside, we could see a shift in momentum towards a bearish trend, with potential continuation after a possible retest of the broken support. This pattern represents a classic range-to-breakdown scenario, where prolonged consolidation often leads to a strong move once one side is taken out.
What do you think: will the market respect the range again or are we about to see a confirmed bearish breakout?

Bitcoin's life and death lineAfter hitting the previous high, Bitcoin quickly retreated and has recently repeatedly tested the pressure level near 116,000. Only by breaking through this position can it continue to move upward to 118,000-120,000. On the contrary, if the support level of 113,200 is lost, it may pull back to the 110,000 line. Overall, the structure of the rising channel is still intact, and short-term fluctuations are more likely. The effectiveness of the breakthrough of 116,804 will determine the medium-term direction.

High-level fluctuations, BTC short-term trading arrangements#BTCUSD
After BTC started to rise from 113500, it continued to fluctuate and consolidate at a high level, and is also waiting for the specific basis point of the Federal Reserve's interest rate cut. In the short term, BTC is experiencing a retracement. Aggressive traders can consider trying to arrange long orders at 115500-115000. Once it falls below 115000, SL is carried out in time, with the target looking at 116500-117500.

Bitcoin Price To Climb Higher Amid Rising Institutional AdoptionBitcoin Price To Climb Higher Amid Rising Institutional Adoption, Yet Ethereum's Relative Value Puzzles Investors
The digital asset landscape presents a fascinating dichotomy. Bitcoin, the undisputed leader, appears poised for a significant ascent, with analysts increasingly confident in a rally toward the coveted $120,000 mark. This optimism is overwhelmingly fueled by a powerful and sustained wave of institutional adoption, underscored by staggering inflows into U.S. spot Bitcoin Exchange-Traded Funds (ETFs). However, a perplexing counter-narrative is unfolding with Ethereum. Despite its own significant institutional embrace and the successful launch of its own ETFs, the ETH/BTC price ratio remains stubbornly low, signaling a relative weakness against Bitcoin that has left many investors searching for answers.
Bitcoin's Bullish Momentum: The Unstoppable Force of Institutional Capital
The sentiment surrounding Bitcoin is palpably bullish. After a period of consolidation, the cryptocurrency has shown remarkable resilience, holding key support levels and demonstrating renewed strength. Bitcoin is trading at elevated levels, with technical analysts and market experts setting their sights on the next major psychological barrier of $120,000. A sustained break above this level is widely expected to trigger a fresh wave of buying pressure, potentially propelling the price toward new all-time highs.
A flurry of price predictions from various financial institutions and seasoned analysts paints a picture of widespread optimism. Forecasts range from conservative six-figure targets to highly bullish projections well above $200,000. These predictions are united by a common thread: the transformative impact of institutional adoption.
The primary engine driving this bullish outlook is the unprecedented success of U.S. spot Bitcoin ETFs. These investment vehicles have served as a regulated and accessible bridge for institutional capital to flow into the digital asset space. Recent weekly net inflows have been measured in the billions of dollars, reversing previous outflows and signaling a renewed and voracious investor appetite. Leading funds from major asset managers have been the primary beneficiaries, consistently attracting hundreds of millions in fresh capital.
This influx of institutional money represents a fundamental shift in how Bitcoin is perceived. Major institutions are actively adding exposure and incorporating Bitcoin into their long-term investment strategies. This is evidenced by the behavior of "whales"—large Bitcoin holders—who have been accumulating significant amounts, viewing price dips as buying opportunities. The growing institutional presence is also contributing to a reduction in Bitcoin's notorious volatility, making it a more attractive asset for diversified portfolios.
Further bolstering the bullish case are favorable macroeconomic conditions. With expectations for lower interest rates, the appeal of risk assets like Bitcoin is on the rise. A weaker U.S. dollar and lower borrowing costs historically create a fertile environment for assets with a fixed supply to thrive. The confluence of massive ETF inflows, strategic institutional accumulation, and a supportive macroeconomic backdrop has created a powerful tailwind for Bitcoin.
The Ethereum Conundrum: High Adoption, Low Ratio
While Bitcoin basks in the glow of institutional validation, the story for Ethereum is more nuanced. On the surface, Ethereum is experiencing its own institutional renaissance. The approval of spot Ethereum ETFs has been met with considerable enthusiasm, attracting billions in capital and providing a regulated pathway for traditional investors to gain exposure to the world's leading smart contract platform.
The inflow data for Ethereum ETFs has been impressive, at times even surpassing Bitcoin's on a monthly basis. Cumulative inflows have reached a significant figure, a clear testament to the growing recognition of Ethereum's value proposition, which extends beyond a simple store of value to encompass the vast ecosystems of decentralized finance (DeFi), non-fungible tokens (NFTs), and real-world asset (RWA) tokenization.
Institutions are not just buying ETH through ETFs; they are also actively participating in the network's staking mechanism. An unprecedented surge in staking activity has seen a significant portion of ETH's circulating supply locked away to secure the network and earn yield. This "supply squeeze" is fueled by both institutional players and large individual holders, underscoring the long-term conviction in Ethereum's future. With a large percentage of the total supply staked, the available liquidity on exchanges has dwindled, a factor that would typically be expected to exert strong upward pressure on the price.
Given this backdrop of robust adoption, significant ETF inflows, and a tightening supply, one would expect Ethereum to be gaining ground on Bitcoin. However, the ETH/BTC price ratio, a key metric that reflects the relative value of Ethereum to Bitcoin, tells a different story. This ratio has remained stubbornly below the 0.05 mark, a level that signals relative weakness for ETH. It currently hovers at a low level, far from its historical peak.
This persistent underperformance is a source of considerable debate. A higher ratio indicates that ETH is appreciating faster than BTC. The current suppression suggests that while absolute demand for Ethereum is strong, the demand for Bitcoin is even stronger.
Several factors may be contributing to this conundrum. Bitcoin's established brand and its narrative as "digital gold" give it a powerful first-mover advantage, particularly among institutional investors taking a conservative, phased approach. For many, Bitcoin is the initial and primary allocation.
Secondly, Ethereum's utility introduces complexities and risks compared to Bitcoin's simpler value proposition. The ongoing evolution of the network, while bullish long-term, may present a steeper learning curve for some investors.
Furthermore, a historical trend of Bitcoin outperforming Ethereum may have created market inertia, with capital continuing to flow into the asset with stronger recent relative performance. In essence, both assets are appreciating, but Bitcoin is doing so at a faster rate, keeping the ratio suppressed.
Beyond the Big Two: Other Trending Cryptos to Watch
While Bitcoin and Ethereum dominate, the broader cryptocurrency market is a hotbed of innovation. Investors are exploring a diverse range of projects with potential for significant growth, driven by several key trends.
Layer-2 Scaling Solutions: As Ethereum faces demand-driven congestion, Layer-2 solutions have become indispensable. Projects offering faster, cheaper, and more scalable environments for decentralized applications are capturing a growing share of activity and represent a crucial investment theme for ecosystem growth.
Integration of Artificial Intelligence and Blockchain: The convergence of AI and blockchain is gaining considerable traction, creating new possibilities in automated trading, decentralized organizations, and sophisticated dApps. Projects leveraging AI to enhance blockchain capabilities are attracting significant attention.
Tokenization of Real-World Assets (RWA): This is poised to be one of the most transformative trends. Representing physical assets like real estate and commodities as digital tokens on a blockchain has the potential to unlock trillions in illiquid assets, making them more accessible and tradable globally. This is expected to drive a new wave of adoption.
Meme Coins and Community-Driven Projects: While often speculative, meme coins continue to exert significant influence, demonstrating the power of community and viral marketing. Their enduring popularity highlights the importance of cultural relevance in the crypto space.
The altcoin market is characterized by higher volatility and risk. However, for investors with a high-risk tolerance, it offers the potential for outsized returns based on technological adoption and market trends.
The Road Ahead: A Market at a Crossroads
The cryptocurrency market is a study in contrasts. The overwhelming force of institutional adoption is propelling Bitcoin toward potentially historic highs. The success of Bitcoin ETFs has fundamentally altered the market structure, creating a sustained demand that shows no signs of abating.
Conversely, the curious case of the ETH/BTC ratio serves as a reminder of the market's complexity. While Ethereum's own institutional story is compelling, it has yet to translate into sustained outperformance against Bitcoin.
Looking ahead, the market's trajectory will be shaped by key factors. Central bank monetary policy will continue to play a crucial role. The continued growth of the ETF market will be a primary indicator of institutional sentiment. And ongoing innovation in scaling, AI, and tokenization will determine the next generation of leading projects.
For investors, the current environment offers both immense opportunity and significant risk. The bullish case for Bitcoin appears robust, but volatility remains. Ethereum's long-term value is undeniable, but its short-to-medium-term performance relative to Bitcoin is less certain. The altcoin market holds promise but requires careful navigation.
In conclusion, the narrative of rising institutional adoption is powerfully reshaping the digital asset landscape. As Bitcoin bulls eye their next target, the broader market watches closely, navigating the crosscurrents of innovation, regulation, and macroeconomic forces that will define the future of this transformative technology.

Is Bitcoin accumulating strength for an upward move or peaking? Bitcoin rebounded after hitting the minor support of the rising channel. The recent pattern is still in the stage of oscillation and accumulation, with the price running between the strong support level of 113200 and the strong resistance level of 116784. The bullish arrangement of the moving average and the engulfing pattern form a strong bullish resonance. The lows are also gradually rising, so this rebound is not over. Friends who opened long orders can continue to hold, with targets at 116784-118000-121000.

Can Bitcoin break through 120,000?The Bitcoin market as a whole showed obvious "flat consolidation" characteristics over the weekend. Today's price maintained a narrow sideways fluctuation pattern, with an upper and lower range of only about 1,000 points. The bulls and bears played a moderate game in the current range, and there was no obvious directional competition. The market is temporarily in a state of accumulation.
However, from a technical perspective, after Bitcoin successfully broke through the key resistance level at the 4-hour level, it did not pull back. Instead, it showed a trend of "continuously rising lows" - that is, the low point of each pullback is higher than the previous low point. This pattern is a typical signal of a bullish trend, indicating that the overall bullish power in the market is gradually accumulating, the short-selling pressure continues to weaken, and the market direction has shifted to the bulls.
Based on this judgment, there is no need to adjust positions due to short-term sideways fluctuations. You should continue to firmly hold the long positions you have established and remain patient to "let profits fly for a while." The short-term sideways movement is more of a post-breakout accumulation phase. Once the market digests the current range, it is likely to continue its bullish trend, further opening up upside potential.
I'm Matthew, an analyst focused on technical analysis. If you have any questions regarding specific operations or trend judgments, feel free to communicate and discuss with me at any time. Let's learn trading logic together and move forward steadily in the market!

BTC chart analysis – my assessment
Wave A was completed on September 1, 2024, and we are currently in wave B.
Wave C within the B structure is currently being extended. I expect a correction (wave 4) down to the green support zone, which also contains important Fib levels and a lot of liquidity.
I then expect a final upward movement to around USD 120,000. If this mark is broken on a sustained basis, I believe there is a high probability that we are no longer in a B correction, but already in wave 1 of the final wave 5. Until then, however, I expect a correction in the coming days or weeks.
Why a correction is likely:
The interest rate decision is due on September 17. I expect a cut, as the economy is weakening and inflation remains an issue. Historically, markets have tended to react bearishly to interest rate cuts, as these steps are seen more as a rescue measure.
My scenario:
First, there will be an increase to around $120,000 (market maker move), followed by a pullback to the range between $107,000 and $98,000. There is a lot of liquidity there. My first planned purchase range is between $107,000 and $106,000. From there, I expect a recovery and the formation of the final wave 5 by the end of the year. This could be followed by a major correction, partly in response to the late interest rate policy.
What do you think—could this scenario be plausible?
Best regards,
Trading Architecture

All Eyes on 90–94K — The Next Big #BTC MoveCRYPTOCAP:BTC touched 116.6K, right where we expected. I’m still holding my position and waiting for lower targets. If price pushes into 120–125K, I’ll add more there. My main downside targets stay the same: 105K → 100K → 95K → 90K.
Don’t let price swings control your emotions. The real move is still ahead. Market makers are pushing altcoins higher just to trap liquidity before a big dump.

Allow profits to continue growing.Today, Bitcoin's price movement has demonstrated a healthy rhythm of "testing - retracing - re-attacking": in the early trading session, it first moved upward to test the previous key resistance level, then proactively retraced to the lower support to confirm the validity of the breakout. After completing the correction, it once again launched a challenge to today's high. This retracement and correction trend not only digests the selling pressure from short-term profit-taking orders but also further accumulates the bullish momentum in the market. Compared with the previous oscillating pattern where "a breakout is immediately followed by a pullback", the current trend is more sustainable, laying a foundation for the continuation of the subsequent trend.
From the technical perspective of the hourly chart, there are clear bullish signals: the moving averages have formed an upward divergence pattern, and the price has always stood firmly above all moving averages. The moving average system has switched from a "convergent oscillation" state to a "bullish arrangement". This indicates that the short-term market has gradually broken away from the previous range-bound consolidation and officially transitioned to a bullish trend. Based on the current trend judgment, there is no need to rush to adjust the positions we established earlier in accordance with the strategy; we should continue to hold the existing positions and "let profits run".
If you feel confused about the future market trend, or if you have not yet made profits in such a market, follow me and leave me a message – let me help you resolve this issue.

BITCOIN PREDICTION: NEXT MASSIVE MOVE TO HERE - INCOMING!!!!!!!Yello Paradisers! In this video, we have been going through multi-time frame analysis as professional traders using Elliott Wave Theory and other advanced technical indicators and analysis techniques.
On the ultra-high time frame, we have been going through the Elliott Wave price section since 2023. We have taken a look at the Moving Average Trendline Touch, which worked perfectly, the Channel Retest that is incoming, and the Bearish Divergence with Bearish Cross.
On medium and high timeframe charts, I have been sharing with you the completed zigzag and first wave. We are currently in the secondary wave, waiting for it to finish, along with resistances and bullish and bearish divergences.Together with that, there are shooting star patterns, and on a low timeframe, I have been sharing with you the triple top reclaim and the next possible resistances, and what the next resistance and target are from a multiple timeframe perspective.
Paradisers! Keep in mind to trade only with a proper professional trading strategy. Wait for confirmations. Play with tactics. This is the only way you can be long-term profitable.
Remember, don’t trade without confirmations. Wait for them before creating a trade. Be disciplined, patient, and emotionally controlled. Only trade the highest probability setups with the greatest risk to reward ratio. This will ensure that you become a long-term profitable professional trader.
Don't be a gambler. Don't try to get rich quick. Make sure that your trading is professionally based on proper strategies and trade tactics.
