BTCUSD Bullish Reversal Setup - Breakout from 5-Wave Bear CycleBITSTAMP:BTCUSD
The significant bearish move since the high of $116K appears to be complete, or close to it, having been labeled as a 5-wave impulse (1-5). This structure often precedes a corrective relief rally.
Price has recently broken out of a short-term consolidation pattern (potential bull flag) and is attempting to push above the diagonal downtrend line. This confirms a change in short-term momentum.
Trade Plan: I am entering a long position based on the breakout and the potential completion of the bearish impulse.
Entry: $90,490 (Entry is positioned at the confirmed breakout level).
Target: $95,831 (A conservative target to the first major resistance/pivot level).
Stop Loss (Invalidation Zone): $83,930 (Placing the stop below the recent swing low/support area is crucial for risk management).
A successful move will likely challenge the previous major consolidation area around $101,000 - $105,111. Watch this zone for potential profit-taking.
Disclaimer: Trading involves risk. This is for educational analysis only.
Btctrend

BTC Trade Set Up Dec 2 2025Price BOS to the downside and is making LL/LH on the daily, 4h and 1h so i am expecting price to sweep BSL/London and Asia high, tap 1h FVG to then engulf and CISD to the downside to target SSL

BTC: Bearish Continuation Setup After Major Channel BreakdownHi!
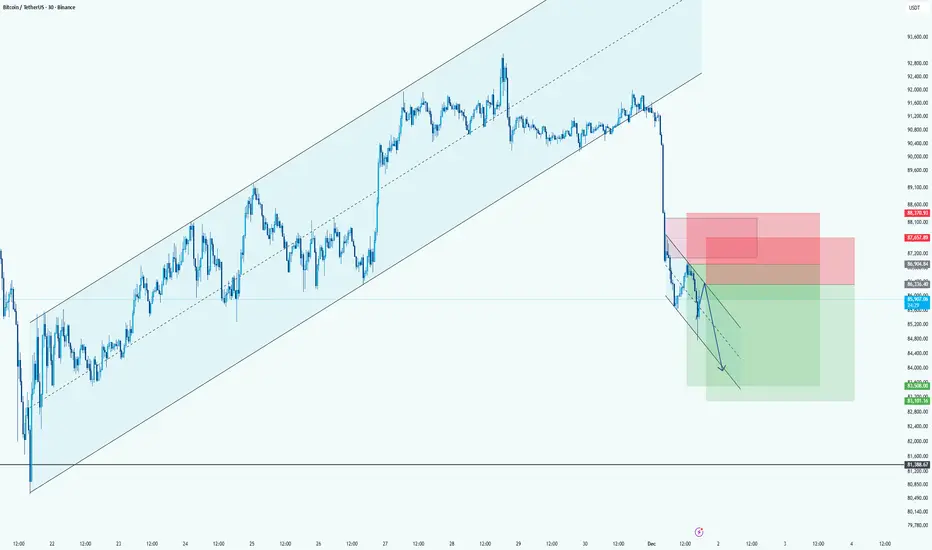
Price broke hard below the long-term ascending channel, confirming a clear shift from bullish to bearish momentum.
After the breakdown, BTC is moving in a small descending correction channel, creating a classic lower-high retracement toward supply.
Direction: Short
Entry Area: 87,200 – 88,300 (two stacked red zones)
Stop-Loss: Above 88,700–89,000 (top of supply)
Target: 83,000 – 84,800 (large green demand area)
BTC/USD 2H – Key Support Levels Holding Strong BTC/USD 2H Analysis
Bitcoin is currently trading inside a clean range structure between a strong resistance zone above and two major support zones below. Price is reacting exactly within these boundaries, showing clear market behavior.
---
🔍 Key Technical Observations
📌 Resistance Zone
Price has rejected this level multiple times, confirming strong selling pressure above.
📌 Support 1
This is the first zone where buyers previously stepped in with strong momentum.
📌 Support 2
A deeper support level where liquidity sits and where strong bullish reactions occurred in the past.
---
📈 Expected BTC Move
Based on structure:
✔ If BTC holds above Support 1, we can expect a bounce toward resistance.
✔ If price breaks Support 1, a move toward Support 2 is likely before any bullish reaction.
✔ Range trading environment — wait for clean reaction signals.
The green arrows on the chart illustrate the potential bounce zones.
---
🙏 Support the Work
Your boosts, likes, and comments motivate me to continue providing clean and accurate chart breakdowns.
👉 Boost the idea & share your thoughts below!
— JT_CHARTsMaster

BTC Trade Set Up Dec 1 2025Price pushed higher last week but failing to break and close above the swing high that created the swing low and pushed lower to continue its bearish trend so i will be expecting price to continue lower to sweep SSL

#Bitcoin HTF IdeaThey haven’t allowed the price to make even a single higher high for about 50 days.
In an environment like this, the HTF looks completely negative.
The green box I marked with an alert below will be important — I’m waiting for that area.

Bitcoin rebounds — Key support at 88–90k remains crucial📰 Market Movement
BTC trades around ~90,700 USD after bouncing from the 80k zone.
📊 Daily range stays wide:
🔼 High: ~93,000
🔽 Low: ~90,300
- Strong trading volume shows active dip-buying interest.
- BTC stabilizing suggests a short-term bottom may be forming.
📉 Technical Analysis
🟦 Support: 88,000 – 90,000
🟥 Resistance: 93,000 – 95,000
📌 Consolidation phase after a strong drop → sellers losing momentum.
🔎 Outlook
Holding 88–90k strengthens the case for a rebound towards 94–96k and potentially 100k. Losing support could open doors to deeper retracements.
🎯 Suggested Trading Setup
🔺 BUY BTC
Entry: 89,000 – 91,000 USD
🎯 TP: 94,500 / 96,000 / 100,000 USD
🛑 SL: 87,000 USD

Selena | BTCUSD 1H — Breakout Setup FormingBITSTAMP:BTCUSD
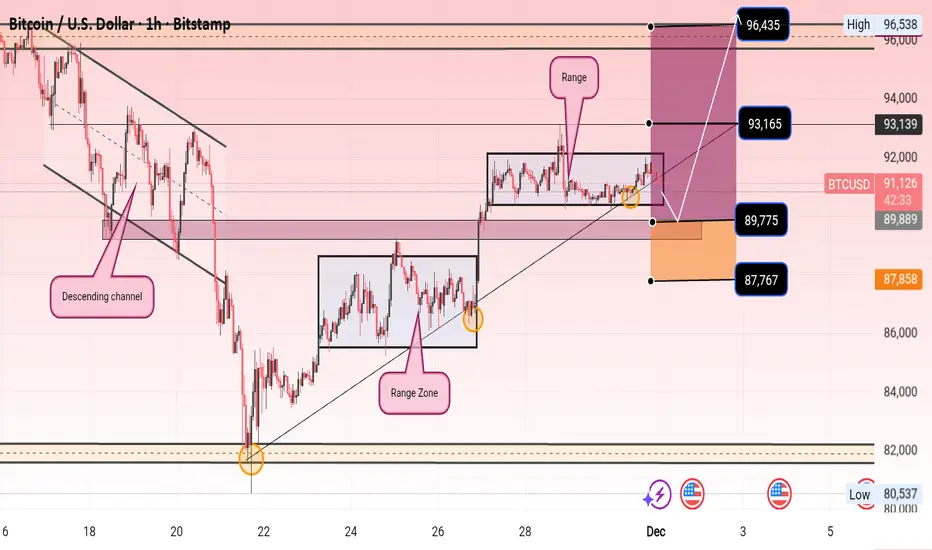
Liquidity has been collected both above and below the current range, suggesting possible buildup before an impulsive expansion. A clean break and retest above the range high may trigger continuation toward the next supply zone, while failure to hold support may lead to deeper retracement.
Key Scenarios
✅ Bullish Case 🚀
Entry 89775
→ 🎯 Target 1: 96,435 (Major supply / imbalance fill)
→ Extended possibilities if momentum continues.
❌ Bearish Case 📉
Break below 87,767
If structure collapses further → deeper discount toward support demand zone below 86K–82K.
Current Levels to Watch
Resistance 🔴: 93,165 | 96,435
Support 🟢: 91,160 (range mid) | 89,775 | 87,767
⚠️ Disclaimer: This analysis is for educational purposes only. Not financial advice.
Bitcoin BTC Bearish Momentum: My Trade Plan ExplainedI’m keeping a close eye on Bitcoin (BTC) right now. On the 4H timeframe, price action remains firmly in a sustained bearish trend. I’m anticipating a possible continuation to the downside.
If BTC holds at the current level and fails to retrace into the imbalance highlighted on the 1H chart — and we see a bearish rotation with a clean break in market structure — I’ll be watching for a potential short setup.
⚠️ Not financial advice.

BitcoinBTCUSD
- Change of Characteristics
- Completed " 1234 " Impulsive Waves
- Break of Structure
- Fair Value Gap
- Resistance Level

BITCOIN SIGNAL: BUY NOW!!!!!!!? (trap) Yello Paradisers! Enjoy the video!
And Paradisers! Keep in mind to trade only with a proper professional trading strategy. Wait for confirmations. Play with tactics. This is the only way you can be long-term profitable.
Remember, don’t trade without confirmations. Wait for them before creating a trade. Be disciplined, patient, and emotionally controlled. Only trade the highest probability setups with the greatest risk to reward ratio. This will ensure that you become a long-term profitable professional trader.
Don't be a gambler. Don't try to get rich quick. Make sure that your trading is professionally based on proper strategies and trade tactics.

The Bear MarketHere’s my current view of the Bitcoin market:
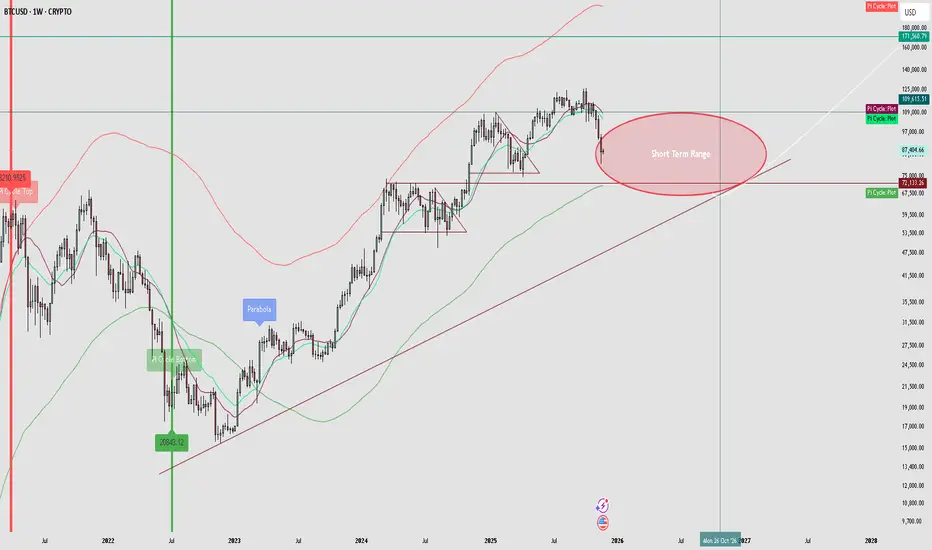
The 4-year cycle still appears intact, and many who doubt it seem to be in the denial phase. While some market dynamics have changed, the overall structure is still on track. Based on prior cycles, I expect a bear-market bottom to form roughly 324–340 days from now. Until then, I plan to avoid leverage and focus on accumulating during deeper pullbacks. I view Bitcoin around $68k as fair value, with prices above that currently leaning toward overvaluation.
I also disagree with the idea that the cycle can’t be over simply because “too many people are calling the top.” As Bitcoin matures and more cycles unfold, more traders naturally recognize recurring patterns. Increased awareness doesn’t invalidate the possibility that the top is already in.
Comparing this cycle to 2021 is also misleading. The previous double-top was heavily influenced by the pandemic, unprecedented Federal Reserve intervention, stimulus payments, and the surge of retail traders stuck at home. Those conditions don’t exist today. This cycle has been driven instead by regulatory clarity, institutional involvement, and growing governmental trust—resulting in a healthier, more sustainable rally.
Despite extreme fear in the market and widespread pessimism, I believe we still have downside ahead due to broader economic fragility. My current expectation is for a market bottom around October 2026, followed by a renewed parabolic move into the next bull market. I don’t expect Bitcoin to reach $1 million by 2030, though it may be possible someday.
BITCOIN : Where is the price floor (full analysis)Hello friends
Well, the fall in Bitcoin has really scared the market these days, and that's why we had a sharp fall, as it turned out.
Well, if we examine the past price, you will see that there has always been an upward trend and sometimes we have had price corrections, and this is completely normal.
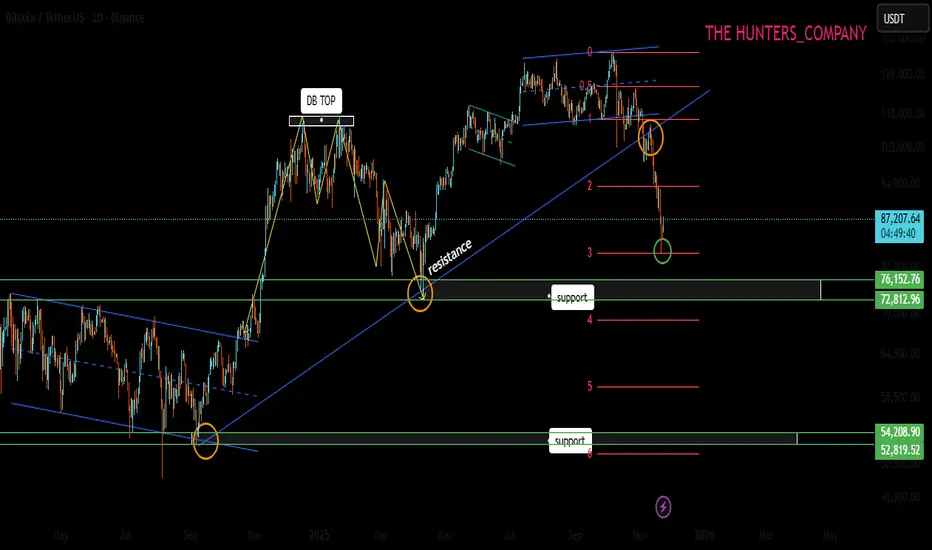
Before this drop, Bitcoin formed a double top pattern and the price corrected, and was again supported by the area indicated by buyers, and the price hit a higher ceiling.
But at the price ceiling, we witnessed weakness in buyers and, more importantly, a rounding of the price, which caused a heavy drop to 80,000. Now, after this sharp drop, the price is unlikely to go straight back up and make a new ceiling.
Now, after this strong spike by sellers, we can expect a descending range or channel.
What do we need to climb to?
Well, obviously the price needs to recover and buyers need to provide good support for the price, and first of all we see a range or channel, and then if they can break the channel or range, buyers can hope for a new ceiling. Otherwise, the price pivots we identified are the most important supports that the price can reach over time.
So, can we say that the rise is over?
No, nothing can be said with certainty. Maybe the price will bottom out at 70,000 to 80,000 and buyers will come in.
But in order to minimize the risk, we must move forward with the market and according to market behavior, not predict...
For this reason, it is not possible to say at this time that the price will go to a new ceiling from here because we do not see any buyers!!!
What is the solution?
Well, let's be logical: when the price goes down and Bitcoin becomes cheaper, better opportunities for buying are available to us, and we should take advantage of this situation and not enter the price ceiling emotionally and suffer losses.
Finally,
We need to see what the buyers' reaction is and if they want to support, then we can enter safely, not now that the Sharp price is falling.\
Be sure to observe risk capital management and do not get excited.
*Trade safely with us*
[WEEKLY] ANFIBO | Bitcoin BTCUSD - Downtrend? [11.24 - 11.28]Hi traders, Anfibo’s here!
BTCUSD – Technical Outlook
Overall Picture:
Last week, BITSTAMP:BTCUSD dipped into the 80,000 USD support zone, a key area that has previously acted as a structural demand region during corrective phases. The market reacted well, showing a notable bounce—though not yet strong enough to confirm a full trend reversal. Current price action remains in a broad corrective structure, and until BTC reclaims major broken levels, we treat all upward movements as retracements within a larger correction. The next week will be crucial, with clear opportunities both for strategic dip-buying and trend-continuation selling depending on how price behaves around major zones.
Weekly Trading Plan:
>>> BUY ZONE:
ENTRY: 83,000 – 85,000
SL: 80,000
TP: 96,000 → 98,000 → 102,000
(Looking to buy the retest of the previously broken structure around 98k. This is a classic “reclaim & retest” setup if momentum continues to recover.)
>>> SELL ZONE:
ENTRY: 98,000 - 102,000 (retest of breakdown)
SL: 106,000
TP: 87,000 → 80,000 → 77,000 → 72,000 → ...
(These levels align with the deeper correction targets. I will only execute these sells if BTC shows clear rejection signals, matching the purple-arrow projection.)
Risk Management:
Keep position size moderate until BTC confirms a clear trend direction.
Prioritize setups with clean invalidation points such as the 98k retest and the 76–71k demand range.
Avoid chasing price mid-range; trade only from well-defined boundaries.
Always secure partial profits once the market moves in your favor to reduce emotional pressure.
Conclusion:
BTC is showing signs of stabilizing after the bounce from 80k, but the market remains in a broad corrective phase. The plan for the upcoming week is straightforward: look to buy corrective pullbacks into the 98k retest, while also preparing to sell deeper breakdowns toward the 76–71k zone if bearish confirmation appears. Flexibility is essential—trade the chart, not the prediction.
HAVE A POWERFUL WEEK, GUYS!

BTC Market Structure UpdateBitcoin is currently trading near the 84,000 zone while respecting a downward trendline on the 15-minute chart. Price is moving inside a short-term compression range.
A clean break above the trendline and the 84,472 zone may indicate strength toward the next price areas around 85,154 and 85,554, where potential resistance levels exist.
However, if the price fails to hold above the mid-range and moves below 83,185, it may show weakness toward the lower support area.
This update highlights key structure levels so traders can observe how price reacts to each zone.

BTC in a bear marketBTC Price Outlook: Potential Decline Toward 85K
Bitcoin (BTC) is currently showing signs of potential weakness, with technical indicators suggesting a possible retracement toward the 85,000 level. This zone may act as a key support area if bearish momentum continues. Several factors contribute to this outlook:
- 📉 Momentum Shift: Recent price action indicates slowing bullish momentum, with lower highs forming on shorter timeframes.
- 📊 Volume Analysis: Declining volume during upward moves suggests a lack of strong buying interest, increasing the probability of a pullback.
- 🧠 Market Psychology: Traders could be locking in profits after the recent rally, leading to increased selling pressure.
If BTC approaches the 85K level, it will be crucial to monitor how price reacts—whether it finds support and consolidates, or breaks lower toward deeper retracement zones. Risk management and confirmation signals remain essential in navigating this setup.

BTC Next moveBTC gave a choch and bos / Trend line break conformation
market came without taking a supply from trend change area and there we can see FVG
so trend have to collect that FVG for continue sell trend
or break there structure for uptrend
📌 Please support me with your likes 🤞🏻 and comments 💬 to motivate me to share more analysis with you and share your any opinion about the possible trend of this chart with me !
Best Regards , Davis 🥰
Hit the like 🤞🏻 button to !! Motive some energy !!🥇
📌 Note :
⨻ Check the live market updates and analysis yourself before buy 📈🔺 or sell 📉🔻
⨺ Am not giving any advisory or signals its just my idea for upgrade my knowledge 📚 in trading
⨹ This is my pre and post market analysis to improve my trading journey 🚀
⨂ Am Not suggesting anyone to buy or sell ❌ am just giving my views 👀
⫸ You are responsible for your trading ✅ not me ❌ ⫷
HAPPY TRADING 🥰
Nov 21, 2025
Trade closed: target reached
bitcoin reach as expected on supply area around5000$ upside and down side gave target
HAPPY TRADING 🥰

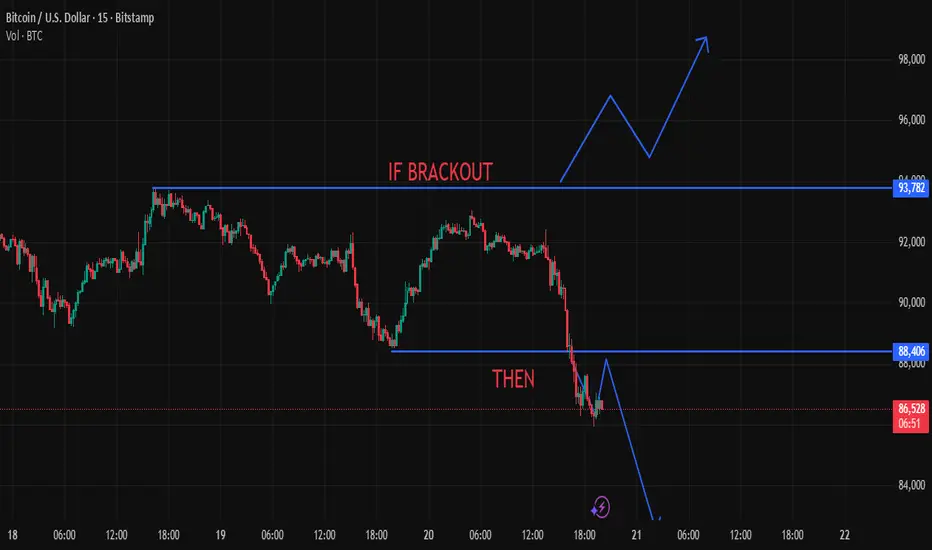
BTC Key Range Levels With Potential Price PathsDescription (TradingView-Friendly)
Bitcoin is currently trading between two important zones.
Price is reacting near the lower support area around 88,406, while the upper boundary near 93,782 remains the major resistance.
If the price moves above the upper zone with strong momentum, it could indicate a continuation toward higher levels.
If the market fails to reclaim support and moves downward, it may extend the decline toward the lower region highlighted on the chart.
This idea is for technical observation only and reflects possible scenarios based on structure and levels visible on the chart.
Strong Support Holding - BTCUSD Buy OpportunityHello Followers, I am going to share you my opinion on BTCUSD next move.
BTCUSD is currently respecting the 89,000-90,000 support zone, indicating strong buying interest. A breakout and hold above support zone presents a high-probability buying opportunity towards the next move targets. As long as price remains above support, bullish continuation toward targets 93,600 and then 96,000 remains likely. If BTCUSD break the support zone then protect downside risk with a stop loss at 87,500.
KEYPOINTS:
Entry-level 90600
Target Area 93600
Target Area 96000
Stop loss point 87500
Support area 89000/90000

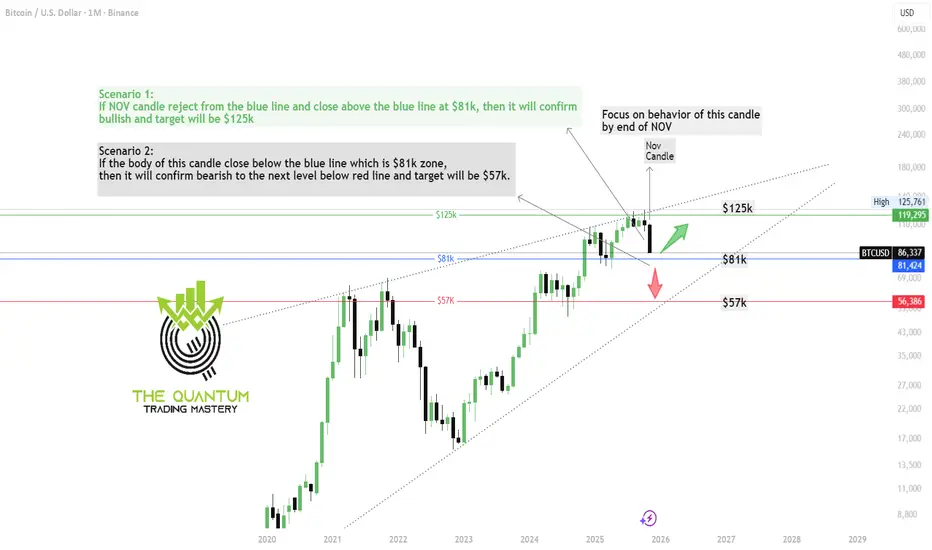
BTC Monthly Chart Technical AnaylsisDear Traders,
As expected from our previous weekly chart analysis, BTC has reached the $80K zone and has now successfully tapped $86K.
At this stage, the monthly candle is extremely important. I’ve shared the November candle—watch the closing carefully, because a major opportunity could be forming.
Trade smart, stay cautious, and if you find this update valuable, please show your support by boosting the post and dropping a comment.
The Quantum Trading Mastery
Bitcoin at a Historic Turning Point
This weekly chart just revealed something massive — something most traders completely miss until it’s too late.
Bitcoin has now dropped into one of the highest-probability demand zones of the entire macro structure:
📍 High Probability Zone: $74,420 – $88,800
Why does this zone matter?
Because this exact range is where Bitcoin previously:
✔️ Formed a major Higher Low (HL)
✔️ Generated the momentum that launched the last All-Time High ($126,296)
✔️ Swept liquidity at $74,420 — a textbook macro cleanup
✔️ Created the foundation of the entire bullish cycle
This isn’t just a “support level.”
This is where the market made its last major decision about the direction of the bull market.
⸻
The 3 Macro Scenarios (Clear, Simple, Realistic):
1️⃣ Bearish Continuation
If the current weekly candle closes below $85,980, sellers can attempt to push deeper into the zone — potentially retesting the sweep at $74,420.
2️⃣ Bullish Reversal
A strong weekly reaction from inside this demand block can form the next Higher Low (HL) on the monthly structure — the exact signal that created the previous ATH.
3️⃣ Range Formation
If volatility compresses here, BTC may build a macro accumulation range inside $74,420–$88,800 before choosing a direction.
And the winner — buyers or sellers — is revealed ONLY after a clean break of the range, not before.
⸻
🔍 Final Word
This zone is not noise — it’s a macro decision point where market structure, liquidity, and trend all converge.
Whether this becomes the beginning of a deeper correction or the birth of the next ATH…
This is where the story will be written.
NFA.
COINBASE:BTCUSD

$DXY $BTCHope all is well and wishing you a wonderful 2025 Holiday Season.
CRYPTOCAP:BTC & TVC:DXY
In recent news, Bitcoin and the Dollar are currently priced at $86,466 & $100.26.
I believe the Dollar will increase through 2026-2027, as the economy reflects current labor markets, deflation, and "risk-off" equities, as investors seek safe harbor during troubling times.
From the historical price action, you can see the Dollar gaining strength, as CRYPTOCAP:BTC falls relative to the Dollar demand.
Vice versa, as the Dollar weakens, risk profile turns on and price action increases for CRYPTOCAP:BTC and other speculative assets.
I'm estimating TVC:DXY to reach $110-$115 (Average $112.50), which can place CRYPTOCAP:BTC around $62,000-$46,000 (Average $54,000).
God Speed,
JR

BTC/USDTPERP BinanceBTC/USDTPERP Binance
1D hollows
As we saw in a previous chart, since the price broke the support point of approximately $108,000, a price drop of 12.58% followed in a period of three days.
An uptrend diagonal line has formed on the chart.
The price should have stayed above this uptrend line.
So since it broke downwards, the price should then touch the support level as seen from $87,470 - $91,781.
The support area results as an extension of the Fibonacci retracement, to the exact point of the golden ratio, which is 0.618 and 0.666.
The price is expected to reach the support area and we will see a price rebound.
Crypto Market Cap: $3.26T +1.61%(24h)
Bitcoin Dominance
Bitcoin: 58.7% -0.15%
Ethereum: 11.9% -0.97%
Others: 29.4% +1.13%
Good Luck
#CryptoHellas Team
16/11/2025
