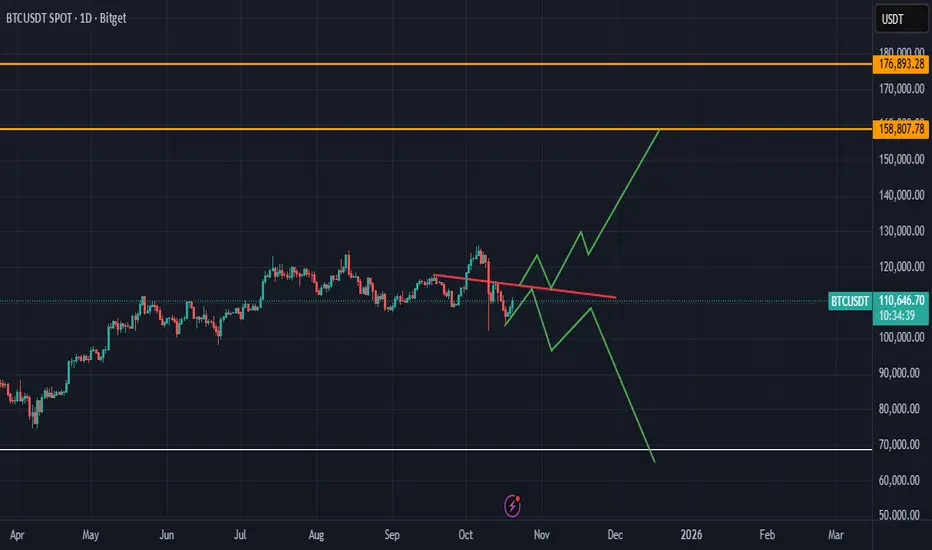
Bitcoin: Possible Scenarios on the Daily Chart🔴 Watch the red line!
If BTC breaks above — bulls take control.
If not — expect another drop.
Always manage your risk around reversal zones! 💥
#Bitcoin #BTC #Crypto #BTCUSD #CryptoTrading #TradingSetup #DailyChart #PriceAction
Btctrend
You will ask yourself "how did he know Btc would crash to 103K"?On Sept 23rd I suggested if Btc continues to follow this Eth fractal it would soon bottom at 102K (see chart below). Btc just crashed to 103K on Friday.
Fractals can act as maps for future price action. But they often deviate from the "expectation" at the worst time. I will follow this fractal until it stops working. Hope it has guided you well.
Between this Eth fractal (posted a month ago) and the "3 red week down rule" charts that I have been posting...it's safe to say we seen this week's (historic) dump coming . TA works!
I say this not to brag, but show the disbelievers that TA works (I encourage you to learn). And Also I keep track of my stats on my calls, to track my win ratios. You should too, how else would you know if it's worth following someone's predicitons.
May the trends to be with you.

BTC/USD – Bullish Reversal Setup from Key Support ZonePrice: $106,985
The market recently bounced from the lower channel line, showing that sellers may be losing momentum.
There’s a temporary consolidation near support — this could be a base for a reversal if buying pressure builds up.
⚙️ Technical Structure
Descending Channel: Shows a controlled downtrend — price respecting both upper and lower boundaries.
Support Zone: The green area marks a high-probability buying zone.
Target Point: Around $122,654 – $122,707, which aligns with previous resistance and upper channel breakout level.
📈 Bullish Scenario
If the price holds above $104,000 and breaks the channel resistance, we can expect:
First target: $114,000
Final target: $122,700
This move represents a strong bullish reversal potential.
📉 Bearish Scenario
If BTC breaks below $103,000, expect:
Next support: Around $101,500 – $102,000
It would confirm continuation of the downtrend within the channel.
🟢 Signal Summary
Direction Entry Zone Stop Loss Take Profit Confidence
BUY (Long) $104,000 – $106,000 $102,800 $122,700 ⭐⭐⭐⭐ (High if support holds)
⚠️ Conclusion
BTC/USD is at a critical support within a falling channel.
If the support holds, a strong bullish reversal toward the target zone ($122K) is likely.
But a break below $103K would invalidate this setup and resume the bearish trend.

You will ask yourself "how did he know Btc would do that?On Aug 9th I suggested that Btc could dump as low as 107,800. The actual low came within a small margin of that.
On Sept 2nd I suggested that the bottom was in and Btc would soon bounce to 1 of my 3 targets.
On Sept 11th, I also suggested that a lower low was probable (below 107K).
On Sept 17th, the top of the run was called and we saw the anticipated reversal.
I also anticipated the day (time frame), the reversal would occur.
TA works for both the X and Y axis (for both price and time).
I wrote "the bounce was coming to an end within 5 days". On day 6 Btc fell.
I honestly thought Btc would form it's lower low when I published the above charts. But instead we got that low probability pattern of a liquidity grab above the local high...THEN swipe the lows, to form a lower low afterwards. This pattern liquidated all the longs and the shorts, in what tunred out to be the biggest liquidation event in crypto history.
Either way, we got the anticipated lower low and we were spared a catastrophic dump..allowing us to be on the right side of the trade. It's safe to say this was not a surprise, but anticipated and therefore we profited.
TA works! Thank you "3 Red Week Down Rule". lol
Btw I have been suggesting (for weeks), that Btc would hit a lower low, based on the "3 Red Week Down Rule". While everyone on social media is blaming Friday's announcement on China tariffs, for cuasing this lower low.
'Show me the chart and I'll tell you the news"
-Bernard Baruch
Pattern's can be predictive! Learn them all.

From the Previous Warning to Today’s Move — Watch the Next LegThe prior BTC analysis aged well — we’ve had roughly 17% downside since that post.
This update maps the continuation: after a wave 2 correction, Bitcoin can resume a sharp selloff as wave 3. No fluff — just structure and Elliot
Previous analysis:
If this helps, save & follow for the next updates. (Not financial advice.)

Bitcoin Short-Term Update – October 17, 2025-The short trigger from yesterday has been triggered, and the market is currently moving in favor of the bearish scenario.
At this stage, the downside momentum remains strong, making it reasonable to keep short positions open, provided you manage your risk carefully and adjust stops appropriately.
-However, it’s important to remain prepared for a potential V-shaped reversal.
If such a pattern forms, it would signal a sudden shift in momentum, and we would need to flip our bias toward long positions.
-This is particularly relevant because our long-term trend is still bullish, meaning any corrective move could be temporary.
While the short-term setup favors sellers for now, flexibility and vigilance are crucial, as the market could quickly reverse.
For informational purposes only – not financial advice. © DIBAPRISM
Larry D.Kohn

Bitcoin Market Outlook – October 16, 2025-Today, there’s a strong possibility that Bitcoin may finally break out of its current consolidation range.
The market has been moving sideways for several sessions, showing signs of indecision among traders — but the current price action suggests that volatility could be returning soon.
-At the moment, all eyes are on the 110,400 support zone.
A confirmed breakdown below this level could provide an initial short opportunity, potentially opening the door for a deeper correction toward lower liquidity areas. Such a move would likely trigger stops and force weak hands out of the market, creating temporary downward momentum.
-However, if this breakdown turns out to be a fake move and the price quickly forms a V-shaped recovery pattern, it will be critical to shift the bias to long positions immediately.
That scenario would indicate a “risk-on” sentiment returning to the broader market, as liquidity and capital could start flowing back into Bitcoin — possibly marking the beginning of another bullish leg.
- In summary, today’s candle close around 110,400 is extremely decisive.
A clean breakdown confirms continuation of the correction, while a sharp rebound from this level could validate a strong reversal setup.
Either way, traders should stay alert, as this zone will likely define the next major directional move for Bitcoin.
For informational purposes only – not financial advice. © DIBAPRISM
Larry D.Kohn

BTC/USD Bearish Order Block Rejection Within Descending Channelhart Summary
Pair: BTC/USD
Timeframe: 30-minute
Trend: Bearish channel (clearly descending)
Setup Type: Bearish Order Block (OB) + Channel retest
🧭 Key Levels
Entry Point: around 112,764 – 112,793
Stop Loss: 114,058 – 114,065
Target Point: 105,001
Current Price: ≈111,627
📉 Technical Breakdown
Bearish Channel Formation:
Price has been moving within a well-defined descending channel, indicating sustained bearish momentum.
Order Block Zone (OB):
A bearish order block is marked at the top of the channel. Price is expected to retest this OB before continuation to the downside.
This aligns with typical smart money behavior — retracement into OB → sell-off continuation.
Structure Confirmation:
The structure shows a clear lower high formation setup, meaning sellers are likely to defend the 112.8–113.0 region.
Risk–Reward Ratio (RRR):
The setup provides a very strong RRR (around 1:6), which is excellent for swing/short-term trades.
Volume & Momentum:
While not shown on the chart, declining momentum during the pullback would further confirm this as a low-volume retracement before a sell continuation.
🧠 Trading Plan
Sell Limit: near 112.76 – 112.80
Stop Loss: 114.06
Take Profit: 105.00
Risk–Reward: ≈ 1:6.5
⚠️ Trade Notes
Wait for a bearish confirmation candle or rejection wick near the OB before entry.
If price breaks and closes above 114.1, invalidate the setup (structure break).
First partial profit zone could be around 108,500 before full target.
✅ Conclusion
The setup is bearish and well-structured, following smart money concepts with a clear OB and trend continuation expectation.
If BTC respects the OB zone, there’s a high probability of a drop toward 105,000 support.

Bitcoin Market Analysis – October 15, 2025🔸 Open interest is currently low, which means traders aren’t showing much interest in taking new positions for now.
🔻 Yesterday’s daily candle closed weak, failing to provide any solid confirmation for bullish continuation.
▫️At the moment, we’re starting to see early signs of a potential bearish scenario — technically speaking. However, from a fundamental perspective, there’s still a chance the market could shift back to a risk-on sentiment.
🔶 Bitcoin is now sitting on a very important support zone.
Right now, I’m waiting for a new structure to form before confirming any direction — whether it’s a deeper correction or a recovery move.
🔹 Summary:
As long as open interest stays low and no strong structure forms, the market remains in a waiting phase. The current support area will determine Bitcoin’s next major move.

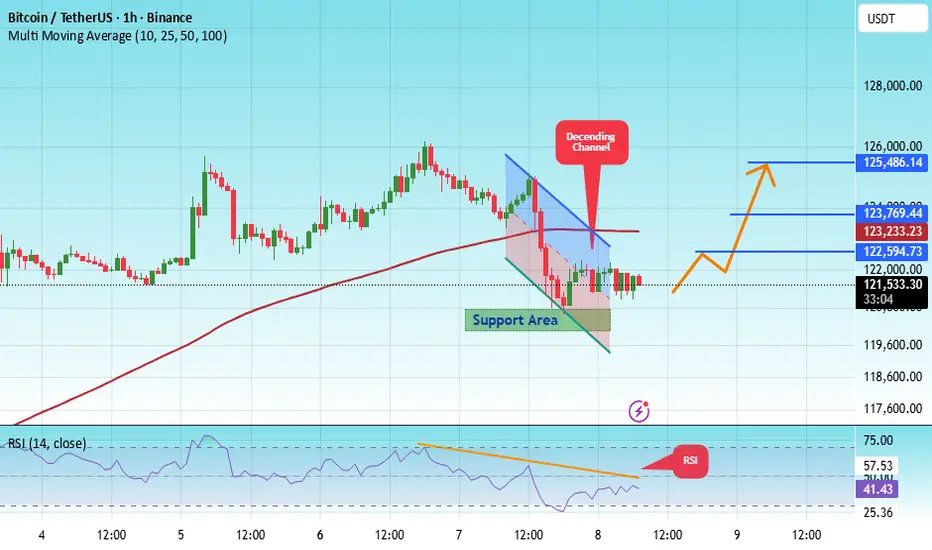
#BTC/USDT Bullish Momentum: Will It Break Through Resistance?
#BTC
The price is moving in a descending channel on the 1-hour frame and is expected to break and continue upward.
We have a trend to stabilize above the 100 moving average once again.
We have a downtrend on the RSI indicator that supports the upward move with a breakout.
We have a major support area in green that pushed the price higher at 109860.
Entry price: 112045.
First target: 113534.
Second target: 115471.
Third target: 117400.
To manage risk, don't forget stop loss and capital management.
When you reach the first target, save some profits and then change your stop order to an entry order.
For inquiries, please comment.
Thank you.

Bitcoin BTC Breaks Structure | Watching for Discount Entry LongBitcoin has experienced a fairly aggressive retracement recently, but we’re now starting to see bullish momentum returning and a clear shift in structure to the upside 🚀.
💡 My plan is to look for a retracement into the 50% equilibrium level of the current swing range — from low to high — as this could provide a potential discount entry zone for a long opportunity 🏹.
If price pulls back and respects that equilibrium level before breaking structure bullish again, it could set up a strong continuation trade. If not, we patiently step aside and wait for confirmation — discipline over impulse.
⚠️ Disclaimer: This content is for educational purposes only and not financial advice.

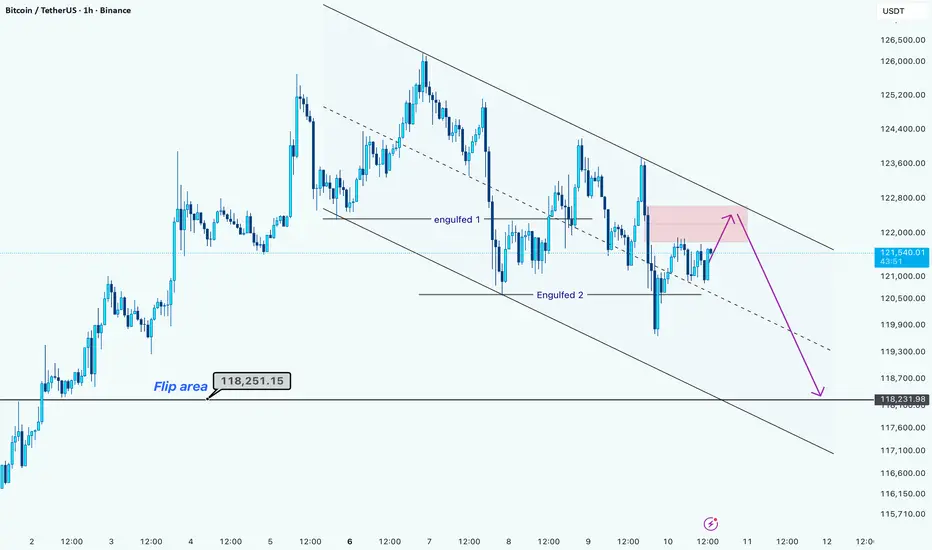
Bitcoin Facing Channel Resistance: Another Drop Ahead?Hello guys!
BTC is currently moving within a descending channel, showing consistent lower highs and lower lows, confirming a short-term bearish structure. The price continues to respect this channel, and until a clear breakout occurs, the downward bias remains intact.
Key Observations:
Two bearish engulfing (Engulfed 1 & Engulfed 2) have marked strong rejections from the upper boundary, reinforcing seller dominance at higher levels.
After the second engulfing, the price rebounded slightly, forming a minor pullback within the channel.
The upper boundary around $122,200–$122,500 is acting as dynamic resistance, aligning with the trendline.
Short-Term Expectation:
BTC could potentially push once more toward the upper boundary of the channel (around $122,200), where sellers may re-enter.
If the resistance holds, a continuation toward the $118,200–$118,300 support zone is expected, which aligns with the lower boundary of the channel and previous reaction levels.
Levels to Watch:
Resistance: $122,200 – $122,500
Support: $118,200 – $118,300
Breakout confirmation: A clean close above $122,500 could invalidate the bearish setup and open the way for a short-term bullish correction.
Bias: Bearish below $122,500
BTC ( Long ) or (Spot)BINANCE:BTCUSDT
LONG & SPOT
Entry 117 800
SL 115 000
T1 131 700
Extra Targets 137 000 & 160 000 are optional
Golden Advices.
********************
* Please calculate your losses before the entry.
* Do not enter any trade you find it not suitable for you.
* No FOMO - No Rush , it is a long journey.

BITCOIN SUPPORTHello friends
Well, as you can see, we have entered a correction and I have found important support areas for you, if buyers support the price in these areas, the price can move to the specified targets.
*Trade safely with us*

#BTC/USDT bounce from Support, Bullish Momentum Intact#BTC
The price is moving within a descending channel on the 1-hour frame, adhering well to it, and is heading for a strong breakout and retest.
We have a bearish trend on the RSI indicator that is about to be broken and retested, which supports the upward breakout.
There is a major support area in green at 120,500, which represents a strong support point.
We are heading for consolidation above the 100 moving average.
Entry price: 121,666.
First target: 122,600.
Second target: 123,770.
Third target: 125,480.
Don't forget a simple matter: capital management.
When you reach the first target, save some money and then change your stop-loss order to an entry order.
For inquiries, please leave a comment.
Thank you.
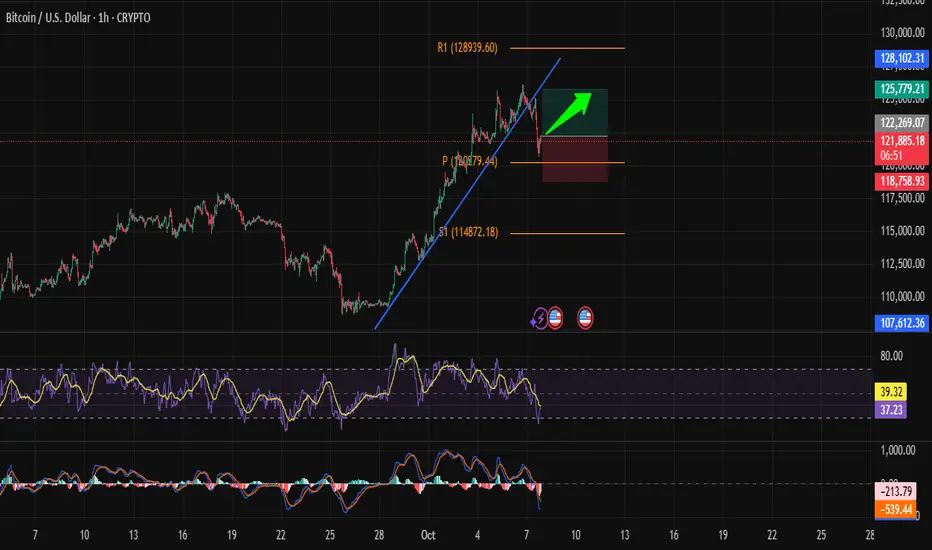
Bitcoin Ready for Its Next Bullish MoveHello traders, analyzing the BTC/USD 1h chart, we see a potential bullish opportunity:
- Entry: 121,962
- Take Profit (TP): 125,779
- Stop Loss (SL): 118,758
Bitcoin recently corrected after breaking an ascending trendline and is now approaching a key support area. The idea is to catch the next bounce toward the upper resistance zone.
Remember: patience, discipline, and proper risk management make the difference in trading.
⚠️ Disclaimer: This is not financial advice. For educational purposes only. Each trader should manage their own risk before entering a trade.
Bitcoin (BTC/USD)Bitcoin just broke a new all-time high 🚀
As shown in my pinned analysis, I marked the $111K level and mentioned that investors could also look for entries around $109K.
Today, you can see how that plan played out ✅
I’m not a fortune teller,
I don’t know what the whales are planning,
I don’t memorize Glassnode data —
My only tool is the chart 📊
I’m a swing trader —
Calm, stress-free, and patient.
Hope this analysis helped you too.
🎯 Stay profitable and trade safe.

ANFIBO | BTCUSD – Weekly Trading Plan [10.6 - 10.12.2025]Anfibo's here!
BTCUSD – Detailed Market Analysis & Outlook
It was great to see BITSTAMP:BTCUSD react strongly as I predicted last week, and I was absolutely right, BTC rallied from the $109,000 support to over $125,000 and set a new ATH. This strong move generated a profit of around $16,000 per BTC, reflecting the strength of the current bull cycle and the resilience of market demand. My family will definitely have a wonderful vacation thanks to that plan.
Market Outlook for the Week
Looking ahead, I anticipate the market may lean toward a period of healthy correction. Specifically, BTC could extend toward the $128,000 – $130,000 region before retracing to the nearest support zone between $118,000 and $116,000. Such a pullback would be constructive, allowing the market to reset before establishing a clearer direction or consolidating in a sideways range while awaiting new catalysts or macroeconomic developments.
Technical Perspective
On the H4 timeframe, BTC remains firmly within its ascending price channel, with no immediate signs of trend reversal. Momentum continues to favor the bulls, and as long as BTC maintains structure above key supports, the broader uptrend remains intact.
>>> SELL ZONE:
ENTRY: 128 - 130 (X1000)
SL: 132
TP: 118 - 116
>>> BUY ZONE:
(1) ENTRY: 117 - 118 (x1000)
SL: 115.8
TP: 123 - 128 - ATH
(2) ENRTY: 112.5 - 114 (x1000)
SL: 111
TP: 118 - 123 - 128 - ATH
Conclusion
BTC has successfully confirmed strength from the $109k base, pushing into new highs. While short-term corrections toward $118k–$116k would be considered healthy, the overall technical framework continues to support the bullish trajectory. Traders and investors alike should monitor key levels closely, maintaining flexibility while aligning with the prevailing trend.
WISH EVERYONE A PROFITABLE NEW WEEK!

BTCUSD – Bulls Strong but Overbought! | 4H AnalysisBitcoin (BTCUSD) has rallied sharply from $110K to $124K, gaining strong bullish momentum. Price is now trading well above the 20/50/100/200 SMAs, confirming the uptrend. However, RSI is entering the overbought zone, suggesting a possible short-term pullback before continuation.
🔹 Technicals
Trend: Strong Bullish (above all major SMAs)
Resistance: $124,500 – $126,000
Support: $122,500 (20 SMA), $120,000, $118,000
RSI: Near 70–75 → Overbought, slight bearish divergence
✅ Bullish Case:
If price sustains above $122,500 and breaks $126,000, we may see an extension toward $128,000 – $130,000.
⚠️ Bearish Case (Pullback):
Failure to break $126,000 could trigger a correction toward $120,000 – $118,000 before another leg higher.
📌 Trading Plan
Long Entry (dip-buy): $122,500 – $120,000
Target: $126,000 → $128,000 → $130,000
Stop Loss: Below $118,000
🔑 Summary
Bitcoin remains in a strong bullish trend, but the market is short-term overheated. Best opportunities are on dips or a confirmed breakout above $126K.

BTC (LONG)BINANCE:BTCUSDT
Entry range (111600- 113000)
SL 109977
T1 124 900
T2 131 600
Extra Target is optional 139000
_______________________________________________________
Golden Advices.
********************
* collect the coin slowly in the entry range.
* Please calculate your losses before the entry.
* Do not enter any trade you find it not suitable for you.
* No FOMO - No Rush , it is a long journey.

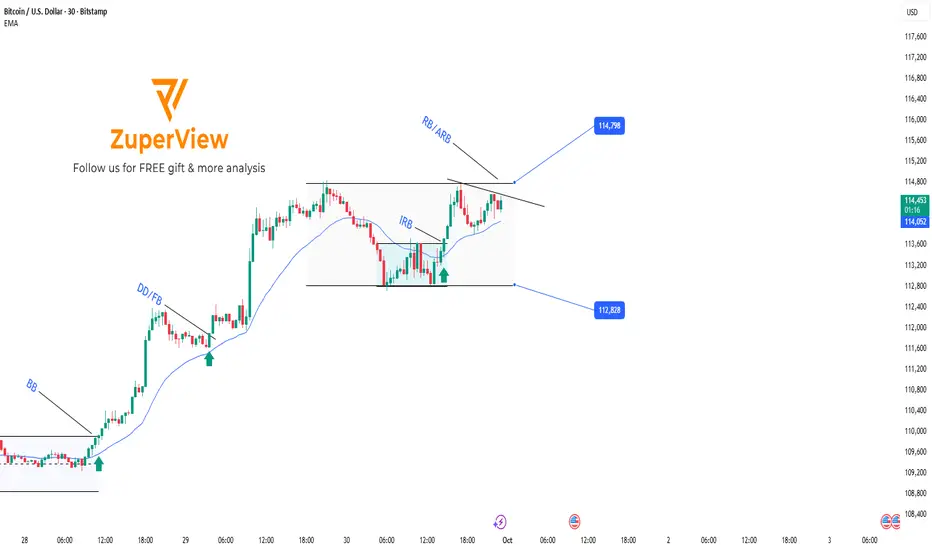
BTC breakout trading setupBITSTAMP:BTCUSD is currently consolidating within the 112,828–114,798 sideway range.
Earlier, the market broke out from a smaller accumulation inside the larger range, generating an IRB (Inside Range Break) signal, pushing price back toward the upper boundary.
Price is now forming a momentum consolidation, indicating potential for another breakout.
2 Possible Scenarios
1. RB (Range Break)
Price compresses further with EMA pressing tightly.
A strong breakout directly above the range top may occur with momentum.
2. ARB (Advance Range Break)
After breaking above the range, instead of continuing higher immediately, price may stall.
A new consolidation forms just above the broken range, with EMA pressing upward.
This setup may signal a continuation of the previous breakout move.
You can refer to my previous analysis here:
Please like and comment below to support our traders. Your reactions motivate us to do more analysis in the future 🙏✨
Daniel Miller @ ZuperView
ANFIBO | BTCUSD Analysis – Weekly Trading PlanHi guys! It's me, Anfibo. My plan last week gave us a good profit selling from 118,000 USD to 115,000 USD.
And over the past weekend, BITSTAMP:BTCUSD consolidated in a sideways range, consistently holding above key support. However, with the opening of the new week’s Daily candle, the market decisively broke down through this support zone, signaling that selling pressure is now taking clearer control.
From a technical perspective, the next critical support levels to monitor are:
• $113,000
• $111,000
• $109,500
Around the $110,000 region, I view this as a pivotal area to consider initiating spot entries or building larger long-term positions. This zone is not only a technically strong support level but also carries significant psychological weight for institutional and large-scale flows.
Imo, in the short term, BTC may still attempt a retest of the $115,000 level before resuming its downward trend, depending on lower-timeframe reactions. This creates an opportunity for traders to capitalize on corrective moves.
>>> My Trading Plan for the Week:
(1) SELL SCALP:
– ENTRY: around 115,000
– SL: 117,000
– TP1: 113,000
– TP2: 110,000
(2) BUY SETUP:
- ENTRY: 109,000 - 111,000
- SL: 107,000
- TP1: 117,500
- TP2: 122,000
- TP3: 128,000
This strategy is designed for short-term trades, taking advantage of volatility within the current range. For long-term investors, patience will be key—waiting for BTC to approach $110,000 or lower provides a strategic opportunity to restructure portfolios and scale into positions at more favorable prices.
👉 Conclusion: BITSTAMP:BTCUSD has broken out of its weekend consolidation and is now entering a fresh leg down. Short-term traders should look to sell corrective bounces, while long-term investors should focus on accumulation opportunities near $110,000 - a level that could serve as a “strategic entry” for the upcoming cycle.
WISH EVERYONE A NEW WEEK FULL OF ENERGY! ;)

#BTC/USDT Analysis — Pullback Before Bullish Continuation#BTC
The price is moving within a descending channel on the 4-hour frame, adhering well to it, and is heading for a strong breakout and retest.
We have a bearish trend on the RSI indicator that is about to be broken and retested, which supports the upward breakout.
There is a major support area in green at 111600, which represents a strong support point.
We are heading for consolidation above the 100 moving average.
Entry price: 111750.
First target: 112684.
Second target: 113672.
Third target: 115048.
Don't forget a simple matter: capital management.
When you reach the first target, save some money and then change your stop-loss order to an entry order.
For inquiries, please leave a comment.
Thank you.
