My view on BTCBitcoin has shown renewed strength in momentum after tapping into a strong support zone.
From a structural standpoint, price first printed a lower low, then followed with a higher low, which is a classic signal of improving momentum and potential trend reversal.
If price can break decisively above the 117,900 level with high volume, I think it opens the path for BTC to rally into the order block near the all-time high.
🎯 Conclusion: My outlook leans bullish — the shift from a lower low to a higher low highlights building momentum, and a break above 117,900 with strong volume would likely accelerate the move toward the upper order block. Still, markets are unpredictable, and this is only my view.
👉 For more structured market insights and professional analysis, follow along.
Btctrend

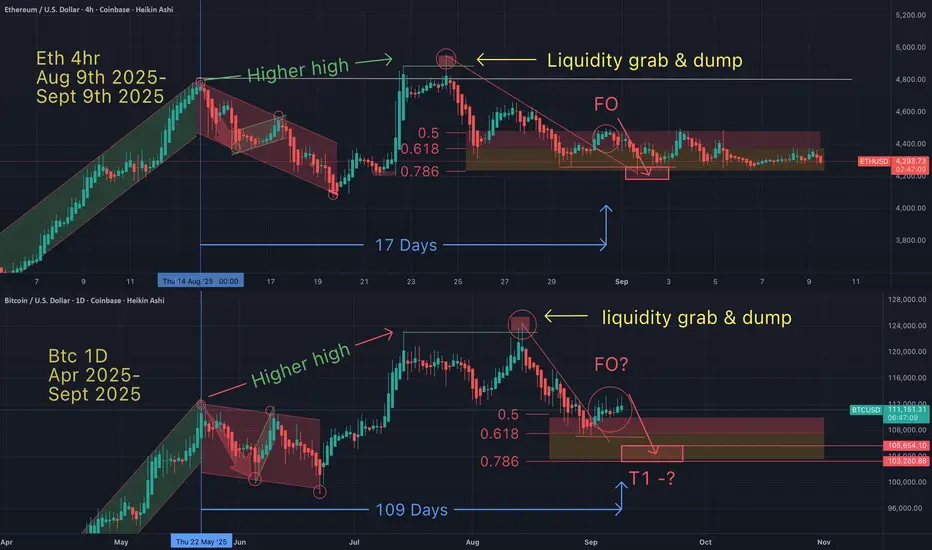
Is Btc STILL following this Eth Fractal? On Sept 9th I suggested Btc was following this Eth Fractal.
On Sept 12th I expressed concern for a lower low, and Btc seems to be heading lower now.
If Btc (on the 1 Day) is following this Eth (4 hr) fractal, then Btc may soon see a lower low (below 107). Alts may bleed harder.
I hope I'm wrong. But I am cautious for several reason, as also indicated in my other previously published charts.

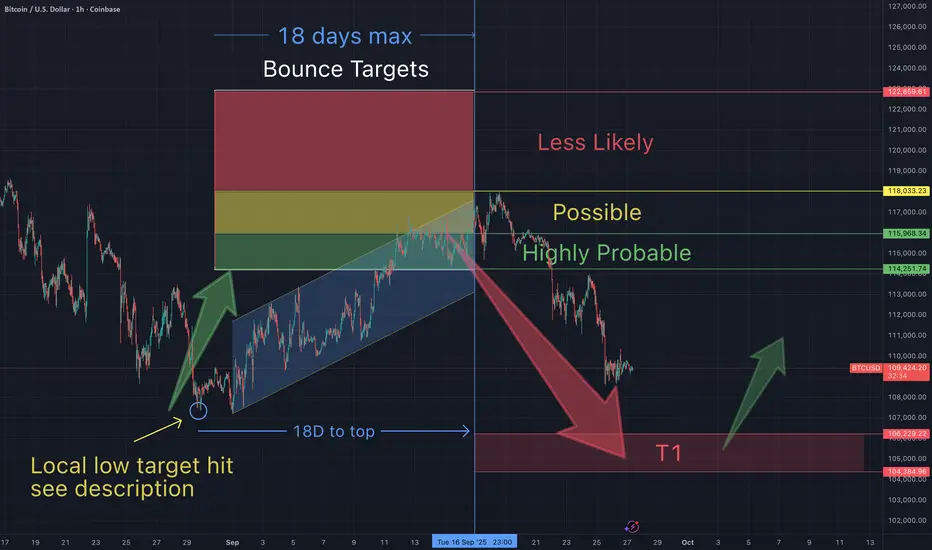
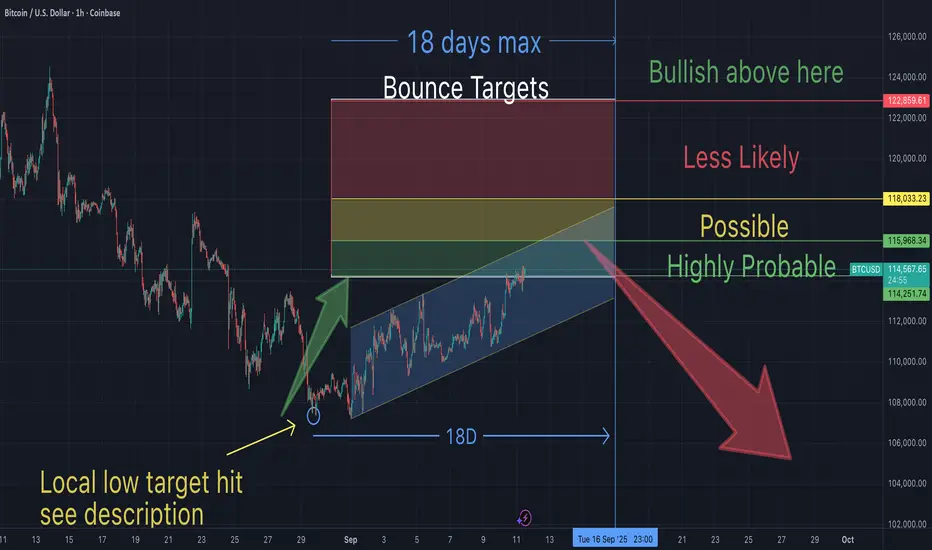
You will ask yourself, "how did he know Btc would do that"?On Aug 9th, I suggested Btc would bottom as low as 107,700, before a bounce.
On Sept 9th I suggested Btc had bottomed at my target, and would bounce to between $114K-118K (within 18 days)...the form a lower low. Day 19 began this current retrace.
Each of these predictions have come true with the exception of the lower low (below $107K). So congratulations to everyone who have been making gains based on my everything I have been charting.
The question remains, will the "3 red week down rule" and my statistical analysis of it's historical price action continue to play out? So far it looks that way. If so, there's another bounce incoming at my red T1.
PS I don't point out my accuracy to brag, but moreso I want to accomplish 2 things.
1-Prove that TA works - for all those non believers (and I encourage you to learn).
2-Keep track of my accuracy stats (and so should you...how else would we know who we should follow).
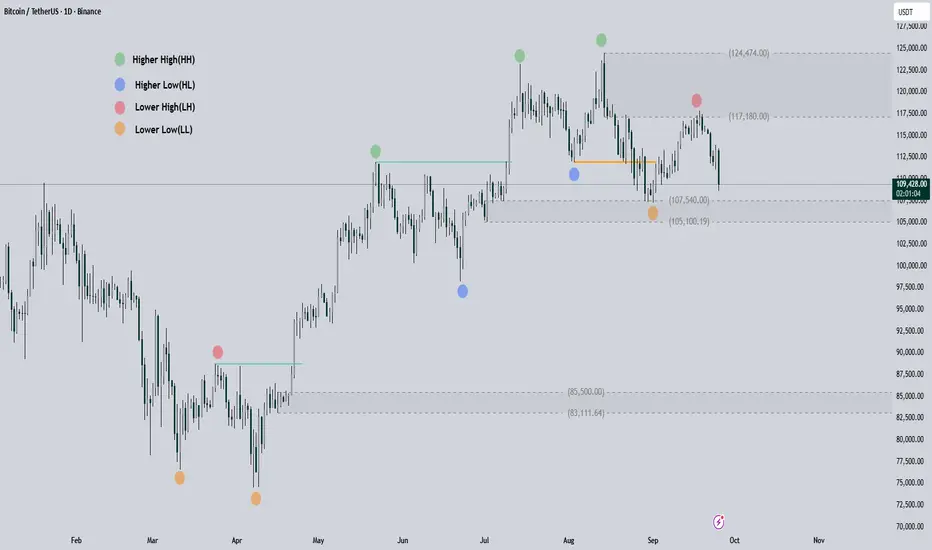
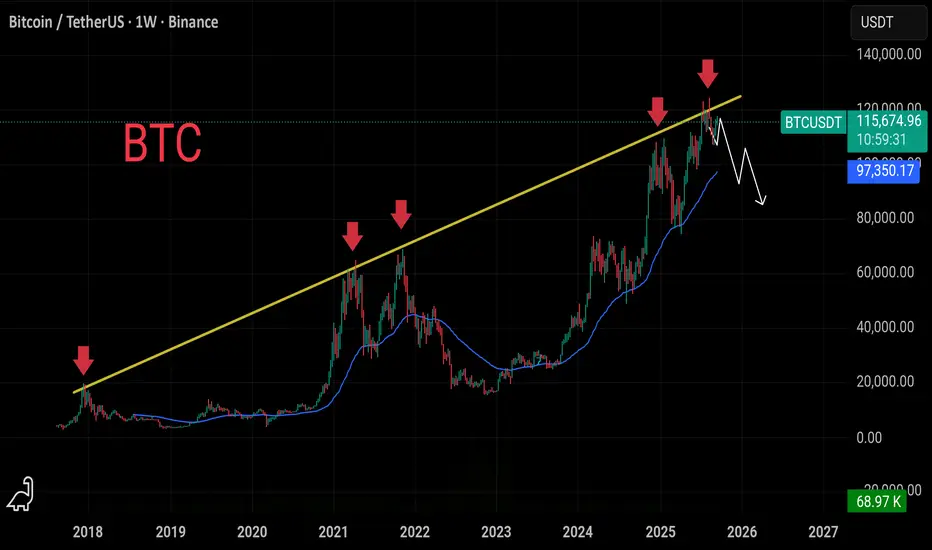
Bitcoin Price Analysis and PredictionIn my opinion, $124k was the highest price BINANCE:BTCUSD would see in this cycle, and the downtrend has started a long time ago.
The colored dots you see on the chart represent the main pivots of the weekly candles that were forming the bullish structure. Now we are seeing this structure being broken one after the other. You can see the key/legend for the colored dots on the chart.
Current Situation
Bitcoin broke the first weekly candle's Higher Low (HL) on August 22nd. Since then, we've seen a Lower Low (LL) and a Lower High (LH) on the weekly chart.
Now, the price is moving back towards that LL to break this LOW and form a new LL.
Last time, we saw good support at $107K and this area could be a support zone this time as well. However, the bearish structure has formed, and we will likely only face temporary reactions. In this area, we will either see the price range or a break of support and the start of a larger trend towards $85k.
Please note that this is just my opinion and it could be completely wrong. Even if it is correct, it might take a long time, or perhaps we'll move towards it with a sharp move!
BTC:ConsolidatingFor BTC, the short-term key support level isstill 111000, which is the starting point of the recent rebound. The strong support range is 105000–109000, while the strong resistance zone above remains at 115000. The overall trend is biased toward oscillating upward: if it breaks through the resistance level, it may accelerate its rise; if it falls below the key support, it may pull back.
At the same time, the approaching options expiration may intensify late-session volatility. It is recommended to gradually reduce leveraged positions after 16:00. Overall, Bitcoin's trend today will feature "oscillating to build a bottom and waiting for a breakthrough"—the competition between bulls and bears at key technical levels will determine the short-term direction. Investors should remain rational: they need to be alert to the potential pressure from the "September effect" while paying attention to the possibility of a rebound from oversold levels, and prioritize risk control when responding to market fluctuations.
Buy 111000 - 115000
TP 112000 - 112500 -113000
Daily-updated accurate signals are at your disposal. If you run into any problems while trading, these signals serve as a reliable reference—don’t hesitate to use them! I truly hope they bring you significant assistance

$BTC Crucial range!BTC attempted to break above the lower resistance zone and the descending channel, but failed to sustain momentum. ⚠️
📉 If rejection continues from this level, we could see a move towards the lower side of the channel, where multiple support zones await around:
$114,700
$112,000
$110,400
This will be a key area to watch for potential bounce setups or further breakdown confirmation.
🔎 Stay cautious — until BTC reclaims and holds above $116,700–117,300, downside pressure remains in control.

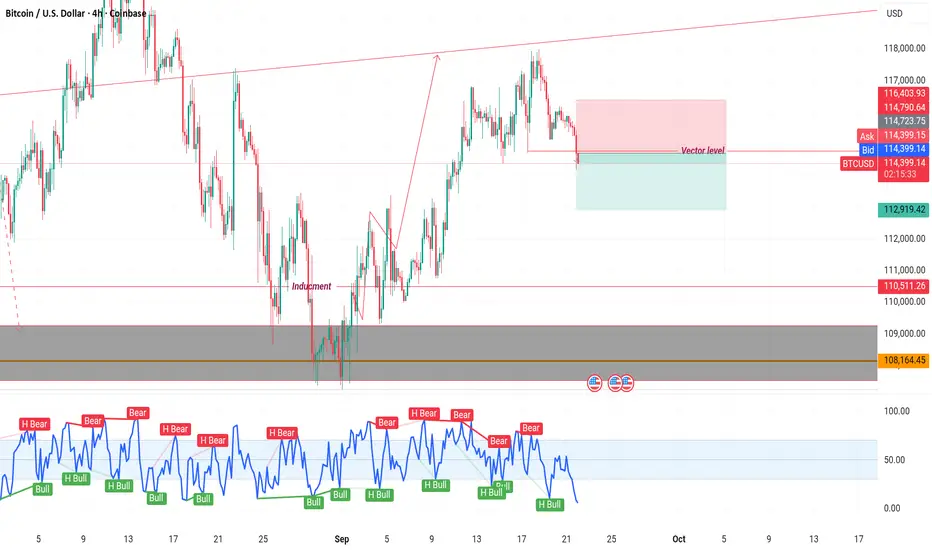
BTC on 4H timeframe
"As per the last analysis, BTC reached the $118,000 zone. In the 4-hour timeframe, the price has crossed a vector level, signaling a potential decline. I believe the first take profit target could be $113,000."
If you require further insights or have more details to discuss, please let me know!
ANFIBO | BTCUSD [update]Hello guys! It's me, Anfibo.
Here is my New Updated Strategy of BITSTAMP:BTCUSD
I agree with the view that BITSTAMP:BTCUSD is currently in a compression phase. The market seems to be waiting for a catalyst (potentially economic data or macro news) to break out of this consolidation zone.
>>> Key observations:
Trading volume has shown signs of decline over the past few sessions, reflecting investor sentiment of waiting on the sidelines rather than taking strong action.
Funding rates and overall market sentiment remain positive but not overly euphoric, which is a healthy signal supporting the case for a sustainable upward move.
On the Daily timeframe, the primary trend remains bullish, and the current sideways movement appears to be a technical correction within the broader uptrend.
>>> Strategic approach for today:
> For short-term traders: consider accumulating small positions around the support levels of 115,200 – 114,400, with stop-loss orders set below 114,000 to manage downside risk.
> For medium-term investors: it is more prudent to wait for a confirmed breakout above the 117,000 – 118,000 resistance zone before scaling into larger positions, targeting the 120,000 – 123,000 levels.
Have a beautiful weekend! :)

$BTC Sunday Update Nothing has changed, structure still intactCRYPTOCAP:BTC Sunday Update
Nothing has changed, structure still intact I’m still holding my short, staying patient for the lower targets ahead. If BTC makes a push into 120, 125K, that’s where I’ll load more. My downside map stays the same: 105K → 100K → 95K → 90K. Altcoin pumps look like nothing more than liquidity traps set by market makers before the real drop unfolds.
BTC Analysis — Long-Term Buy Zone AheadI'm watching $111,000 as a major buy zone on Bitcoin.
If price retraces to that level, I’ll be ready to enter a long position.
This is not a prediction — it’s a scenario.
Smart traders don’t guess, they prepare.
Let price come to your level. No chasing.
📍Set your alerts and stay patient.

#BTC/USDT - Are the bulls looking for a liquidity grab?#BTC
The price is moving within a descending channel on the 1-hour frame, adhering well to it, and is heading for a strong breakout and retest.
We have a bearish trend on the RSI indicator that is about to be broken and retested, which supports the upward move.
There is a major support area in green at 115,000, which represents a strong support point.
We are heading for consolidation above the 100 moving average.
Entry price: 115,600.
First target: 116,215.
Second target: 117,000.
Third target: 117,900.
Don't forget a simple matter: capital management.
When you reach the first target, save some money and then change your stop-loss order to an entry order.
For inquiries, please leave a comment.
Thank you.

ANFIBO | BTCUSD in my view todayHello guys! It's me, Anfibo.
Here is my Strategic and Market Sentiment Perspective :
I agree with the view that BITSTAMP:BTCUSD is currently in a compression phase. The market seems to be waiting for a catalyst (potentially economic data or macro news) to break out of this consolidation zone.
>>> Key observations:
Trading volume has shown signs of decline over the past few sessions, reflecting investor sentiment of waiting on the sidelines rather than taking strong action.
Funding rates and overall market sentiment remain positive but not overly euphoric, which is a healthy signal supporting the case for a sustainable upward move.
On the Daily timeframe, the primary trend remains bullish, and the current sideways movement appears to be a technical correction within the broader uptrend.
>>> Strategic approach for today:
> For short-term traders: consider accumulating small positions around the support levels of 115,200 – 114,400, with stop-loss orders set below 114,000 to manage downside risk.
> For medium-term investors: it is more prudent to wait for a confirmed breakout above the 117,000 – 118,000 resistance zone before scaling into larger positions, targeting the 120,000 – 123,000 levels.
Have a beautiful day!

You will ask yourself "how did he know Btc would do that"?On Aug 8th I suggested that based on my research of historical data, Btc would bottom as low as 107K. Btc bottomed at 107...and I then suggested a "bounce incoming".
On Sept 2nd I suggested that Btc had hit a bottom and was about to bounce into 1 of my three targets within 2 weeks. We are at the end of that 2 week period and T1 and T2 have been hit.
Question remains where do we go from here?
The 3 week down rule suggests that we form a lower low (below 107K). Will today's Fed meeting be the excuse for that pattern to play out?
What are your thoughts? I'd like to hear from you to gauge sentiment.

Will Bitcoin break new highs?Bitcoin has seen no major market moves. Overall, the ascending channel remains intact, and there seems little more to elaborate on. We maintain our previous view: exchange time for space.
Key Resistance: The $116,800 level has become the main battlefield for bulls and bears. If it breaks through strongly, the short-term target will look toward $118,000 or even $120,000.
Key Support: The $114,400 level is the first line of defense below; a break below this level may lead to a retracement to $113,200.
If you agree with my views, please give me a thumbs up. Thanks for your encouragement and support.

ANFIBO | BTCUSD on 09.17.2025 to 09.21.2025 I guess ???Hello guys, Anfibo's here! 👋
I think BITSTAMP:BTCUSD is bullish on the uptrend channel and still holding strong without any break. BTC may retest the support zone of $111.000 and re-reach the resistance levels of $123.000 and $127.000, and possibly up to $135.000.
Here's my setup:
✅ BUY SCALP: 110 - 111, SL 107, TP 122 - 126
❌ SELL SCALP: 126 - 128, SL 130, TP 120 - 114
Wishing my followers all the best <3

Can Bitcoin Still Rise to 120,000?The Bitcoin market is currently in a range-bound consolidation phase, with no clear overall trend breakout. Yesterday, the price once surged above the 116,000 mark, but failed to hold this position, and then quickly fell back into the oscillation range, forming a typical "false breakthrough" trend on the technical side. This phenomenon clearly indicates that the market still faces strong selling pressure at high levels, and bullish momentum to push prices upward is somewhat insufficient, making it difficult to break out of the volatile market in the short term.
From a macroeconomic perspective, the window for the Fed to cut interest rates is approaching, and the market is in the process of digesting policy expectations, which makes the current market more characterized by "accumulating strength and waiting" - both bulls and bears remain relatively cautious, and the game intensifies near key points, waiting for clear policy signals or capital flows to break the balance.
By observing the daily level pattern, it can be found that the market has recently shown a healthy volume structure of "large volume rise and small volume pullback". At the same time, the lower edge support of the rising channel formed in the early stage is still valid, the price pullback has not fallen below the key support level, and the overall upward trend framework has not been destroyed. Based on the above analysis, we still maintain the original strategy unchanged, continue to hold the existing long positions, and adhere to the operating idea of "trading time for space" - not being disturbed by short-term false breakthroughs or shock fluctuations, patiently waiting for the market to complete accumulation and clarify the direction, and then seize trend opportunities.

High-level fluctuations, BTC short-term trading arrangements#BTCUSD
After BTC started to rise from 113500, it continued to fluctuate and consolidate at a high level, and is also waiting for the specific basis point of the Federal Reserve's interest rate cut. In the short term, BTC is experiencing a retracement. Aggressive traders can consider trying to arrange long orders at 115500-115000. Once it falls below 115000, SL is carried out in time, with the target looking at 116500-117500.

Can Bitcoin break through 120,000?The Bitcoin market as a whole showed obvious "flat consolidation" characteristics over the weekend. Today's price maintained a narrow sideways fluctuation pattern, with an upper and lower range of only about 1,000 points. The bulls and bears played a moderate game in the current range, and there was no obvious directional competition. The market is temporarily in a state of accumulation.
However, from a technical perspective, after Bitcoin successfully broke through the key resistance level at the 4-hour level, it did not pull back. Instead, it showed a trend of "continuously rising lows" - that is, the low point of each pullback is higher than the previous low point. This pattern is a typical signal of a bullish trend, indicating that the overall bullish power in the market is gradually accumulating, the short-selling pressure continues to weaken, and the market direction has shifted to the bulls.
Based on this judgment, there is no need to adjust positions due to short-term sideways fluctuations. You should continue to firmly hold the long positions you have established and remain patient to "let profits fly for a while." The short-term sideways movement is more of a post-breakout accumulation phase. Once the market digests the current range, it is likely to continue its bullish trend, further opening up upside potential.
I'm Matthew, an analyst focused on technical analysis. If you have any questions regarding specific operations or trend judgments, feel free to communicate and discuss with me at any time. Let's learn trading logic together and move forward steadily in the market!

Is Btc STILL following this fractal?If Btc (on the 1 Day) is following this Eth (4 hr) fractal, then Btc may soon see a lower low.
I hope I'm wrong. But I am cautious for several reason, as also indicated in my other previously published charts.
Trade safe...

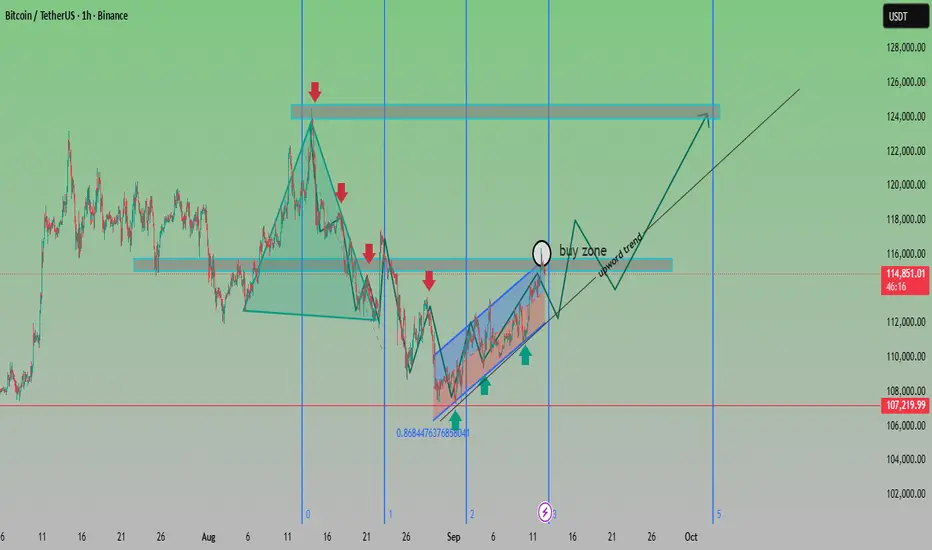
BTC Buy Zone Forming – Potential Bullish Breakout AheadAnalysis:
Trend Structure: After a corrective decline from the $124K resistance area, BTC has rebounded strongly, forming a rising channel (highlighted in blue).
Support Levels: Strong demand observed near $107,200, aligning with the 0.868 Fibonacci retracement, making it a crucial support zone.
Buy Zone: Chart highlights the $114K–$116K range as a buy zone before continuation of the upward trend.
Resistance Levels: Key resistance remains around $124K–$126K, which is the next major target if the bullish momentum sustains.
Outlook: As long as BTC stays above $114K support, the bias remains bullish, with a potential rally towards $120K–$124K. A breakdown below $112K would invalidate the bullish scenario.
✅ Bias: Bullish continuation
🎯 Targets: $120,000 → $124,000
🛑 Invalidation: Break below $112,000
CAUTION: Bitcoin may top within the next 1-5 daysOn Sept 2nd I suggested that Btc would see a bounce into 1 of my 3 targets. Btc has now entered the first zone. I am now cautiously on the look out for a reversal within the next 5 days (by Sept 16th). This expectation is based on my previous chart published where I stated "there is a possibility, based on the 3 week down rule, that the reversal from my targets, may lead to a lower low to my T3 (below current low at 107.5K).
My Aug 31st call for a T2 bounce hit perfectly. But I hope I'm wrong about a drop to T3
If Btc can hold support above 123K I will become very bullish. Until then I remain cautious, becuase I don't want to round-trip my gains. Proper risk management is crucial for me.
#BTC/USDT Bullish Divergence on 1H, Low Risk Trade#BTC
The price is moving within a descending channel on the 1-hour frame, adhering well to it, and is heading for a strong breakout and retest.
We have a bearish trend on the RSI indicator that is about to be broken and retested, which supports the upward breakout.
There is a major support area in green at 0.0, representing a strong support point.
For inquiries, please leave a comment.
We are in a consolidation trend above the 100 Moving Average.
Entry price: 112090
First target: 112177
Second target: 113111
Third target: 113963
Don't forget a simple matter: capital management.
When you reach the first target, save some money and then change your stop-loss order to an entry order.
For inquiries, please leave a comment.
Thank you.

Is the Btc 1D chart following an Eth 4 hr chart fractal?Is the Btc 1D chart following an Eth 4 hr chart fractal? Sure looks that way. This also adds confluence to the other Btc chart update I posted today, suggesting Btc would hit a lower low withing the next week. I hope I'm wrong for those of you that are long.