BTC-----Sell around 118100, target 116500 areaTechnical analysis of BTC contract on July 22:
Today, the large-cycle daily level closed with a small positive cross yesterday, and the price was below the moving average. The attached indicator was dead cross. The general trend is currently biased towards a downward trend. From the overall trend, we can see that the current trend is consistent and strong, but there is no room for rebound, and the continuous sluggish trend is also quite obvious, so the idea of selling down in the future market has become the main idea; the short-cycle hourly chart showed that the US market fell and rebounded yesterday, and the pressure continued to fall and broke down in the morning, and the correction high was near the 118000 area. The current K-line pattern is a single positive line. According to the trend rule, if the decline continues today, the rebound strength cannot be large, and the high point of the US market correction is resistance.
Today's BTC short-term contract trading strategy:
Sell at the current price of 118100, stop loss at 118500, and target 116500;
Btctrend

BTC-----Sell around 118300, target 116000 areaTechnical analysis of BTC contract on July 21:
Today, the large-cycle daily level closed with a small negative line yesterday, the K-line pattern continued to fall, the price was below the moving average, and the fast and slow lines of the attached indicator showed signs of a dead cross, and the overall trend has been in a sluggish state recently. The trend in the big trend also showed obvious signs of falling, so we have to pay attention to the strength and continuation of the retracement next; the short-cycle hourly chart price fell under pressure in the early morning, and the current K-line pattern continued to fall, the price was below the moving average, and the attached indicator was dead cross, so the price fell to the previous low of 115700 area. So you can sell after the pullback during the day, and pay attention to the breakout and strength and weakness trend of the European session.
Today's BTC short-term contract trading strategy:
Sell in the 118300 area, stop loss in the 118600 area, and target the 116000 area;

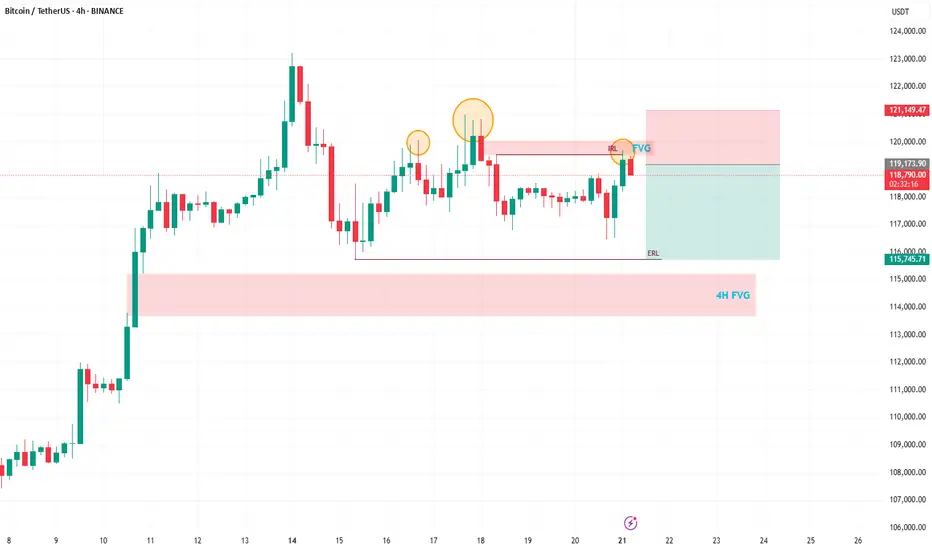
Bitcoin Trading Update: Consolidation, Patterns, and What's NextHey Fellow Traders! 👋
Bitcoin (BTC) has been on a wild ride after hitting its all-time high (ATH)! 📈 Since then, it’s been consolidating, generating liquidity, and setting the stage for the next big move. Meanwhile, altcoins are absolutely booming, stealing the spotlight! 💥 As we kick off the week, let’s dive into what’s happening with BTC and what to watch for.
📊 Technical Analysis Breakdown
Here’s what I’m seeing on the charts:
Head and Shoulders Pattern: A clear head and shoulders has formed on BTC, signaling a potential bearish move. 🐻
Daily Timeframe Order Blocks: These are in play, showing key levels of support and resistance.
Filled Fair Value Gap (FVG): A recent FVG on the daily chart has been filled, but there’s still a beautiful 4H FVG waiting to be tested below.
Liquidity Sweep: After the ATH, BTC needs to clear the liquidity from the past few days before it can push for new highs.
🔍 What’s Next for BTC?
I’m expecting a bearish reaction in the near term, with BTC targeting the sell-side liquidity around $115,800. This move should also fill the 4H FVG, setting the stage for a potential bounce and another shot at the ATH. 🚪 Keep an eye on these levels, as they’ll be critical for the next big move!
🔔 Stay in the Loop!
Let’s keep the conversation going! 💬 Follow for more updates, like if you found this helpful, and drop a comment with your thoughts or what you’re seeing in the markets. Are you trading BTC or riding the altcoin wave? Let’s hear it! 👇
Happy trading, and let’s make this week count! 💪
#Crypto #Bitcoin #Trading #TechnicalAnalysis
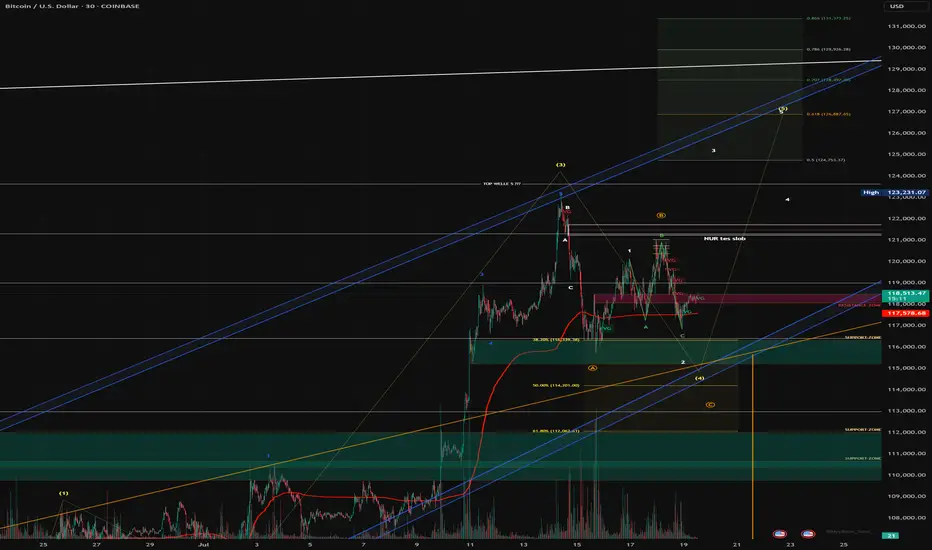
LAST BTC PUSH? Dear Community,
in order to expand my skills analysis, I will regularly share my analyses and ideas here on TradingView. I still consider myself a beginner in the “stock market” and “crypto” area and am therefore very much looking forward to your comments and input!
My primary assumption is that we are still in a final upward move. However, I am also pursuing alternative scenarios that could lead to significantly higher levels.
BTC analysis - 1H chart
In my analysis, wave (3) in yellow is complete and we are currently in wave (4) correction, which may not be complete yet.
My guess:
- Wave B (yellow) has been completed, wave C has extended and could still reach USD 113 679, where the Fibonacci 100 level is located. There is also an FVG in the 1H chart.
- A retest of the blue trend channel would be quite possible in order to pick up liquidity at this level before wave 5 (yellow) is completed between USD 126,887 and USD 130,000.
- My risk management is down to USD 107,326 (Fibonacci 1.866).
- We have already tested the Fibonacci 0.5 level (pullback level) and seen a positive reaction. However, we currently lack volume in the market.
- If the blue channel and the Fibonacci 100% level break, I have to assume an alternative count.
In this case, wave 4 would still have scope to reach the Fibonacci 61.8% level in the yellow box at USD 112,062.
If my current forecast does not materialize, I assume that we have already completed wave A and are in the correction to wave B, which will be followed by wave C - with a target of around USD 130,000 for the final impulse.
This scenario also fits in well with risk management up to the Fibonacci level of 1.866. There are also high liquidity areas (long) at this level, which are very attractive for market makers.
What do you think?
BTC 1H – Make or Break at SupportBitcoin has retraced into a previous demand zone after rejecting from local resistance. The 1H Stoch RSI is fully oversold, hinting at a potential bounce — but a clean break below $116K could send us down to the next base around $111K. Eyes on reaction here.

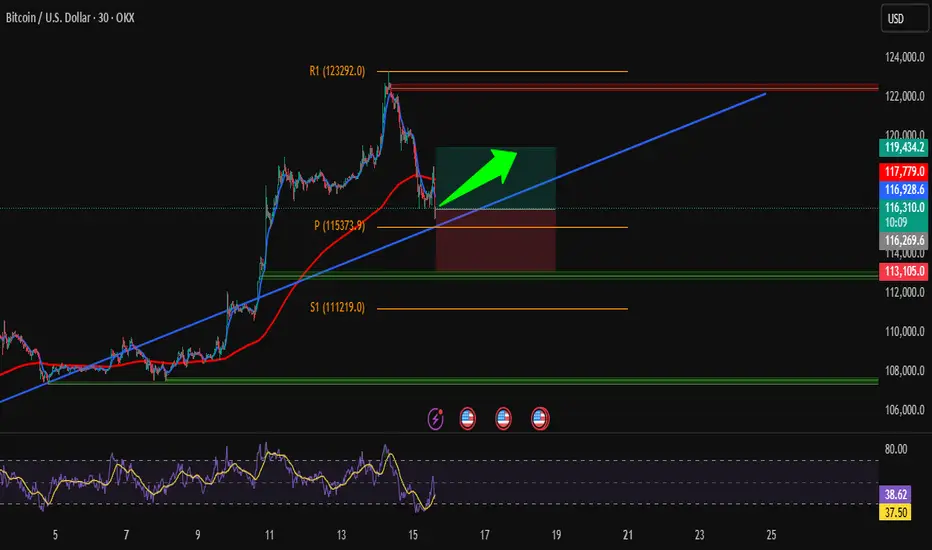
Clean BTC Trade – Bounce from Key Trendline SupportHi traders! , Analyzing BTC/USD on the 30-minute timeframe, we can observe that price is respecting the ascending channel and reacting to the dynamic trendline support (blue line). This bounce, aligned with prior structure, signals a potential bullish continuation.
🔹 Entry: 116,249
🔹 Take Profit (TP): 119,434
🔹 Stop Loss (SL): 113,105
Price remains above the 200 EMA while continuing to respect the ascending trendline, signaling sustained bullish structure. The RSI is showing a bullish divergence, which supports the idea of upward momentum. We also saw a strong reaction at the pivot point (115,373), and a bullish engulfing candle formed right near the trendline — adding further confirmation to this potential long setup.
This long setup presents a favorable risk/reward ratio within the context of the broader trend. Targeting a clean break above previous resistance and return to the R1 zone.
⚠️ DISCLAIMER: This is not financial advice. Trade at your own risk and always use proper risk management
BTCUSDTWait for breaked ATH for 115K target.
BINANCE:BTCUSDT.P
Now price is in two level trading renge but come entry volume of buyers.

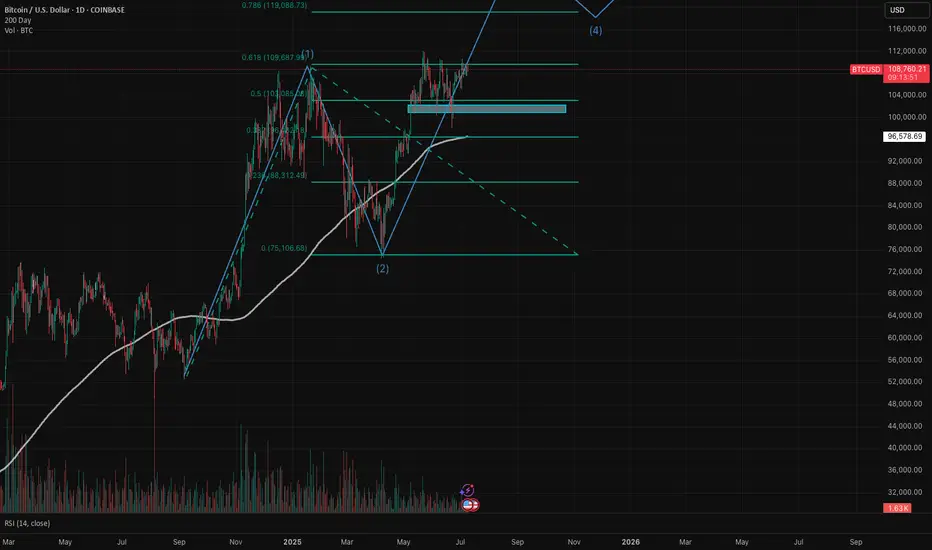
Bitcoin (BTC/USD) is currently in wave 3 of a 5 (Elliott Wave)BTC/USD experienced a halving last year on April 20, 2024. We have been seeing the typical post-halving cycle with exponential upside, followed by deep pullbacks. The price action we've seen to date follow Elliott Wave Cycle quite nicely. I believe we are in wave 3 of a bull cycle that has really been in place since Sep 2024.
- Wave 1: Sep 2024 - Jan 2025 - parabolic upside from $54K to $109K - absolutely explosive!
- Wave 2: Jan 2025 - Apr 2025 - we saw price peak and pull back all the way to the 61.8% Fibonacci level right around $75K. Remember, that in wave 2, a healthy pullback is 50% - 61.8% of the first wave.
- Wave 3: Apr 2025 - we have since rallied to around $109K as of this analysis. We are likely in subwave 3. Subwave 1 was from the low in April to the high in May (around $112K). Subwave 2 was a very nice 3-wave zig zag (reaching low of $98.3K in June). I believe we are currently in the middle of wave 3.
My next price target based on Fibonacci extension is $118K-$120K with the $78.6% level right at $119K. Note current resistance that we need to turn into support ($109.7K level) is the 61.8% Fibonacci extension level. I do expect a meaningful pullback after the peak of wave 3, which would be wave 4. The rest is TBD and I will continue to update this idea.
Remember, Elliott Wave theory is one tool in the toolbox. I do believe there is a larger post-halving cycle narrative that is dominant and most reliable, especially since BTC has largely followed this blueprint that we see every four years, but as of now EWT fits in quite nicely. I also look at the pi cycle top indicator and believe we need to use multiple indicators to understand where we are in the cycle.
BTC Leg2 115KBINANCE:BTCUSDT major movement from base 98K S to 106K $.BTC want to next movement to 115K $ but in middle of way 110K $ level there are sellers.
Support: 106.000 - 102.000
Resistance: 110.400 - 115.000
⚠️Control Risk Management

BTC Correction's 📉 Significant Bitcoin Correction During Uptrend
After a strong bullish rally, Bitcoin has entered a correction phase, retracing nearly 25% of its recent gains. Interestingly, this correction aligns exactly with the 200-period moving average on the 4-hour chart, marking a potential key support level.
🔍 Is Bitcoin’s Correction Over or Just Beginning?
The overlap with the 200 MA could signal the end of the correction, but if this zone fails to hold, deeper targets between the 35% and 75% retracement levels may come into play.
🛡️ Potential Support Levels for Bitcoin if the Correction Continues:
First support: 102,200 USD – 25% correction
Second support: 93,200 USD – 35% correction
Third support: 84,100 USD – 50% correction
Fourth support: 74,600 USD – 75% correction

Bitcoin on Fire: Targeting $110K in Relentless Uptrend!Hi traders! , Analyzing BTC/USD on the 30 minute timeframe, price is currently respecting an upward channel and showing consistent higher highs and higher lows. The recent bounce from dynamic support suggests bullish continuation.
🔹 Entry: 109,545
🔹 Take Profit (TP): 110,612
🔹 Stop Loss (SL): 108,438
Price is trading above both the 50 and 200 EMA, confirming bullish momentum. The RSI remains above the midline, indicating buyers are still in control. This long setup offers a favorable risk-reward ratio within the context of the broader uptrend.
A confirmed breakout from the short-term resistance, combined with trendline support and channel structure, adds confluence to this idea. Watch for potential resistance near the 110,612 zone.
⚠️ DISCLAIMER: This is not financial advice. Every trader is responsible for their own decisions and risk management.

BTCUSDT – Accumulation Confirmed? Wyckoff Blueprint Playing Out Bitcoin continues to compress inside a defined range, resting above both a rising trendline and a former resistance turned support zone. This structure fits cleanly within a Wyckoff-style Accumulation Phase (B-C).
We’re now at a critical moment where smart money may be absorbing supply, preparing for the next phase.
🔍 Key Observations:
Range-bound price action with higher lows and muted volume
Spring-like wick and recovery from the bottom of the range
Support holding at prior breakout zone and ascending trendline
Structure shows signs of stealth accumulation with a possible breakout ahead
Sideways movement with fading volatility
Gradual compression within the range
Strong support defended multiple times (might make the support weaker as well !)
A potential spring/retest event may already be in play
You’ll see fakeouts, wicks, and hesitation in this phase — designed to trap weak hands. But the underlying behavior points to preparation, not distribution.
The quiet before the markup. Let the market reveal its hand. 📈

BTC SCALP Tradeas long as BTC doesn't closes below the mentioned area on 1hr tf, it will bounce and hit the fresh sellers SL. Once we have a closing below the area it can take correction upto 98-97K area.

BTC shorting opportunity comes againBTC climbed above 108000 again, and the short-term bullish power was slightly stronger. According to the current strength, BTC still has room for growth, but it is still under pressure in the 109000-110000 area in the short term; if there is no major positive news, BTC may find it difficult to break through the resistance area in the short term under the current conditions, and may even experience stagflation and retreat again after approaching the resistance area.
Therefore, I think shorting BTC with the help of the resistance area is still the first choice for short-term trading. We can boldly short BTC in the 108500-109500 area and look towards the target area around 106000 again.

BTCUSD Trade Setup Idea on 1D Timeframe - Bullish MomentumBitcoin (BTCUSD) is currently trading at $109,348, showing strong bullish momentum on the 1H chart. The recent breakout from consolidation signals potential continuation, provided key resistance levels are breached and held.
Must Consider Analysis Timeframe : 1Day.
Strictly follow the trading rules for Entry..... only on Retracement.
SL on Previous or Close swing low.
🔍 Key Levels to Watch:
Bullish Continuation Confirmation: If price sustains above 112,150, we expect bullish momentum to accelerate.
Target 1 (TP1): 112,150 – Key breakout level that may act as support once reclaimed.
Target 2 (TP2 - Major): 121,128 – Long-term resistance and major profit-taking zone.
📊 Trade Logic:
A confirmed breakout and hold above 112,150 indicates strong buyer interest and could drive price toward 116,572 and 121,128.
The trend remains bullish as long as price holds above the breakout structure.
REMEMBER:- RESPECT THE LEVELS, LELEVLS RESPECT YOU THEN.
💡 Strategy: Monitor for retests and bullish candle confirmations above 112,150 to add or enter long positions with proper risk management.
! Disclaimer & Important Note:
This analysis is for educational and informational purposes only. It does not constitute financial advice or a recommendation to buy or sell any financial instrument. All trading involves risk. We are not responsible for any kind of loss incurred, whether financial, emotional, or otherwise. Always do your own research and consult with a licensed financial advisor before making any trading decisions.
Trading involves significant risk, and you should never invest more than you can afford to lose. Past performance is not indicative of future results.
The trade idea shared above reflects personal market interpretation and is subject to change based on new market conditions.
Posted by: THEPATELCRYPTO, 45Degree
Stay safe. Trade smart.
Follow for more ideas!
📍Posted by: THEPATELCRYPTO, 45Degree
📈 Stay safe. Trade smart.
🔔 Follow for more ideas!

Short BTC, it is about to retrace and test 100000 again!As BTC gradually fell back, the rebound did not stand above 110,000 in the short term, proving that there is strong selling pressure above, and the trend line formed by the technical high point 111,000 and the second high point 110,000 formed an important resistance area, which limited the rebound space of BTC and strengthened the demand for BTC's short-term retracement.
According to the current trend, the short-term oscillation bottom area of 106,000 may be broken at any time. Once it falls below the oscillation area, it may arouse a certain degree of profit-taking chips and stimulate BTC to accelerate its decline. I think BTC will at least test the 105,000-104,000 area again during the retracement, and may even test the 100,000 integer mark again.
Therefore, shorting BTC is still the preferred option for current short-term trading.
Consider shorting BTC in the 108,000-109,000 area, and the target area in the short term is 104,500-103,500. After breaking this area, the target can be extended to 101,000-100,000.
BINANCE:BTCUSDT BINANCE:BTCUSDT BITSTAMP:BTCUSD

BITCOIN - Price can continue grow inside flat to $107933 level#BTC
The price is moving within a descending channel on the 1-hour frame and is expected to break and continue upward.
We have a trend to stabilize above the 100 moving average once again.
We have a downtrend on the RSI indicator that supports the upward move with a breakout.
We have a support area at the lower boundary of the channel at 106500, acting as strong support from which the price can rebound.
We have a major support area in green that pushed the price upward at 106000.
Entry price: 106736
First target: 106996
Second target: 107434
Third target: 107933
To manage risk, don't forget stop loss and capital management.
When you reach the first target, save some profits and then change your stop order to an entry order.
For inquiries, please comment.
Thank you.

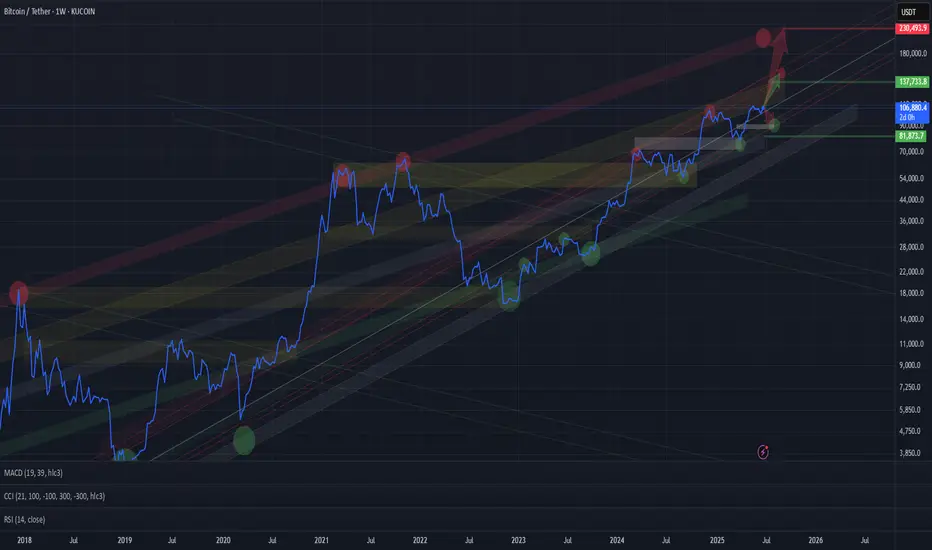
BTC BTC/USDT LONG_TERMChannels are drawn, long-term targets are clear. The upper extreme visible so far is around $200K for Bitcoin — possible within this cycle.
More realistic targets for this cycle are around $135K.
In the short term, a correction to the lower red channel zone ($88K–94K) is possible.
Watching closely.
#BTC/UST#BTC
The price is moving within a descending channel on the 1-hour frame, adhering well to it, and is on its way to breaking it strongly upwards and retesting it.
We are seeing a rebound from the lower boundary of the descending channel, which is support at 106,000.
We have a downtrend on the RSI indicator that is about to break and retest, supporting the upward trend.
We are looking for stability above the 100 moving average.
Entry price: 106,600
First target: 106,750
Second target: 107,000
Third target: 107,291

Setup: Entry at $108,658 with Target at $98,815 and Stop Loss at1. Entry Point: 108,658
This is where the trader expects to enter a short position.
Price is projected to reverse near this level.
2. Stop Loss: 110,341
Located above the entry point.
If price hits this level, the short trade is invalidated, limiting losses.
3. Target (Take Profit): 98,815
This is the EA Target Point, about 9,714 points (~8.94%) below the entry.
Represents a favorable risk-reward ratio.
---
🔄 Trade Idea Summary
Trade Type: Short (Sell)
Risk: ~1,683 points (110,341 - 108,658)
Reward: ~9,843 points (108,658 - 98,815)
Risk-Reward Ratio: ~1:5.85 (which is strong)
---
📊 Technical Indicators in Use
Moving Averages:
Likely 50-period (red) and 200-period (blue) MAs.
The 50 MA is below the price, indicating short-term bullishness.
However, the trade idea goes against this short-term trend, suggesting a reversal strategy.
---
🔍 Interpretation & Strategy
This chart implies the trader expects resistance near 108,658, possibly due to historical highs or supply zones.
The bearish outlook expects a significant drop to 98,815, possibly supported by macro patterns (like head & shoulders, or bearish divergence—not shown here but could be inferred).
The purple zones highlight high-probability reversal or reaction areas (support/resistance zones).
---
⚠️ Things to Watch
Invalidation: If price closes above 110,341 on a 4H/1D chart, the trade setup fails.
Confirmation: A strong bearish candlestick at or near the entry zone would strengthen the case.
Market Context: News, economic data, or BTC ETF inflows/outflows can quickly invalidate technical setups.

$BTC Update CRYPTOCAP:BTC #BTC $106,586 resistance in effect and testing as of now, $104,987 current support. $103,093 key support from here, $107,461 support required to reattempt taking $110,423. Dropping volume on 1D, Previous daily closed trying to follow thru on a bullish engulfing from Monday's close, current 1W looking massive good but it's just the beginning of the week - Watch given S/R.

Is Bitcoin Signaling Risk-Off? Structure Breakdown Explained💥 BTC/USD Outlook – Is Bitcoin Losing Steam? 🧠📉
I'm keeping a close watch on Bitcoin (BTC/USD) this week, and the current price action is flashing some key signals.
🔍 Over the past several sessions, BTC has struggled to hold momentum, and we’re now seeing a shift in tone. On the 4-hour timeframe, the market structure is tilting bearish, with a pattern of lower highs and lower lows developing — a classic sign of weakness ⚠️📉.
📐 The most recent downside leg has caused a clear break in structure, and BTC is now retracing back into a potential supply zone, hovering around equilibrium of the recent move. This zone will be critical to watch for signs of seller re-entry.
⏳ On the 30-minute chart, I’m waiting for a decisive shift in structure — a break of local support or a failed rally that confirms bearish continuation. Should that play out, it could signal a high-probability short setup.
🪙 A breakdown in BTC often has broader implications — especially in the risk asset space. If we see weakness here, JPY pairs may strengthen as capital rotates into safer assets 💴🌐.
⚠️ Disclaimer:
This is not financial advice. The information provided is for educational purposes only. Please conduct your own analysis and consult a licensed professional before making any investment decisions. 📚💼

Bitcoin / U.S. Dollar 4-Hour Chart (BTCUSD)4-hour candlestick chart displays the price movement of Bitcoin (BTC) against the U.S. Dollar (USD) as of June 23, 2025, 03:45 PM CEST. The chart shows a recent sharp decline from a peak of approximately 104,443.81 USD to around 100,479.47 USD, with a current price of 102,035.20 USD, reflecting a 1.037.09% increase. Key levels include resistance around 104,000 USD and support near 100,000 USD, with notable volatility indicated by the candlestick patterns and a marked low point adorned with U.S. flags and a lightning bolt symbol.
