Selena | BTCUSD · 30M – Ascending Channel | Range Expansion BITSTAMP:BTCUSD BINANCE:BTCUSD
After a strong impulsive move from the sell-side liquidity sweep near the lows, BTC formed a controlled range between demand and supply. Current price action shows compression inside the range, suggesting an upcoming expansion either through a bullish continuation or a deeper liquidity grab before the next move.
Key Scenarios
✅ Bullish Case 🚀 →
• Hold above channel support + demand
• 🎯 Target 1: 72,800
• 🎯 Target 2: 74,500
❌ Bearish Case 📉 →
• Breakdown below 67,800 range low
• 🎯 Downside Target 1: 64,000
• 🎯 Downside Target 2: 60,000
Current Levels to Watch
Resistance 🔴: 71,800 – 73,200
Support 🟢: 68,200 → 67,800
⚠️ Disclaimer: This analysis is for educational purposes only. It is not financial advice.
Btctry

Selena | BTCUSD – 1D | Major Structure Breakdown & Recovery BITSTAMP:BTCUSD BITSTAMP:BTCUSD
After months of trending higher inside a rising channel, BTC lost structural support and rejected from the upper range near 126,000. Price formed a distribution range around 90,000–95,000, which ultimately broke down aggressively. The sharp sell-off suggests panic/liquidity release, with price now reacting from a strong historical demand area. Any upside from here should be treated as corrective until structure is reclaimed.
Key Scenarios
✅ Bullish Recovery (Corrective) 🚀
Strong hold above 50,000–52,000
Short-term recovery targets:
🎯 75,000
🎯 90,000–96,000 (previous supply / breakdown zone)
Current Levels to Watch
Resistance 🔴: 90,000 – 96,000
Support 🟢: 52,000 → 48,000
⚠️ Disclaimer: This analysis is for educational purposes only. It is not financial advice

BitcoinBTCUSD
- Bearish Channel as an corrective pattern in Short Time Frame
- Fair Value Gap
- Order Block
- Support Level
- RSI - Divergence

#BTC/USDT Let Bitcoin make a new ATH#BTC
The price is moving within a descending channel on the hourly timeframe. It has reached the lower boundary and is heading towards a breakout, with a retest of the upper boundary expected.
The Relative Strength Index (RSI) is showing a downward trend, approaching the lower boundary, and an upward bounce is anticipated.
There is a key support zone in green at 75,000, and the price has bounced from this level several times. Another bounce is expected.
The RSI is showing a trend towards consolidation above the 100-period moving average, which we are approaching, supporting the upward move.
Entry Price: 76,811
First Target: 77,949
Second Target: 79,330
Third Target: 81,102
Stop Loss: Below the green support zone.
Remember this simple thing: Money management.
For any questions, please leave a comment.
Thank you.

BitcoinBTCUSD
- Rising Wedge as an corrective pattern in Long Time Frame
- Order Block
- Sell Side Liquidity
- Bullish Channel in Short Time Frame
- Completed " 12345 " Impulsive Waves and " A " Corrective Waves

BitcoinBTCUSD
- Fair Value Gap
- Change of Characteristics
- Bullish Channel as an corrective pattern in Long Time Frame
- RSI - Divergence
- Order Block

BitcoinBTCUSD
- Consolidation Phase
- Break of Structure
- Symmetrical Triangle as an corrective pattern in Short Time Frame
- RSI - Divergence
- Impulse and " AB " Correction

#BTC/USDT Let Bitcoin make a new ATH#BTC
The price is moving in a descending channel on the 1-hour timeframe. It has reached the lower boundary and is heading towards a breakout, with a retest of the upper boundary expected.
We are seeing a bearish bias in the Relative Strength Index (RSI), which has reached near the lower boundary, and an upward bounce is expected.
There is a key support zone in green at 87300, and the price has bounced from this level several times. Another bounce is expected.
We are seeing a trend towards stabilizing above the 100-period moving average, which we are approaching, supporting the upward trend.
Entry Price: 87988
First Target: 88350
Second Target: 88722
Third Target: 89287
Remember a simple principle: Money Management.
Place your stop-loss order below the green support zone.
For any questions, please leave a comment.
Thank you.

BitcoinBTCUSD
- Completed " 1234 " Impulsive Waves
- Buy Side Liquidity
- Bearish Channel as an corrective pattern in Short Time Frame
- RSI - Divergence
- Order Block

BitcoinBTCUSD
- Change of Characteristics
- Completed " 1234 " Impulsive Waves
- Break of Structure
- Fair Value Gap
- Resistance Level

understanding how technical workson btc move and learning, we firstly need to view back starting from the week 1 timeframe down to D1 H4 H1 M30 M15 and M5 to understand how the chart move and view. without understanding the past candle knowing the current market wont be easy because the current and past works together so we focus firstly on both, then by checking the move its show to determine what the next movement will give.

#BTC/USDT – Support Reversal & Bullish Recovery Outlook#BTC
The price is moving in a descending channel on the 1-hour timeframe and is expected to break out and continue upwards.
We have a trend to stabilize above the 100-period moving average again.
We have a downtrend on the RSI indicator, which supports an upward move if it breaks above it.
We have a key support zone in green that pushed the price higher at 95327.
Entry price: 95815
First target: 96158
Second target: 96865
Third target: 97661
For risk management, don't forget stop-loss orders and capital management.
The stop-loss should be below the green support zone.
Upon reaching the first target, take some profits and then change the stop-loss order to an entry order.
For any questions, please comment.
Thank you.

BitcoinBTCUSD
- Exp Fiat as an corrective pattern in Long Time Frame
- Break of Structure
- Demand Zone
- Buy Side Liquidity
- Order Block

Perfect prediction of BTC trend, today's retracement continuesWith the emergence of the double top structure, gold and silver investors have been taking profits, and market funds have continued to flow into crypto assets led by BTC and ETH.
Historically, BTC and the broader cryptocurrency market have risen after gold peaks, driven by capital rotation.
In his opening remarks at the Federal Reserve's first Payment Innovation Conference held today, Federal Reserve Governor Waller spoke highly of cryptocurrencies and the "DeFi industry." Waller noted that the conference aims to explore how blockchain and cryptocurrency can be integrated into mainstream finance.
At the same time, the Federal Reserve also indicated that it would create a new era in the payment field, and the DeFi industry would not be doubted or despised.
Waller also revealed that he has proposed setting up a new type of account at the central bank, which he called a "payment account." Waller said he has asked the Fed to consider this new type of account, which would make it easier for businesses to access the central bank's payment channels without having to have a full master account. This move has clearly increased market attention for cryptocurrencies.
In the subsequent BTC trading market, we can once again use 109500-108500 as short-term support, and go long on pullbacks to see rebounds. Pay attention to the 113000-115000 resistance zone above. If the momentum is maintained, it may move towards 120000.
BITSTAMP:BTCUSD BITSTAMP:BTCUSD

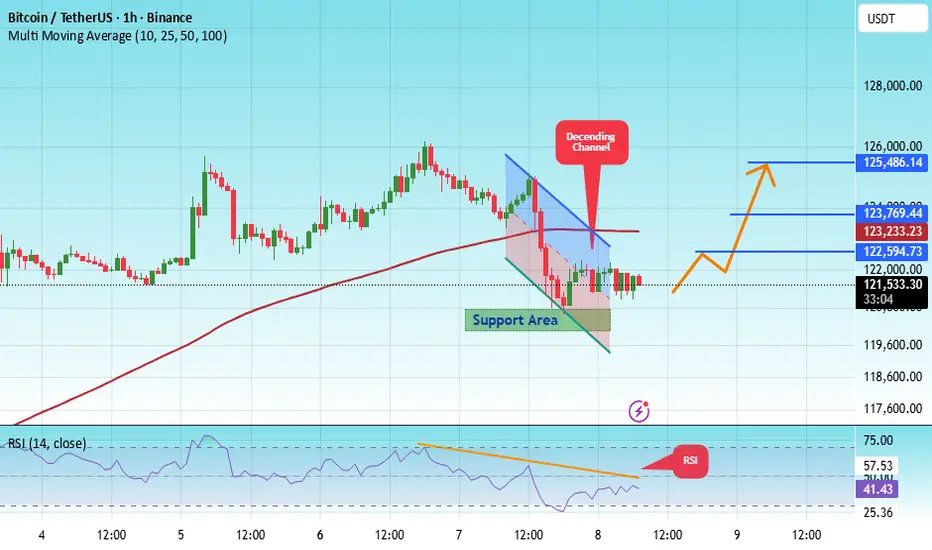
#BTC/USDT bounce from Support, Bullish Momentum Intact#BTC
The price is moving within a descending channel on the 1-hour frame, adhering well to it, and is heading for a strong breakout and retest.
We have a bearish trend on the RSI indicator that is about to be broken and retested, which supports the upward breakout.
There is a major support area in green at 120,500, which represents a strong support point.
We are heading for consolidation above the 100 moving average.
Entry price: 121,666.
First target: 122,600.
Second target: 123,770.
Third target: 125,480.
Don't forget a simple matter: capital management.
When you reach the first target, save some money and then change your stop-loss order to an entry order.
For inquiries, please leave a comment.
Thank you.
#BTC/USDT Bullish Divergence on 1H, Low Risk Trade#BTC
The price is moving within a descending channel on the 1-hour frame, adhering well to it, and is heading for a strong breakout and retest.
We have a bearish trend on the RSI indicator that is about to be broken and retested, which supports the upward breakout.
There is a major support area in green at 109800, which represents a strong support point.
For inquiries, please leave a comment.
We are in a consolidation trend above the 100 Moving Average.
Entry price: 111164
First target: 111727
Second target: 112450
Third target: 113470
Don't forget a simple matter: capital management.
When you reach the first target, save some money and then change your stop-loss order to an entry order.
For inquiries, please leave a comment.
Thank you.

BTC perfectly hits $120K, latest BTC analysis and operations#BTCUSD
After nearly a week of volatile consolidation, BTC once again touched around 120,000. I have already made it clear to everyone before that once BTC stabilizes above 116,500, it may first touch 118,000 and then challenge the macro resistance level of 120,000. I think anyone who had carefully reviewed the strategy and thought seriously about the ideas behind it would have made substantial profits. Currently, BTC maintains an overall upward trend, but may face the risk of an overbought pullback in the short term. Those with sufficient funds in their accounts can consider shorting with a light position. BTC may reach 118,000-117,000 and stabilize before rebounding.

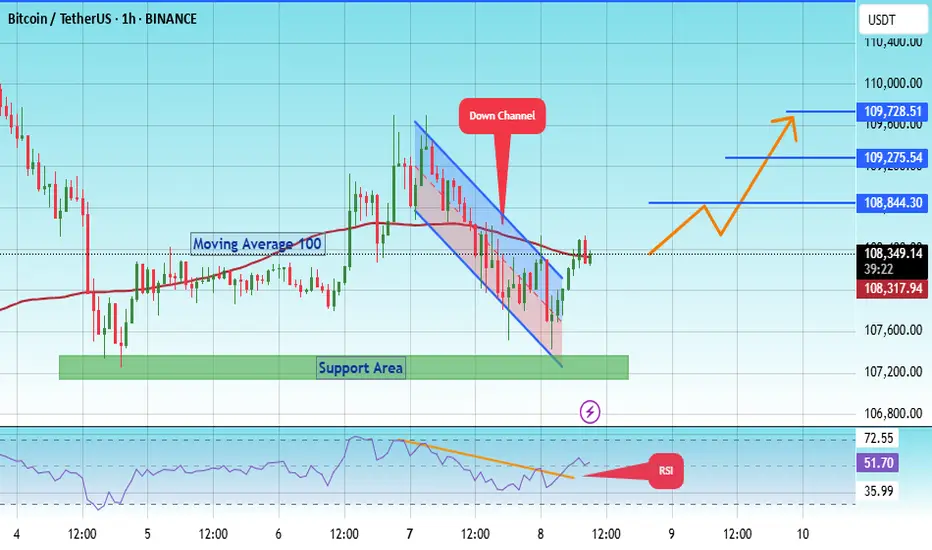
#BTC/USDT Bitcoin Recovers Above 108,000 $#BTC
The price is moving within a descending channel on the 1-hour frame, adhering well to it, and is on its way to breaking it strongly upwards and retesting it.
We are seeing a bounce from the lower boundary of the descending channel. This support is at 107600.
We have a downtrend on the RSI indicator that is about to break and retest, supporting the upside.
There is a major support area in green at 107217, which represents a strong basis for the upside.
Don't forget a simple thing: ease and capital.
When you reach the first target, save some money and then change your stop-loss order to an entry order.
For inquiries, please leave a comment.
We are looking to hold above the Moving Average 100.
Entry price: 108337.
First target: 108844.
Second target: 109275.
Third target: 109728.
Don't forget a simple thing: ease and capital.
When you reach the first target, save some money and then change your stop-loss order to an entry order.
For inquiries, please leave a comment.
Thank you.
Long positions have achieved profits, BTC market outlook📰 News information:
1. Pay attention to the trend of gold and US bonds
📈 Technical Analysis:
At present, BTC has rebounded and profited, and rebounded to around 108,000 again. 109,000 is also the upper track of the Bollinger Band. There is a certain suppression in the short term. Before the suppression fails to break through effectively, BTC may still fall into a weak and volatile market. If BTC hits resistance and pressure above 108,000-109,000 during the day, you can consider shorting. In view of the current volatile market, everyone must strictly control their positions, use leverage prudently, and do a good job of risk management to cope with market uncertainties.
🎯 Trading Points:
SELL 108,000-109,000
TP 107,000-106,000-105,000
In addition to investment, life also includes poetry, distant places, and Allen. Facing the market is actually facing yourself, correcting your shortcomings, confronting your mistakes, and strictly disciplining yourself. I hope my analysis can help you🌐.
TVC:GOLD OANDA:XAUUSD FX:XAUUSD FOREXCOM:XAUUSD PEPPERSTONE:XAUUSD FXOPEN:XAUUSD

BITCOIN - Price can continue grow inside flat to $107933 level#BTC
The price is moving within a descending channel on the 1-hour frame and is expected to break and continue upward.
We have a trend to stabilize above the 100 moving average once again.
We have a downtrend on the RSI indicator that supports the upward move with a breakout.
We have a support area at the lower boundary of the channel at 106500, acting as strong support from which the price can rebound.
We have a major support area in green that pushed the price upward at 106000.
Entry price: 106736
First target: 106996
Second target: 107434
Third target: 107933
To manage risk, don't forget stop loss and capital management.
When you reach the first target, save some profits and then change your stop order to an entry order.
For inquiries, please comment.
Thank you.

#BTC/UST#BTC
The price is moving within a descending channel on the 1-hour frame, adhering well to it, and is on its way to breaking it strongly upwards and retesting it.
We are seeing a rebound from the lower boundary of the descending channel, which is support at 106,000.
We have a downtrend on the RSI indicator that is about to break and retest, supporting the upward trend.
We are looking for stability above the 100 moving average.
Entry price: 106,600
First target: 106,750
Second target: 107,000
Third target: 107,291

BTC is expected to retreat in the short term, focus on 104500📰 Impact of news:
1. The ceasefire agreement reached earlier did not take effect, and Trump believed that both sides violated the agreement
2. Federal Reserve Chairman Powell delivered a speech 3 hours later
📈 Market analysis:
I haven't updated BTC for a while. Today I want to share my views on BTC with you. BTC is currently encountering resistance and pressure at the 106,000 level and is beginning to retreat. From the technical indicators, MACD is in a dead cross, and RSI is retreating after reaching the overbought area. There is no problem with the short-term bearish trend, and it is expected that it will be able to retreat to the 104,500 level without much problem. However, the recent decline in the gold market, DXY market, and crude oil market may cause funds to flow into the BTC market.
🏅 Trading strategies:
SELL 106000-105500
TP 105000-104500
BUY 140500-103500
TP 105000-106000
If you agree with this view, or have a better idea, please leave a message in the comment area. I look forward to hearing different voices.

Bitcoin (BTC/USD) 2-Hour Candlestick Chart2-hour candlestick chart displays the recent price movement of Bitcoin (BTC) against the U.S. Dollar (USD), showing a current price of $103,904.89 with a gain of $595.12 (+0.58%) as of 01:22:41. The chart highlights a volatile period with significant price fluctuations, including a sharp drop followed by a recovery, and includes key price levels such as $106,099.25 and $102,803.95. The chart also features a highlighted support zone in pink and a resistance zone in light blue
